The metabolic rate of the biosphere and its components
By Vasco Grilo🔸 @ 2026-01-02T17:44 (+11)
This is a linkpost to https://www.pnas.org/doi/10.1073/pnas.2303764120
This is a linkpost for The metabolic rate of the biosphere and its components by Tori M. Hoehler, Dylan J. Mankel, Peter R. Girguis, Thomas M. McCollom, Nancy Y. Kiang, and Bo Barker Jørgensen, which was originally published in the Proceedings of the National Academy of Sciences on 12 June 2023. Below are the significance, abstract, and some parts I found interesting. I very much liked the article because I think individual (expected hedonistic) welfare per fully-healthy-organism-year might be proportional to “metabolic energy consumption per unit time at rest at a given temperature”^“exponent”. The metabolic energy consumption per unit time at rest is called basal metabolic rate for endothermic animals.
Significance
Assessing the relationship between energy flux and the quantity of biomass it sustains offers the potential to understand the biological “carrying capacity” for ecosystems on Earth and beyond. Our work supports this understanding by quantifying the energy–biomass relationship for the global biosphere and an environmentally diverse range of its components, and by exploring the factors—including the impact of humanity—that affect that relationship.
Abstract
We assessed the relationship between rates of biological energy utilization and the biomass sustained by that energy utilization, at both the organism and biosphere level. We compiled a dataset comprising >10,000 basal, field, and maximum metabolic rate measurements made on >2,900 individual species, and, in parallel, we quantified rates of energy utilization, on a biomass-normalized basis, by the global biosphere and by its major marine and terrestrial components. The organism-level data, which are dominated by animal species, have a geometric mean among basal metabolic rates of 0.012 W (g C)-1 and an overall range of more than six orders of magnitude. The biosphere as a whole uses energy at an average rate of 0.005 W (g C)-1 but exhibits a five order of magnitude range among its components, from 0.00002 W (g C)-1 for global marine subsurface sediments to 2.3 W (g C)-1 for global marine primary producers. While the average is set primarily by plants and microorganisms, and by the impact of humanity upon those populations, the extremes reflect systems populated almost exclusively by microbes. Mass-normalized energy utilization rates correlate strongly with rates of biomass carbon turnover. Based on our estimates of energy utilization rates in the biosphere, this correlation predicts global mean biomass carbon turnover rates of ~2.3 y-1 for terrestrial soil biota, ~8.5 y-1 for marine water column biota, and ~1.0 y-1 and ~0.01 y-1 for marine sediment biota in the 0 to 0.1 m and >0.1 m depth intervals, respectively.
Power and MSP at the Organism Level.
Fig. 1 presents “snapshots” from the Supplementary Interactive Plot of metabolic power vs. mass (Fig. 1A) and mass-specific metabolic power (MSP) vs. mass (Fig. 1B) for a specific configuration that includes basal rates only, with no temperature normalization, and using carbon-based mass units. Fig. 1A shows that the basal metabolic power of individuals scales with carbon biomass (g) across ~22 orders of magnitude (<10-14 to >107 g C) according to a power law:
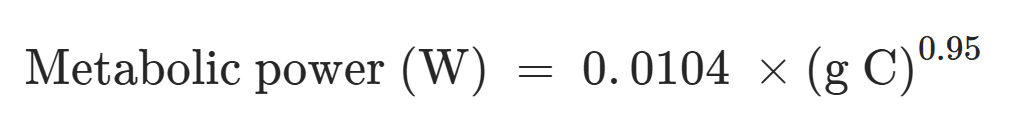
Fig. 1.
The exponent, k = 0.95 ± 0.003, is close to unity and shows that the metabolic rates vary nearly proportionally to the biomass of the organisms, when viewed over the entire tree of life. This stands in contrast to the well-documented scaling of basal metabolic rates with mass in some taxa such as mammals (k = 0.73), birds (k = 0.67 to 0.74), fishes (k = 0.86), and insects (k = 0.66) (e.g., refs. 11–13 [relatedly, see Kleiber's law]). Within these taxa, metabolic power increases relatively less than the increase in biomass. These trends become clearer when metabolic power is normalized to body mass (Fig. 1B). Among the mammals or birds, mass-specific metabolic power (MSP) exhibits a systematic 100-fold decrease with increasing body mass, from pygmy shrew to blue whale or from hummingbird to ostrich.
Power and MSP at the Biosphere Level.
Table 1. Estimates of mass (Pg = 1015 g), power (TW = 1012 Watt), and MSP for the global biosphere
| Mass (Pg C)* | Uncertainty | Power (TW) | Uncertainty (SD) | MSP (W/g C) | Uncertainty | |
| Global total | 510 | 1.2-fold | 2,800 | 270 | 0.0054 | 1.2-fold |
| Marine | ||||||
| Producers [autotrophs] (photon capture) | 0.53† | 3.2-fold | 1,200 | 130 | 2.3 | 3.2-fold |
| Producers (autotrophic resp.) | 0.53† | 3.2-fold | 90 | 20 | 0.18 | 3.3-fold |
| Consumers [heterotrophs], pelagic [open ocean] | 5 | 3.3-fold | 57 | 5 | 0.011 | 3.4-fold |
| Consumers, sediments 0 to 0.1m [below the seabed] | 2.3‡ | 2.1-fold | 3 | 0.8 | 0.0013 | 2.3-fold |
| Consumers, sediments > 0.1m | 4.1§ | 3.2-fold | 0.07 | — | 0.00002 | — |
| Terrestrial | ||||||
| Producers (photon capture) | ||||||
| Total mass | 450¶ | ± 50 | 1,600 | 240 | 0.0036 | ± 0.0007 |
| Active tissue# [non-woody tissue] | 200 | — | 1,600 | 240 | 0.01 | — |
| Producers (autotrophic resp.) | ||||||
| Total mass | 450¶ | ± 50 | 80 | 20 | 0.0002 | ± 0.00005 |
| Active tissue# | 200 | — | 80 | 20 | 0.0005 | — |
| Consumers, soils 0 to 8m | 20 | 1.9-fold | 50 | 13 | 0.0025 | 2.1-fold |
| Consumers, deep biosphere | 27|| | ± 4|| | — | — | — | — |
| Humanity (metabolic) | 0.09‡ | ± 0.04 | 1.07** | 0.005 | 0.012 | ± 0.005 |
| Humanity (technological) | 0.09‡ | ± 0.04 | 18.5†† | 0.005 | 0.21 | ± 0.09 |
| Livestock | 0.10 | ± 0.015 | 3.9 | 0.4 | 0.039 | ± 0.007 |
| Geochemical | ||||||
| Marine | — | — | 0.03 | — | — | — |
| Terrestrial | — | — | 0.005 | — | — | — |
The global photosynthetic biosphere harnesses about 2,800 TW of light energy via photosynthesis (i.e., as “photon capture”), which is ~3% of the global full spectrum solar irradiance at Earth’s surface and ~7% of the available photosynthetically active radiation (PAR). The combined gross primary productivity (GPP) of marine and terrestrial primary producers, about 220 to 340 Pg C y-1 (20, 21), represents a chemical energy flux of 280 TW when utilized in respiration, of which 170 TW is attributable to autotrophic respiration in phototrophs and 110 TW is attributable to heterotrophic respiration by Earth’s nonphotosynthetic biota*.
Bob Fischer @ 2026-01-03T19:02 (+9)
Interesting, Vasco. I wouldn't have guessed that this has much to do with hedonic capacity at all. Endotherms sacrifice energy efficiency for thermal independence; ectotherms sacrifice thermal independence for energy efficiency. But these traits don't obviously have much to do with the cognitive capacities of the animals in question. Would you say more about your hunch?
Vasco Grilo🔸 @ 2026-01-03T22:50 (+3)
Thanks for the relevant question, Bob!
Any production requires energy. So I feel like metabolic energy consumption should be relevant for the production of (positive or negative) welfare. In addition, in allometry, "the study of the relationship of body size to shape,[1] anatomy, physiology and behaviour", "The relationship between the two measured quantities is often expressed as a power law equation (allometric equation)". So I would say welfare per fully-healthy-organism-year being proportional to "property of interest"^"exponent" is a reasonable initial speculation.
To elaborate, I think individual welfare per fully-healthy-animal-year could be proportional to "metabolic energy consumption per unit time at rest"^"exponent 1" because i) individual welfare per fully-healthy-animal-year could be proportional to "individual number of neurons"^"exponent 2", and ii) metabolic energy consumption per unit time at rest is roughly proportional to "individual number of neurons"^"exponent 3" (which means the individual number of neurons is roughly proportional to "metabolic energy consumption per unit time at rest"^(1/"exponent 3")). Under these conditions, "metabolic energy consumption per unit time at rest"^"exponent 1" would be proportional to "metabolic energy consumption per unit time at rest"^("exponent 2"/"exponent 3"), and therefore "exponent 1" = "exponent 2"/"exponent 3".
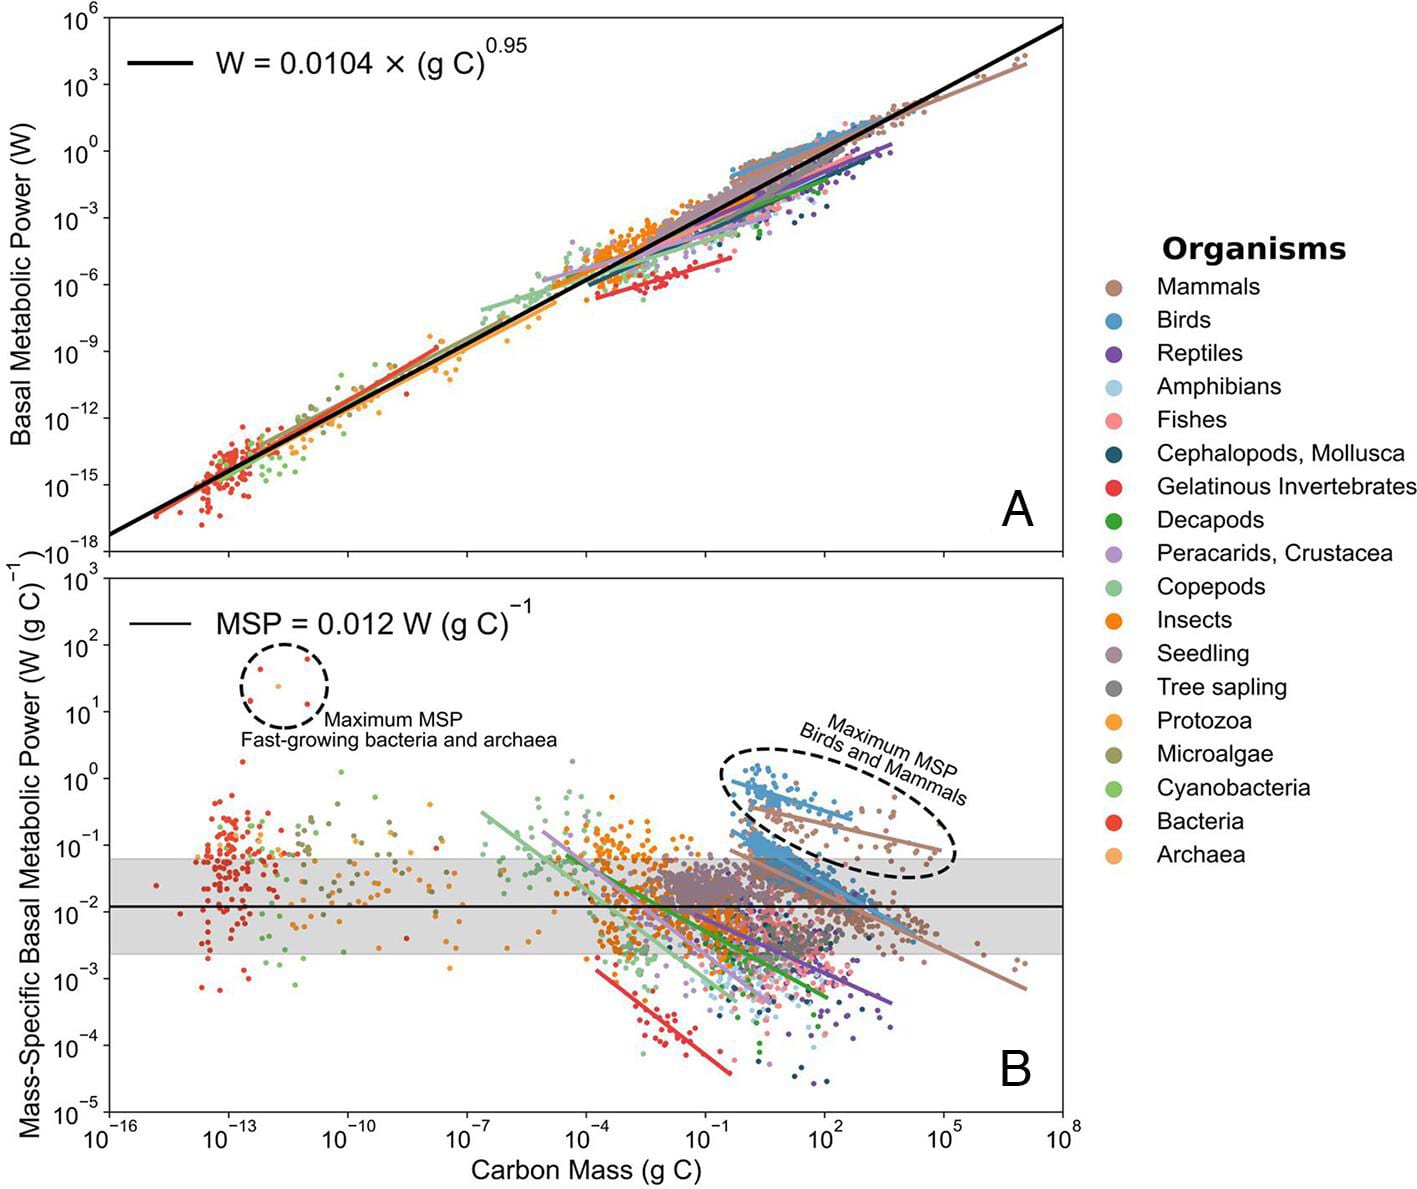
On i) the possibility of individual welfare per fully-healthy-animal-year being proportional to "number of neurons"^"exponent 2", as illustrated in the graph below, the estimates for welfare ranges in your book about comparing welfare across species are pretty well explained by "individual number of neurons"^0.188. The welfare range is the difference between the maximum and minimum welfare per unit time, and I would say it is reasonable to assume it is proportional to the welfare per fully-healthy-animal-year, although I would like to see more research on this.
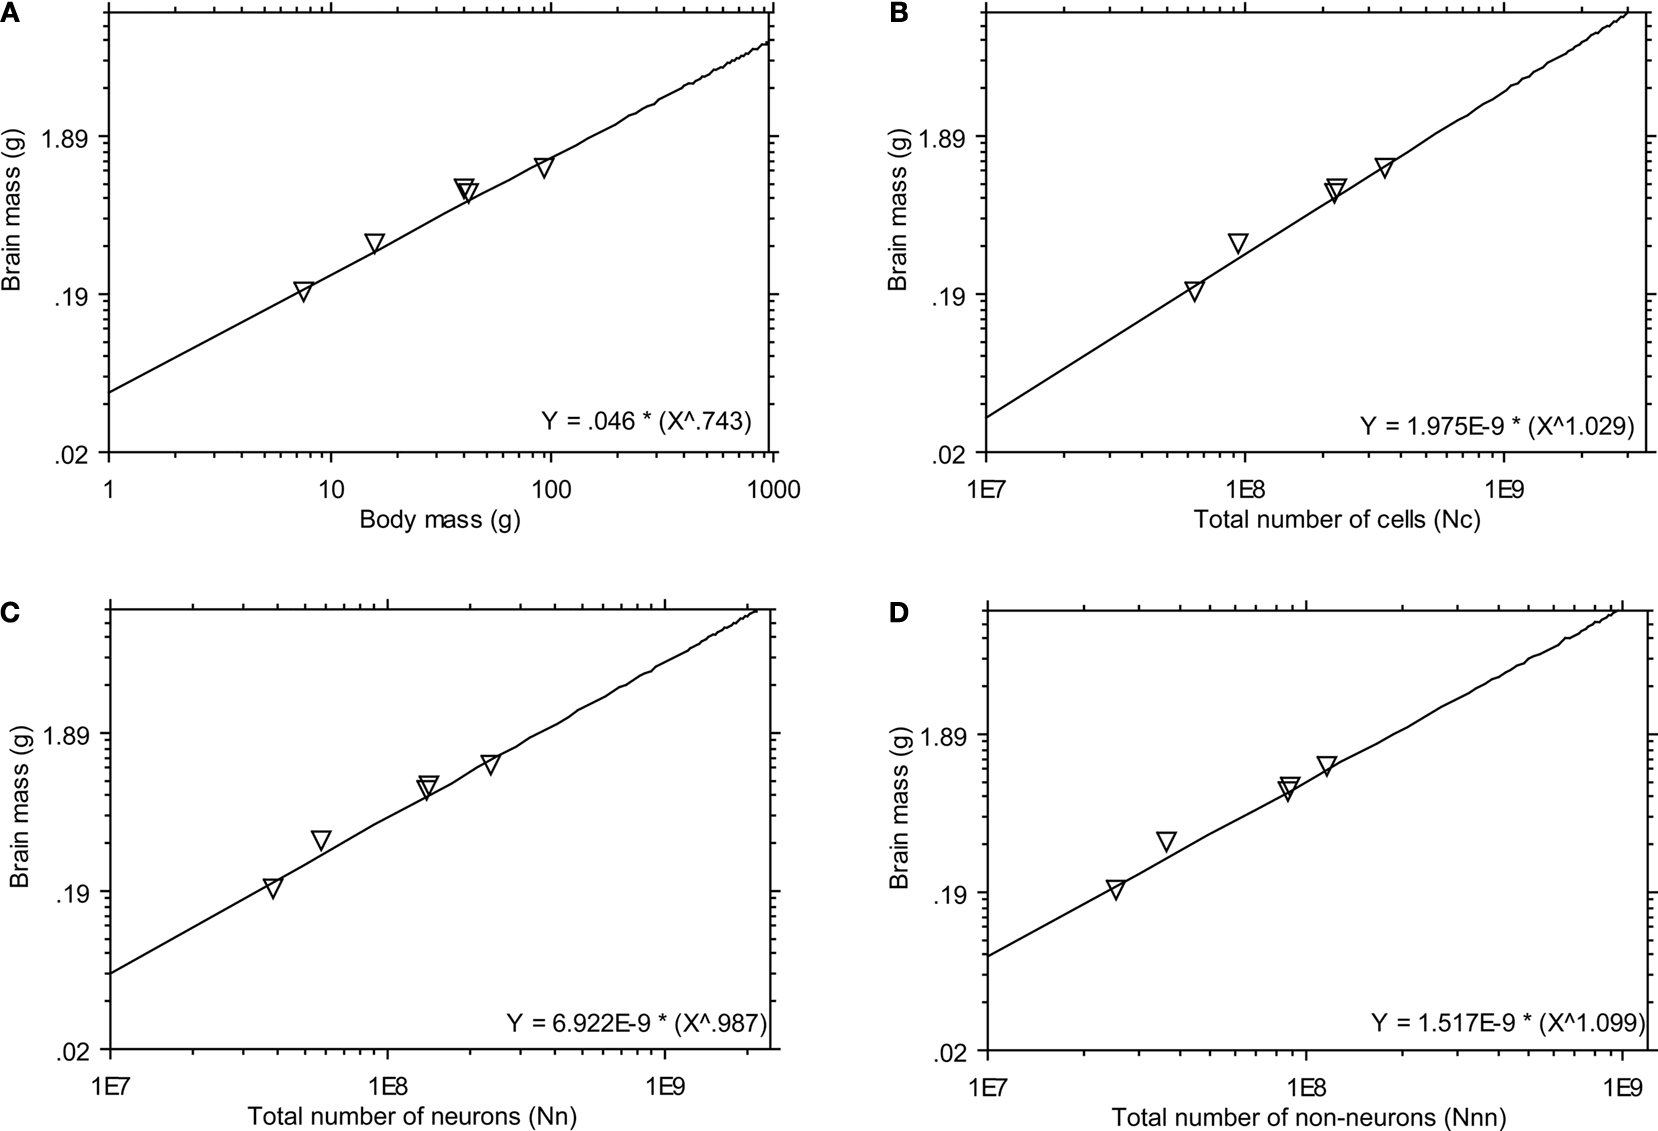
On ii) metabolic energy consumption per unit time at rest being roughly proportional to "individual number of neurons"^"exponent 3", from Equation [1] of the article (see here), metabolic energy consumption per unit time at rest is proportional to "individual mass of carbon"^0.95 "when viewed over the entire tree of life". From the Supplementary Information of the article, the ratio between the individual carbon and dry mass is “generally taken to be 0.5 [constant across species]”. So the metabolic energy consumption per unit time at rest is proportional to "individual dry mass"^0.95 "when viewed over the entire tree of life". I believe individual dry mass is roughly proportional to individual mass. From the Supplementary Information of the article, "the ratio of dry mass to wet mass (DM/WM) used in our database ranges from 0.04 in the medusae of Cnidaria (jellyfish) to 0.40 in insects, with intermediate values of 0.26 in fishes, 0.3 in bacteria, 0.34 in birds and 0.38 in mammals. Makarieva et al. [9] used a conversion factor of DM/WM = 0.3 for all organisms". So I think metabolic energy consumption per unit time at rest is roughly proportional to "individual mass"^0.95 "when viewed over the entire tree of life". From Figure 2 of Sargo et al. (2009), which is below, I also suspect individual mass is roughly proportional to "brain mass"^"exponent 4" (A), and that brain mass is roughly proportional to "individual number of neurons"^"exponent 5" (C). So I conclude metabolic energy consumption per unit time at rest is roughly proportional to "individual number of neurons"^(0.95*"exponent 4"*"exponent 5"), such that ii) holds for "exponent 3" = 0.95*"exponent 4"*"exponent 5".
Bob Fischer @ 2026-01-04T00:02 (+4)
Thanks for explaining!
Vasco Grilo🔸 @ 2026-01-12T18:07 (+2)
You are welcome! I have now estimated the total welfare of animal populations, trees, and bacteria and archaea assuming individual welfare per fully-healthy-organism-year is proportional to "metabolic energy consumption per unit time at rest"^"exponent". I had recommended research informing how to increase the welfare of soil animals, but I am now more pessimistic about this. I currently think it is better to focus on decreasing the uncertainty about how the individual welfare per unit time of different organisms and digital systems compares with that of humans.
Vasco Grilo🔸 @ 2026-06-26T13:56 (+2)
In addition, in allometry, "the study of the relationship of body size to shape,[1] anatomy, physiology and behaviour", "The relationship between the two measured quantities is often expressed as a power law equation (allometric equation)".
From the book "Scale: The Universal Laws of Growth, Innovation, Sustainability, and the Pace of Life in Organisms, Cities, Economies, and Companies" by Geoffrey West:
This scaling law for metabolic rate [this one], known as Kleiber’s law after the biologist who first articulated it, is valid across almost all taxonomic groups, including mammals, birds, fish, crustacea, bacteria, plants, and cells [see this section of my linkpost for further discussion]. Even more impressive, however, is that similar scaling laws hold for essentially all physiological quantities and life-history events, including growth rate, heart rate, evolutionary rate, genome length, mitochondrial density, gray matter in the brain, life span, the height of trees and even the number of their leaves. Furthermore, when plotted logarithmically this dizzying array of scaling laws all look like Figure 1 and therefore have the same mathematical structure. They are all “power laws” and are typically governed by an exponent (the slope of the graph), which is a simple multiple of ¼, the classic example being the ¾ for metabolic rate. So, for example, if the size of a mammal is doubled, its heart rate decreases by about 25 percent. The number 4 therefore plays a fundamental and almost magically universal role in all of life.13
Footnote 13:
There are several excellent texts summarizing the various allometric scaling laws in biology. Among them are: W. A. Calder, Size, Function and Life History (Cambridge, MA: Harvard University Press, 1984); E. L. Charnov, Life History Invariants (Oxford, UK: Oxford University Press, 1993); T. A. McMahon and J. T. Bonner, On Size and Life (New York: Scientific American Library, 1983); R. H. Peters, The Ecological Implications of Body Size (Cambridge, UK: Cambridge University Press, 1986); K. Schmidt-Nielsen, Why Is Animal Size So Important? (Cambridge, UK: Cambridge University Press, 1984).
Tables 1, 2, and 3 of chapter 4 have lots of predicted and observed allometric equations.