Comparing Health Interventions in Colombia and Nigeria: Which are More Effective and by How Much?
By alejoacelas 🔸 @ 2023-03-24T13:48 (+51)
TL;DR: Nigeria bears 10 times the burden of Communicable, Maternal, Neonatal, and Nutritional (CMNN) diseases per capita than Colombia, despite both countries having similar health expenditures to combat these diseases. Applying the SNT framework suggests that health interventions are around 10 times more cost-effective in Nigeria even when comparing only the poorest regions within each country.
Why I decided to work on this topic
Chatting with the members of my EA university group in Colombia, I noticed many of them were mainly interested in contributing to problems that affected their home country. Although Colombia is far from being one of the poorest countries in the world, various regions of the country still suffer from similar problems as less developed countries. I thought there might be a chance that we found opportunities with similar cost-effectiveness as those that EA tends to prioritize in the area of health and development.
Given that some students from my EA group were considering making career decisions based on a similar perception, I thought it worthwhile to spare a couple of hours to critically evaluate this line of reasoning, in the hope that this would allow them to make a more informed decision. Ideally, this research would answer the following questions:
- Within the ways to help in Colombia, which problems/interventions represent unusually cost-effective opportunities to help?
- How do the best opportunities identified in Colombia compare with the best opportunities abroad?
Unfortunately, both questions are too broad to cover them appropriately in the short time I dedicated to this work (approx. 40 hours). In order to make progress I decided focus on the much more narrow question:
In aggregate, how cost-effective do health interventions addressing communicable, maternal, neonatal and nutritional diseases in Colombia seem when compared to interventions in the same area in a substantially poorer country?
Although this question corresponds to only a fragment of our initial concern, a couple of considerations lead me to think that an answer to this question would still be informative to people considering whether to focus their career on helping others within the Colombian territory (even if they don’t plan to focus specifically on health interventions).
First, health interventions aimed at fighting communicable, maternal, neonatal and nutritional diseases (from now on CMNN interventions) form a substantial fraction of the EA portfolio of interventions focused on improving human welfare in the short term, which is the focus of most of the students I know who are considering whether to direct their careers at Colombian causes. Second, my impression is that the results of this investigation support certain heuristics for identifying impact opportunities that can be useful even outside health causes. I’ll say more about that in the conclusions section.
Approach
I use the Scale, Neglectedness and Tractability (SNT) framework to estimate the cost-effectiveness ratio of CMNN interventions between Colombia and Nigeria. Besides making the comparison for the two countries as a whole, I’ll also try to compare the poorest regions within each country to see if that changes the conclusions.
I chose Nigeria somewhat arbitrarily, mainly because several of GiveWell's recommended charities have operations in Nigeria (suggesting that there are unusually effective opportunities in the country) and because among the countries where GiveWell-recommended charities operate, Nigeria It is approximately in the middle of the distribution of poverty incidence.
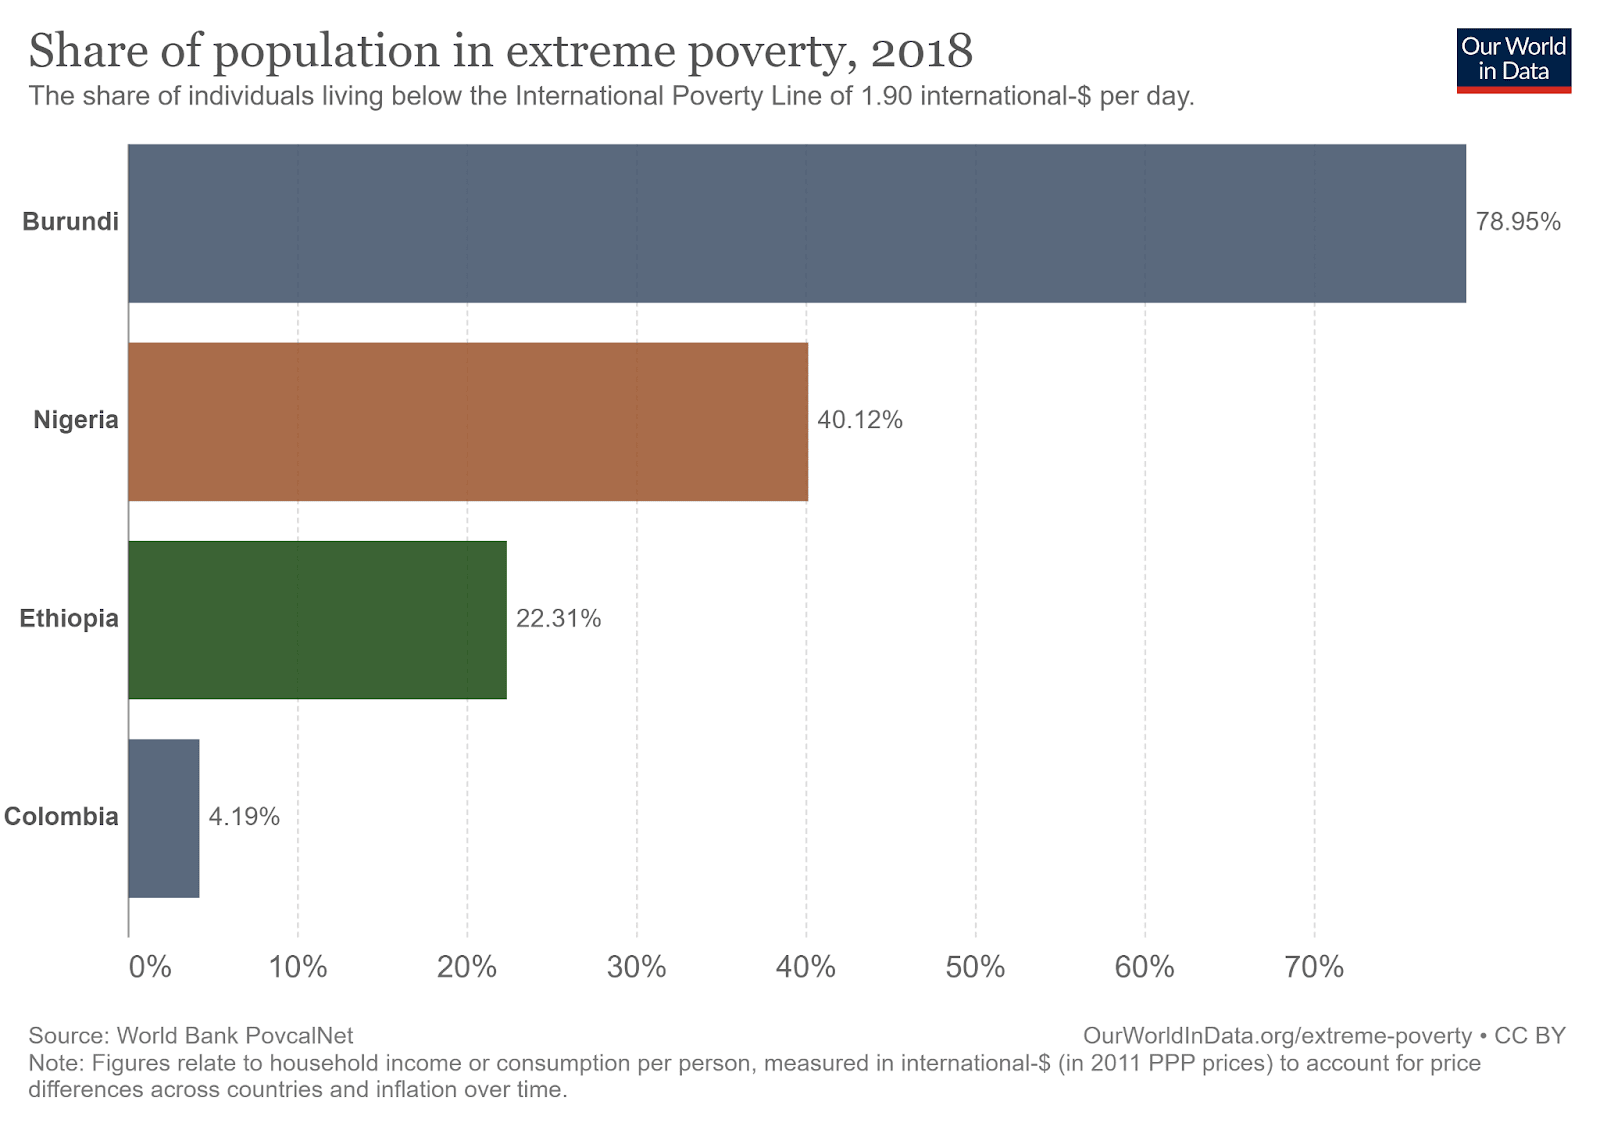
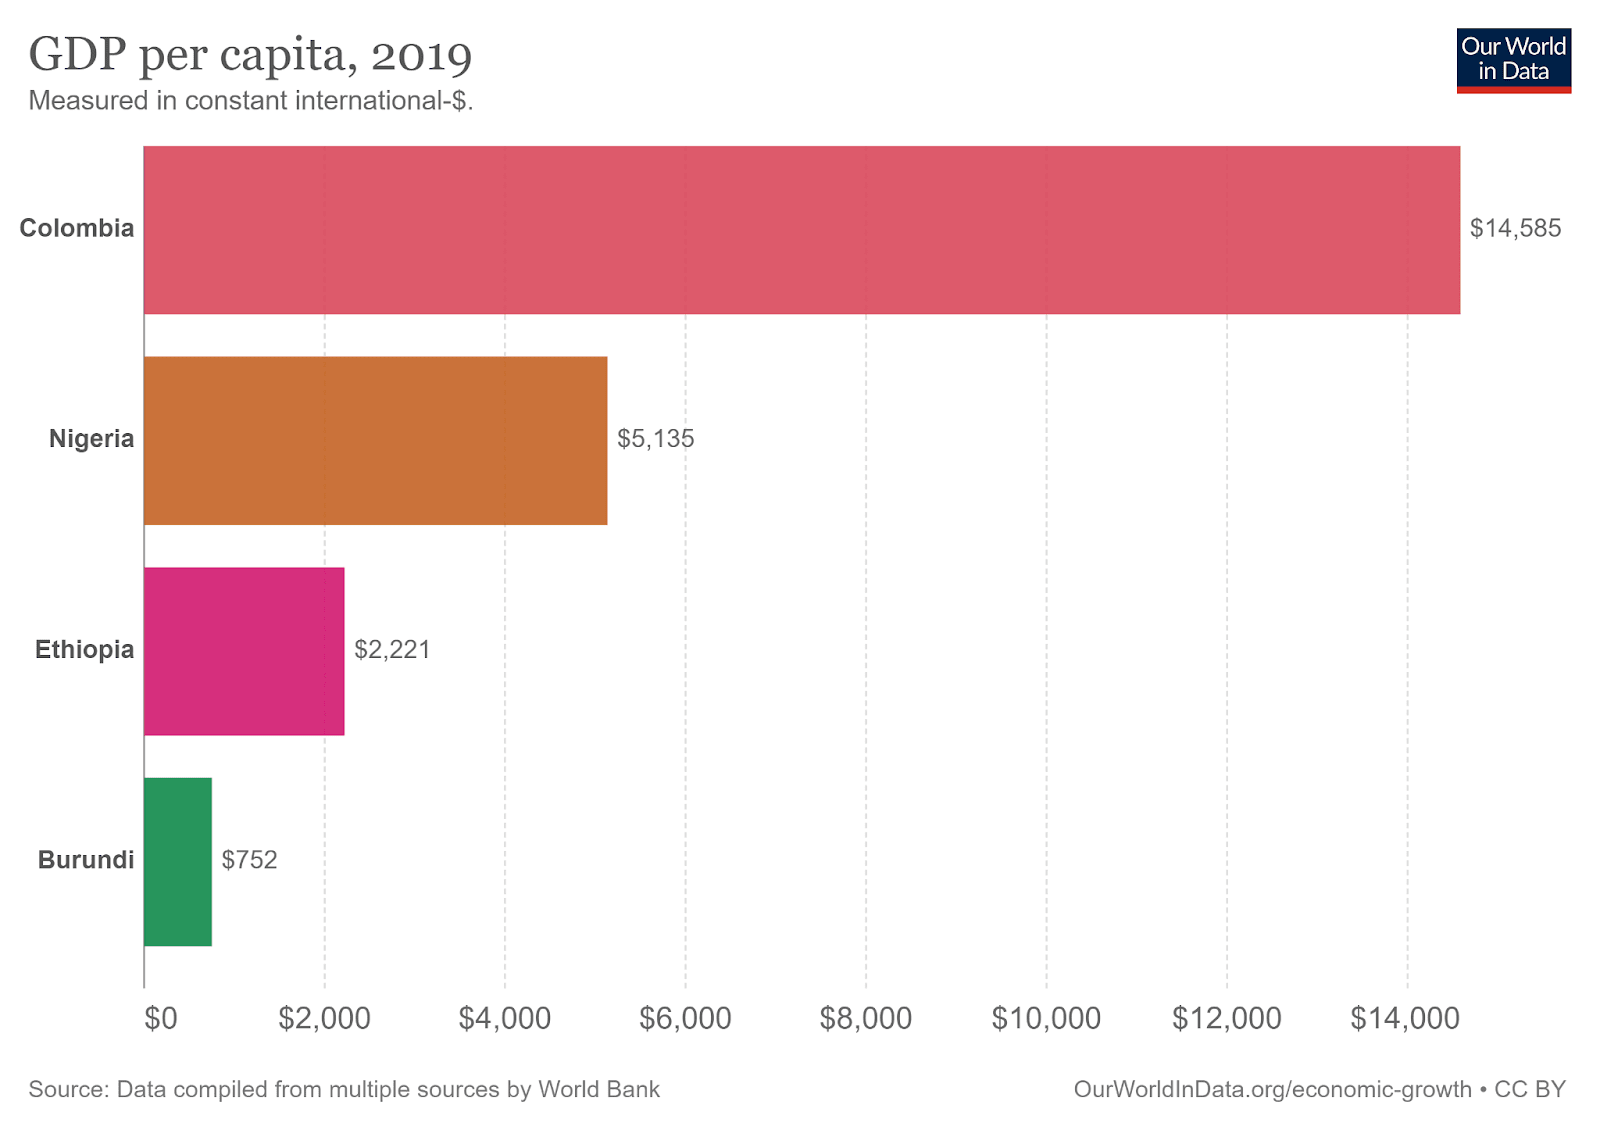
Percentage of the population living below the International extreme poverty line (up) and average income (GDP per capita) corrected for purchasing power in each country (down). Source: Our World in Data.
SNT
Given that the population of Nigeria is much bigger than Colombia’s, I’ll divide the scale and neglectedness figures by the total population of each country. It is easy to show that the population term cancels out in the product and the result is identical to the original SNT framework.
Scale (per person)
Headline result: In Nigeria, each inhabitant lost on average the equivalent of 4 months of healthy life (0.29 DALYs) to CMNN diseases in 2019, compared to 10 days for the average Colombian (0.03 DALYs). Although I couldn’t find the same data at the level of regions, the figures on infant mortality suggest a similar picture, where the most vulnerable regions in Nigeria have an infant mortality rate 5 times higher than the most vulnerable departments in Colombia.
The scale of a problem indicates how much would the world improve if the problem were solved. In the context of diseases, we can use Disability Adjusted Life Years (DALYs) to measure as a metric that combines the number of years lost and the reductions in life quality caused by a disease. When I talk about the burden of a disease, I’ll be referring to the number of DALYs lost to it.
One reason to expect a higher disease burden in Nigeria is that extreme poverty is much more prevalent in that country. In 2018, about 79 million people in Nigeria lived on less than US$2 a day (the international extreme poverty line), while in Colombia about 2 million were in the same condition. This corresponds to an incidence of extreme poverty of 39% in Nigeria and 4% in Colombia.
Due to the deprivations associated with poverty, those subjected to it are more likely to suffer from diseases like tuberculosis, malaria and preterm births, all of which fall under the category of communicable, maternal, neonatal and nutritional diseases. In many cases, these conditions are preventable or easy to treat, like by providing safe drinking water, appropriate waste management systems or inexpensive medications.
The three graphs below show the years of health lost (DALYs) due to different diseases and conditions for Nigeria, Colombia and Spain. The blue bars correspond to non-communicable diseases; the red bars to CMNN diseases and the gray bars to injuries and accidents.
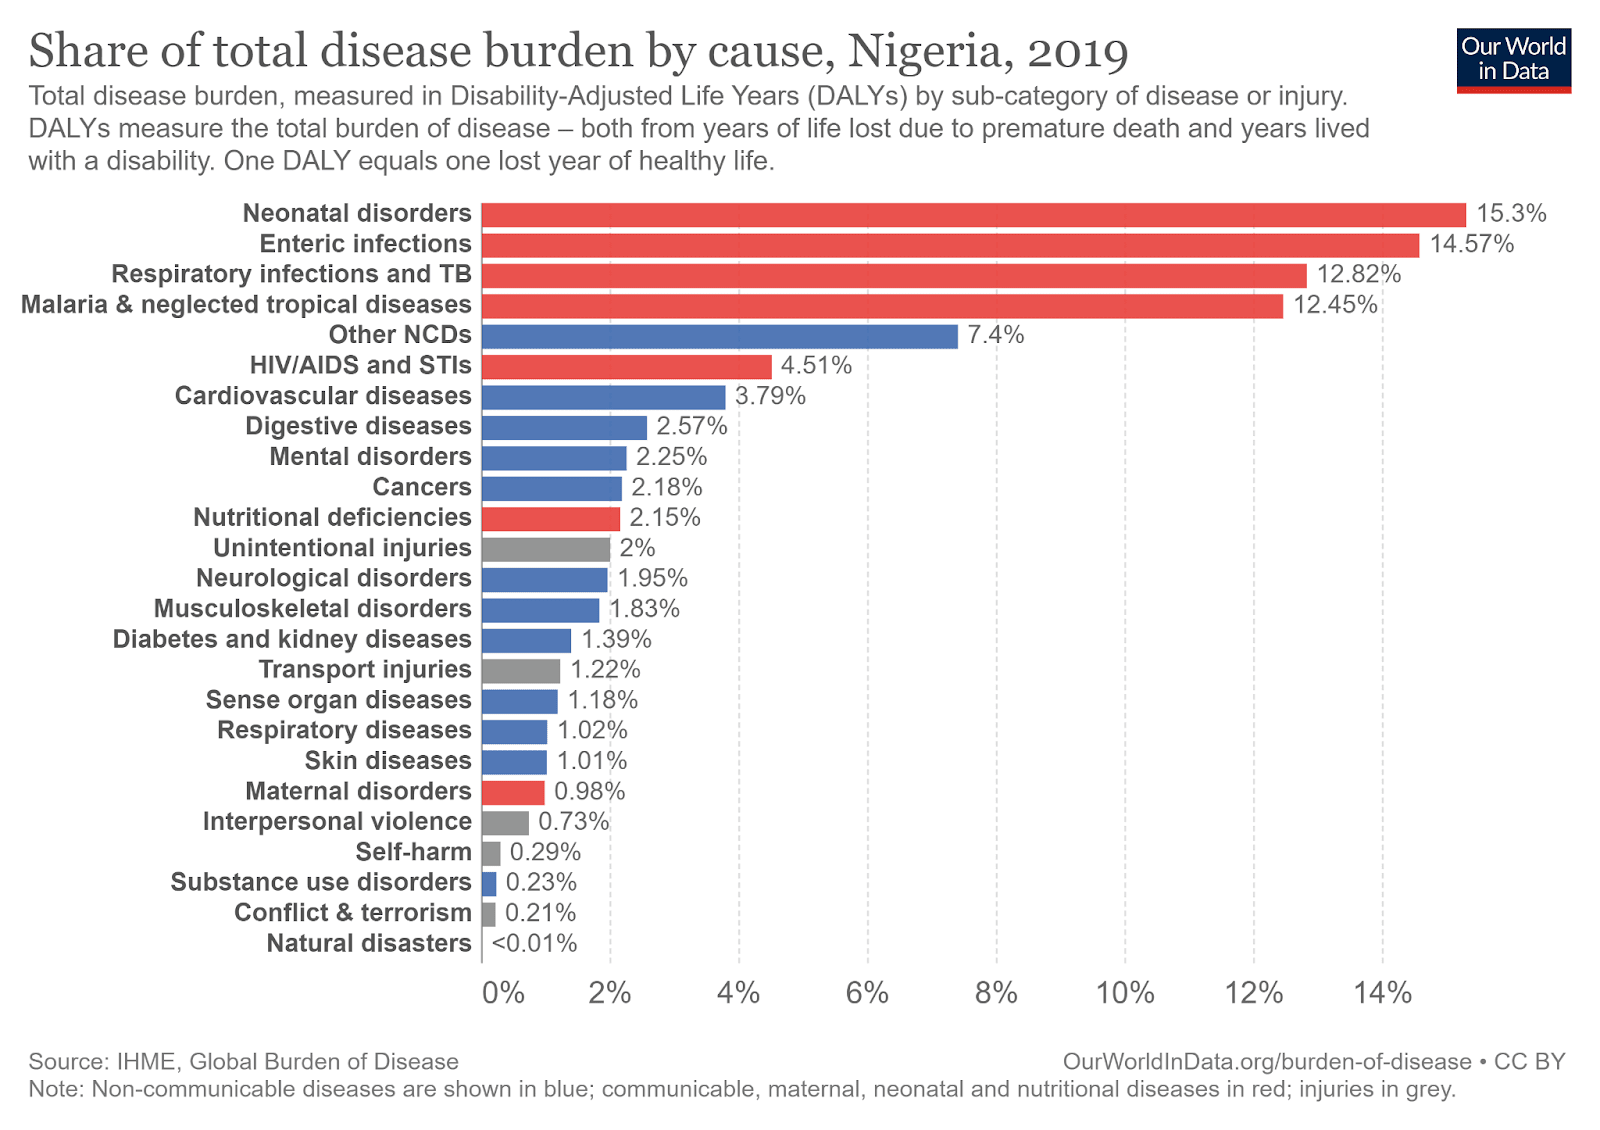
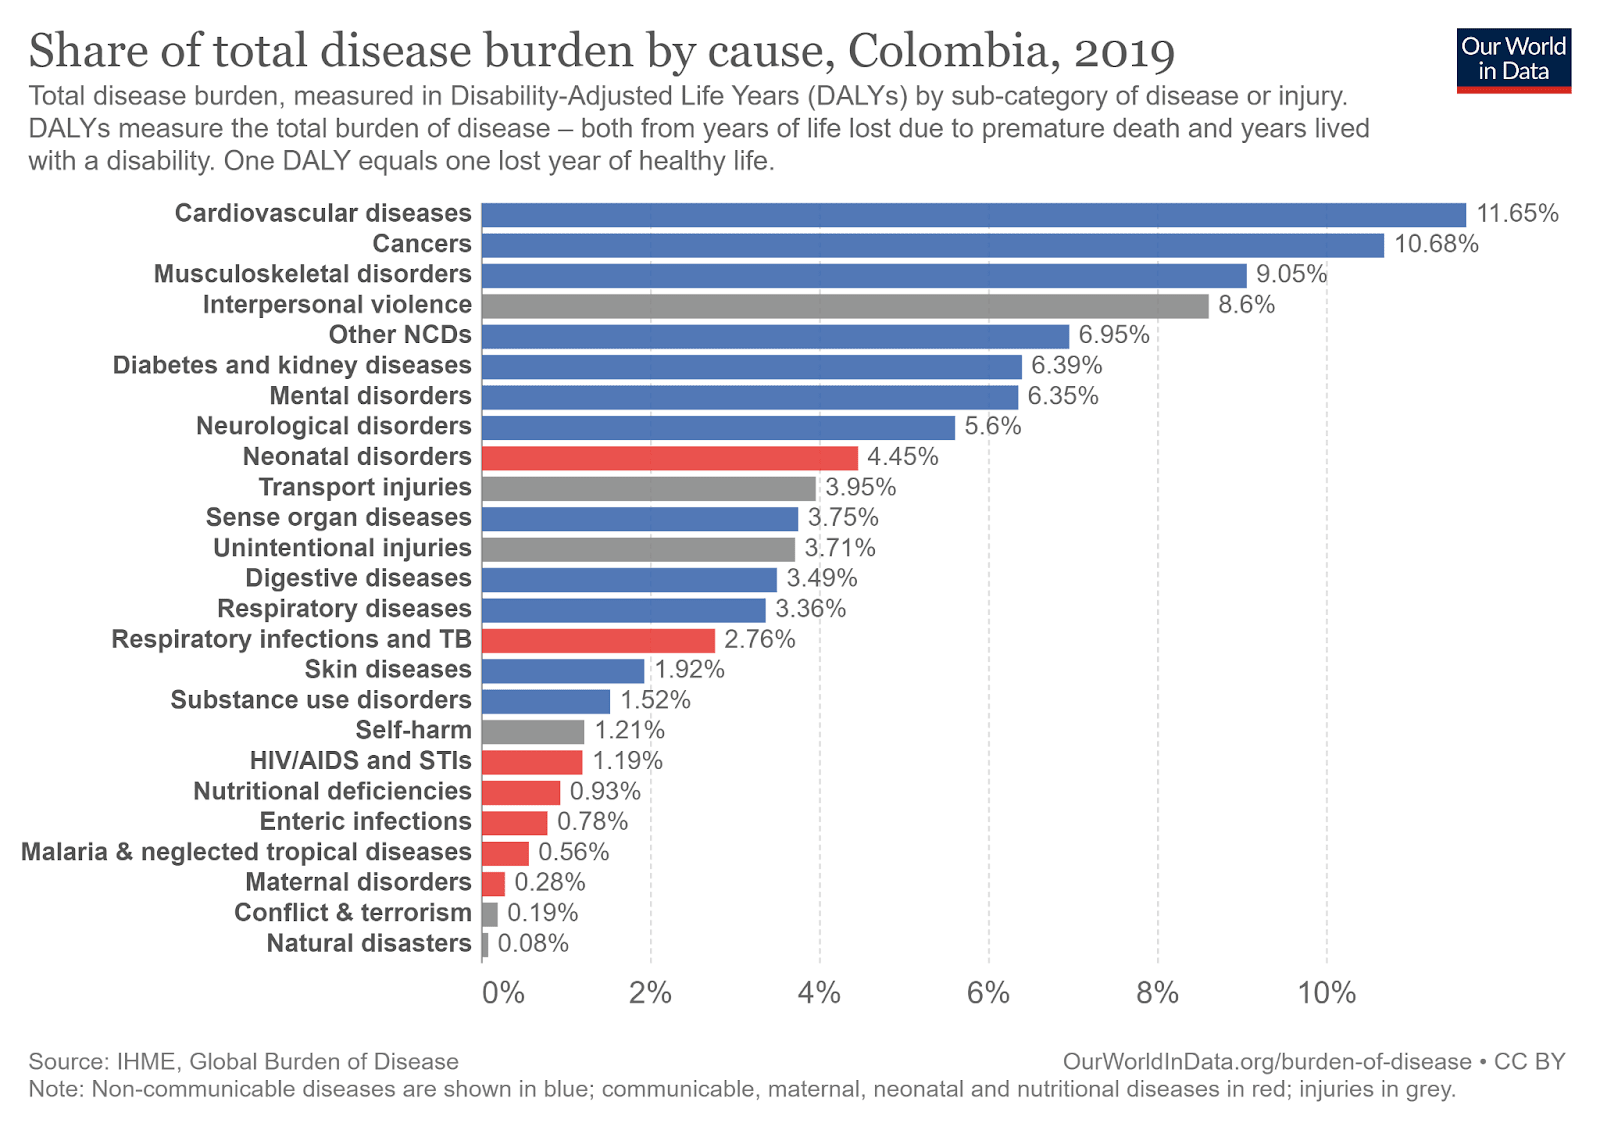
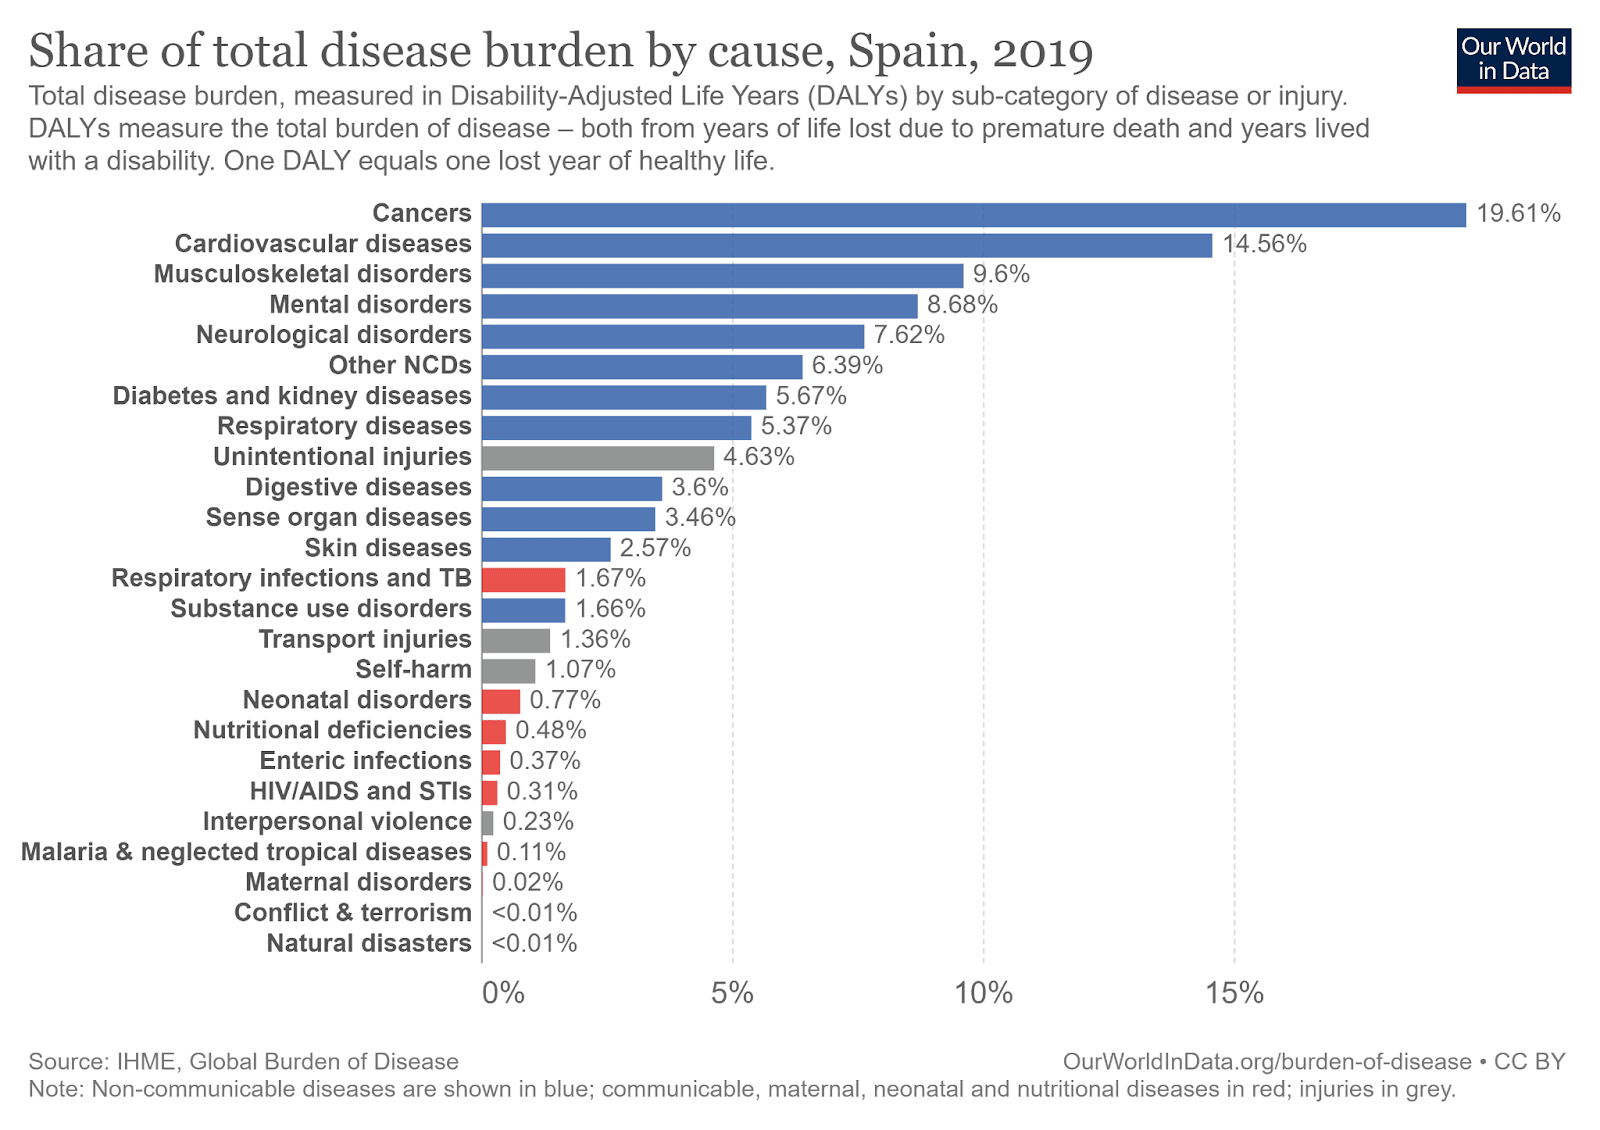
Number of DALYs lost to disease in Nigeria, Colombia and Spain (in that order). The red bars are CMNN diseases, the blue ones are non-communicable diseases and the gray ones are accidents and injuries. I chose Spain as a point of comparison thinking that it is a developed country similar in some aspects to Colombia. Source: Our World in Data.
In Nigeria the four main causes of lost health are neonatal disorders, enteric infections (mainly diarrhea and associated conditions), respiratory infections, and tropical diseases. In contrast, both in Colombia and Spain communicable diseases comprise the main sources of years of lost health, with the exception of interpersonal violence in Colombia which is unusually high both in the country and in the Latin American region.
To make figures comparable, we can calculate the years of health lost (DALYs) to CMNN diseases per 100,000 inhabitants. The differences among the three countries are overwhelming. Nigerians lose 9.7 times more years of health to CMNN diseases than Colombians, who in turn have a burden 3 times higher than the Spanish. A similar pattern is found in the incidence of extreme poverty, where the African country has a rate 9.6 times higher than Colombia, which in turn has a rate 4.8 times higher than Spain.
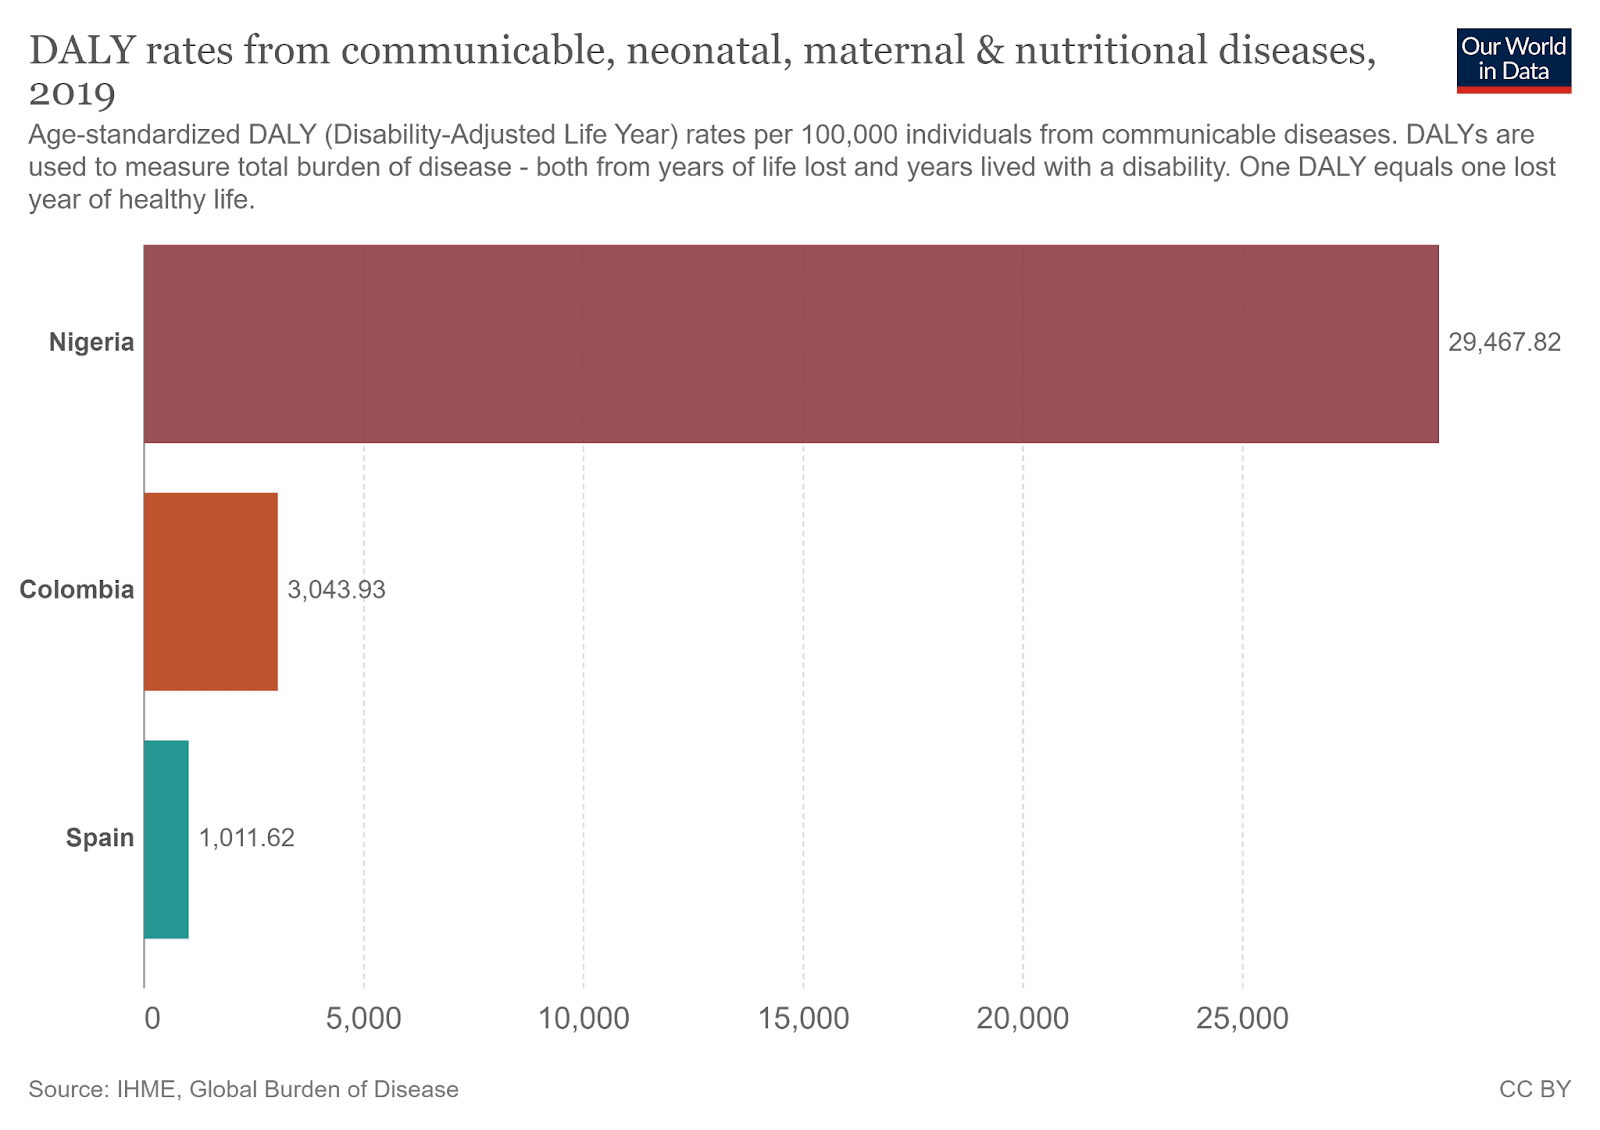
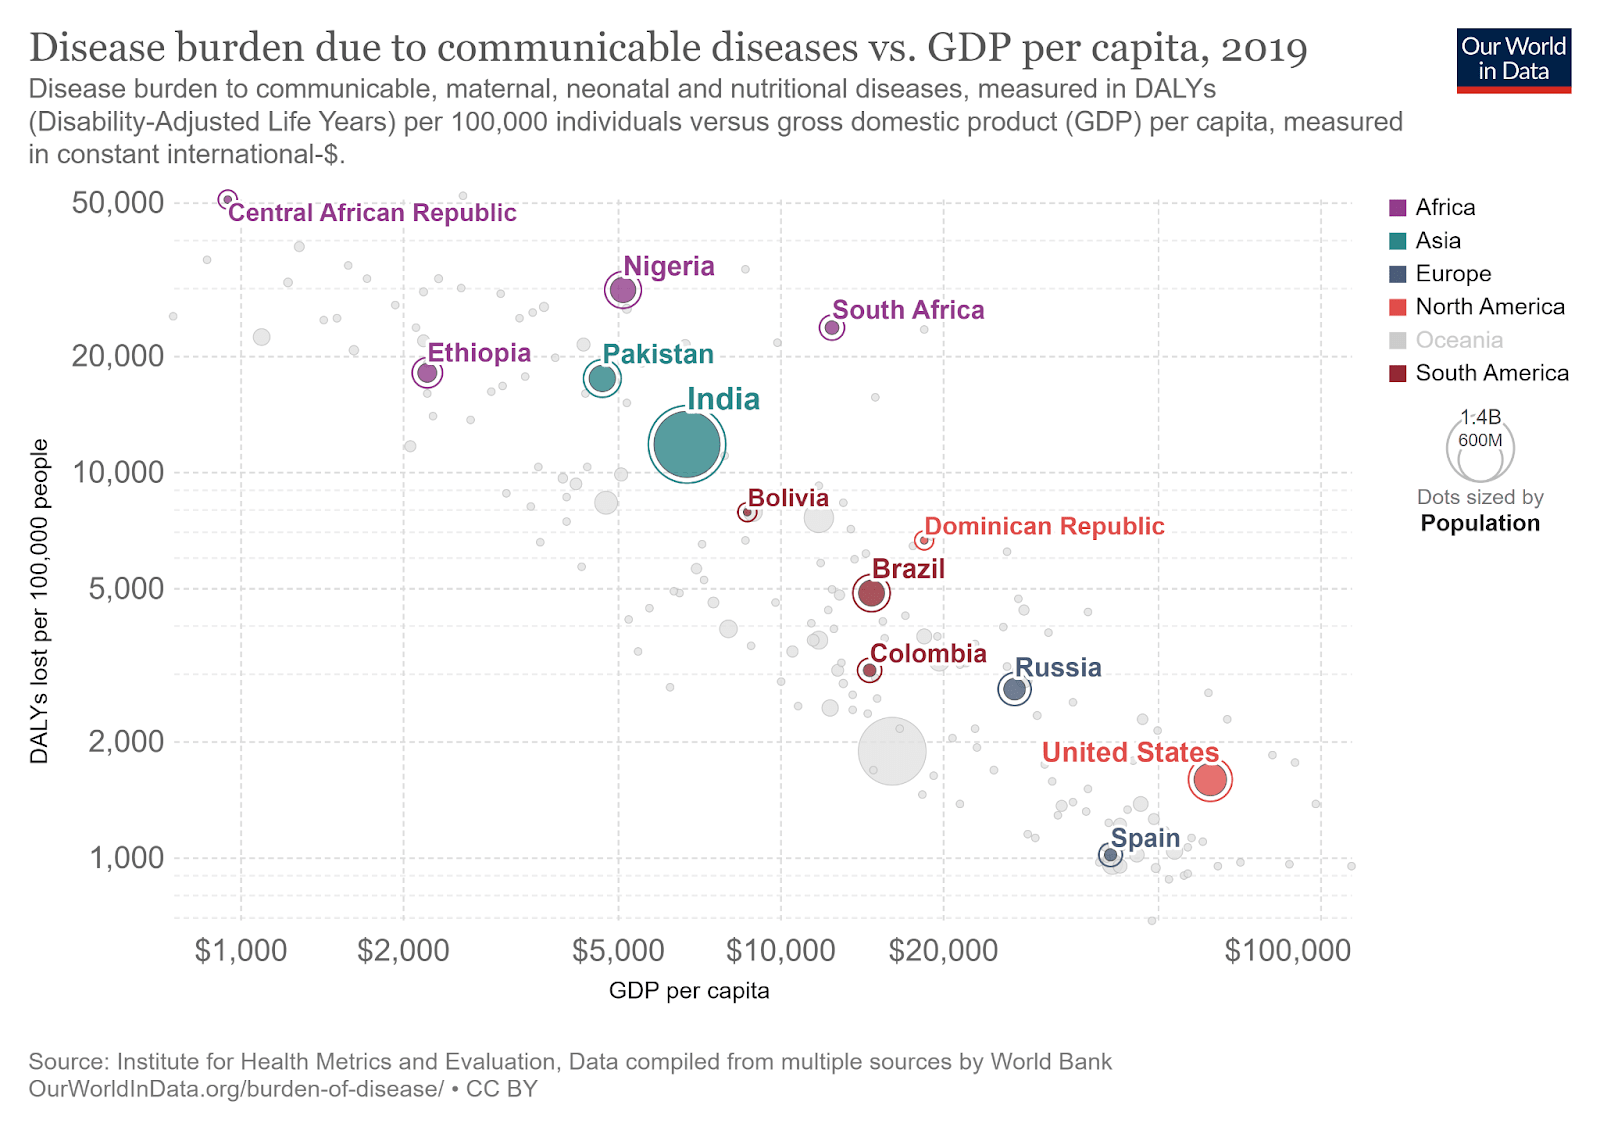
Components lost per 100,000 population for Nigeria, Colombia, and Spain (top) and DALYs lost per 100,000 population compared to median income for various countries (bottom). Source: Our World in Data.
Even if the differences are staggering at the country level, perhaps we could hope for greater parity by focusing on the poorest regions of each country. Although it’s difficult to find data on health outcomes disaggregated at the regional level, I found figures for mortality of children under 5 years by department/state. This seemed like a reasonable approximation to me as 45% of the health burden by CMNN diseases in Colombia and 75% of the burden in Nigeria falls on children under five years.
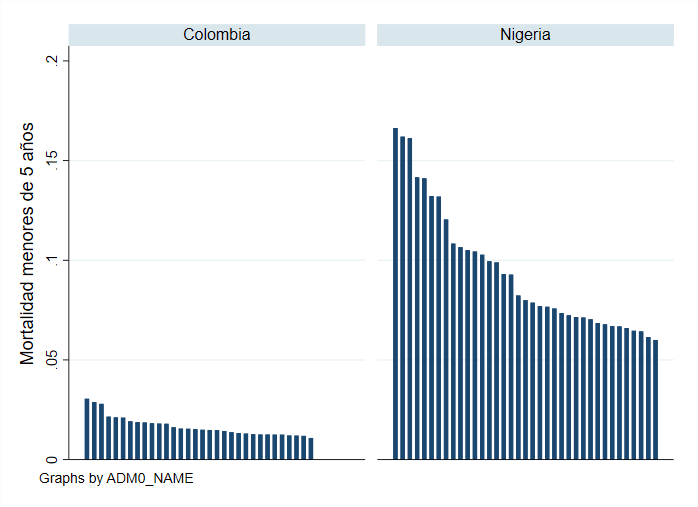
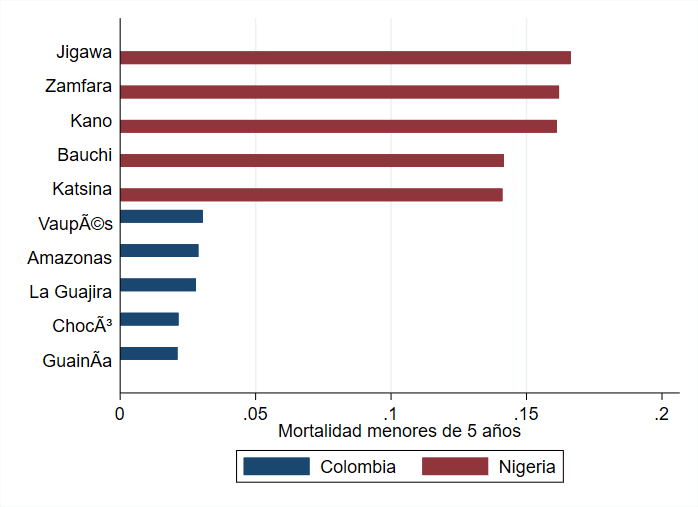
Percentage of children born alive who die before the age of 5 for all departments/states in Colombia and Nigeria (above) and the same figure for the 5 regions with the highest under-5 mortality in each country (below). Own elaboration from IHME data.
In Jigawa, the state with the highest infant mortality in Nigeria, around 1 in 6 children (15%) born alive die before the age of 5. For the department with the highest infant mortality in Colombia (Vaupés) the same figure is 1 in 30 (3%). The picture is similar across all regions, with Nigerian states having consistently higher infant mortality rates than Colombian departments.
Neglectedness (per person)
Headline result: According to my estimation, Colombia spends roughly the same amount per inhabitant on combating CMNN diseases than Nigeria. Because health spending in Nigeria falls mostly on patients, I estimate that within the poorest regions in each country Colombians spend twice as much on average to fight CMNN diseases, but I’m less certain about that estimate than the previous ones.
A problem is more neglected the less resources are spent in trying to solve it. Although such resources can take many forms (e.g. labor, technology, etc.), we often use monetary spending as a proxy for the total resources spent on the problem. Thanks to the Institute for Health Metrics and Evaluation, we have data on total health spending by country from all sources: governments, international donations, private insurance, and out-of-pocket spending by patients.
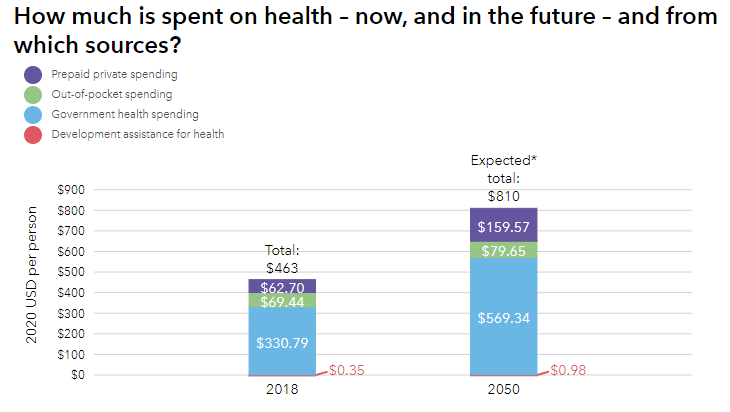
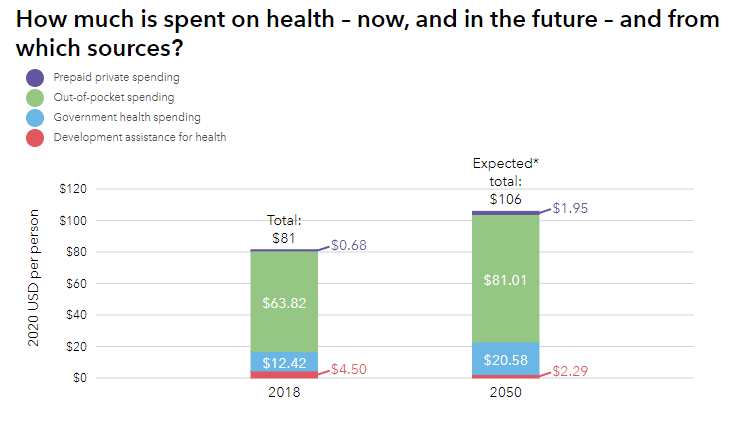
Health spending for Colombia (top) and Nigeria (bottom) in 2018 and projected for 2050.Source: Global Burden of Disease 2020 Health Financing Collaborator Network.
Health spending per patient in Colombia for 2018 was about 6 times higher than in Nigeria. The largest contribution to this gap is government spending, which is 25 times higher in Colombia than in Nigeria ($330 vs. $12) for 2018. The contribution of patients treated is of similar magnitude in both countries ($65), while international contributions are 12 times higher in Nigeria, but represent only a small fraction of spending in both countries ($4.5 and $0.35)[1].
However, for our estimation we care only about the fraction of total expenditure devoted to fighting CMNN diseases. According to WHO’s Global Health Expenditure Database, 75% of the spending in healthcare in Nigeria is directed to that purpose. And, although I couldn’t find the same figure for Colombia, we can approximate it by taking the average expenditure from 4 other countries in the database with similar GDP per cápita and CMNN disease burden to Colombia:
Share of health expenditure devoted to CMNN diseases for countries with similar GDP per cápita and disease burden to Colombia. Source: WHO’s Global Health Expenditure Database and Our World in Data
Country | Share of health expenditure to CMNN diseases | GDP per cápita ($ US PPP) | Burden of CMNN diseases per 100.000 habitants |
|---|---|---|---|
Colombia | - | $ 13.449 | 3.044 |
Tunisia | 15,3% | $ 11.385 | 2.555 |
Armenia | 11,6% | $ 12.715 | 2.704 |
Sri Lanka | 30,2% | $ 12.860 | 2.889 |
Georgia | 11,0% | $ 14.253 | 3.016 |
Average (Excluding Colombia) | 17,0% | $ 12.804 | 2.791 |
Using that extrapolation, Nigeria seems to devote five times more of its healthcare expenditure to CMNN diseases, making both countries spend roughly the same on absolute terms ($79 for Colombia vs $60 for Nigeria).
Once again, we can investigate how that result varies when focusing on the most vulnerable regions. In Colombia, the State’s health spending is coordinated at the central government which makes transfers to each municipality for their health expenses proportional to their population. The amount they transfer increases with the proportion of the population that contributes to a health payroll tax, the difficulty of transportation to the region, and the age of the population (a higher transfer for both small children and the elderly).
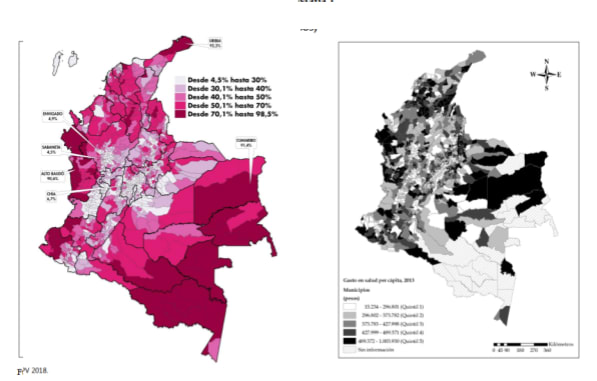
Incidence of multidimensional poverty by municipality in Colombia (left, darker is higher poverty) and health spending by municipality grouped by quintiles (right, darker is higher except for the striped pattern which corresponds to “No Information”).Orozco-Galle (2015) and DANE (2020).
Despite the fact that payroll contributions should be correlated with income levels at each municipality, which could result in richer municipalities receiving bigger transfers, Orozco-Gallo (2015) report they don’t find big disparities in health spending across the country. On average, the quintile of municipalities that spend the most on health invests 4 times more than the quintile of least health spending. In addition, those municipalities that spend less on health generally do not correspond to the poorest, with several municipalities in the two poorest departments (La Guajira and Chocó) receiving funds that place them in the top two quintiles of spending.
For Nigeria, I couldn’t find information on health expenditures by region. However, given that 79% of their health spending falls on patients, we should expect regions with a poorer population to spend less on health. For reference, in a survey of household’s expenses in Côte d’Ivoire, rural households in the bottom quintile of expenditure in consumption (a way of approximating the poorest households) reported spending around 40% less in out-of-pocket health expenditures than rural households in the third quintile of consumption.
If we’re willing to assume that the poorest regions in Nigeria spend roughly 40% less in fighting CMNN diseases than the whole country and that spending in CMNN diseases in Colombia is roughly similar to the national level, we can estimate that the poorest regions in Colombia devote about twice as much resources to fighting CMNN diseases than their Nigerian counterparts.
Tractability
Headline results: Assuming logarithmic returns (which may or may not be justified), health interventions in Colombia and Nigeria would be similarly tractable
Tractability refers to what percentage of the problem would we solve if we increased the resources we invest by a fixed percentage (e.g. increasing spending by 10% in Colombia from $460 to $506 and in Nigeria from $80 to $88).
Owen Cotton-Barrat has exposed some reasons why in cases where we don’t know much about a problem, our expectations should be that its tractability follows logarithmic returns. That is, for every 1% increase in the resources devoted to the problem we should expect a constant increase in the percentage of the problem we solve regardless of how many resources we have already invested.
For the case of health interventions we probably know some things about the cause area, which could allow us to improve upon the assumption of logarithmic returns. However, I’m not sure if I can come up with tractability considerations that apply to all or most approaches for combating CMNN diseases within a country, so I’ll just default to assuming logarithmic implies. This assumption would imply that the scale and neglectedness of the problem would be independent of its tractability, leading to the conclusion that health interventions in both countries are similarly tractable.
Conclusions
Estimated ratio of the cost-effectiveness of interventions for combating CMNN diseases in Nigeria with respect to Colombia broken down in the three SNT factors.
Scope | Scale (per person) | Neglectedness (per person) | Tractability | Cost-effectiveness ratio |
|---|---|---|---|---|
Whole country | 10x | 1x | 1x | 10x |
Most vulnerable regions | 5x | 2x | 1x | 10x |
Multiplying the 3 factors, my application of the SNT framework estimates that interventions that combat CMNN diseases in Nigeria are 10 times more cost-effective than in Colombia, a conclusion which doesn’t change if we compare only the most vulnerable regions within each country. Most of the cost-effectiveness gap comes from the higher burden of CMNN diseases in Nigeria.
The way I think about this result is similar to the way I conceive of differences in average income (GDP) across countries. We usually can’t convert differences in income directly into differences in quality of life, but when you compare countries across very different income levels, most often the highest income one has a better quality of life. That’s partly because income directly improves the standards of living, but also because income tends to correlate with other development indicators, such that countries that differ substantially in their income levels will also differ substantially on other dimensions of what makes lives go better.
Similarly, scale and neglectedness do not necessarily translate directly into more effectiveness, but if we see a large enough difference in those dimensions, that suggests there could be substantial differences on how cost-effective interventions across the two sides of the comparison. I don’t think that a 10x difference is sufficiently big to be confident that the best interventions in Nigeria are overwhelmingly more cost-effective than the best interventions in Colombia. But if I had to compare two concrete health interventions addressing CMNN diseases, one from Colombia and one from Nigeria, and I didn’t have the chance of looking into the specifics of any of them, I’d usually bet that the Nigerian intervention would be a couple times more cost-effective.
As a last thing, I want to suggest a few lenses or use cases for the estimate I’ve found. I wouldn’t stand too strongly behind any of them, but I hope they’re at least useful to start the conversation.
A suggestion of finer gradations of poverty: Before starting this project I lent more credence to an argument like “Nigeria may be much poorer than Colombia as a whole, but there are also very poor regions in Colombia, so we should be able to find similarly cost-effective opportunities there to the best we’ve found in Nigeria”. Now that I’ve collected some data on living conditions in the two countries, that argument seems much less appealing.
It turns out that the poorest regions in Colombia still have a much lower incidence of extreme poverty[2] and disease than the poorest regions in Nigeria. I’m not sure if that’s caused by lower state capacity, worse climatic conditions, or anything else, but the difference is wide enough that it feels somewhat wrong to me to talk about poverty like it means the same in the two contexts.
I also expect this difference to hold even for conditions other than health. Measures like health, education and income tend to together and also often track other dimensions of quality of life and development (a point often made by economist Amartya Sen). If a region seems worse on those measures my impression is that it will probably have many more problems than it might seem at first glance.
A multiplier to pile upon other career considerations: Suppose you’re trying to decide between two concrete career options. Let’s say you’re choosing between doing a Masters in Public Health in Colombia or abroad. Suppose also that by staying in Colombia you could attend a university that frequently places its graduates in influential positions in the national government. You expect that studying there would allow you to gain influential contacts and earn a reputation within the country. On the contrary, suppose your best option for studying abroad is at a more internationally renowned university, but it has less direct contacts with local governments. However, going there would give you more flexibility in choosing the country and organization that you work on[3].
If you believe that effectiveness is a conjunction of multipliers, you could approach such decision by estimating different factors that independently contribute to your ultimate impact and multiplying them together:
Consideration | Multiplier for Colombia | Multiplier for abroad |
|---|---|---|
Local network and credentials leading to a greater influence and leverage within the Colombian government | 8x | 1x |
Ability to choose the most effective organizations | 1x | 3x |
Ability to target your efforts at the most vulnerable populations in the world (taken from this document) | 1x | 10x |
Simplified aggregate | 1x | 3.75x |
Overall, your estimation suggests studying abroad would lead you to have approximately 4 times more impact. You know that there are some factors that you didn’t include, but in this case you think they’re unlikely to change the direction of the overall result. This is a made-up situation, but I can imagine many cases in which it could be useful to have a rough intuition of the tradeoff between helping a particular country and focusing on the most vulnerable people.
For some of those scenarios you may want to use the estimate in this document as a starting point, while for many others it could be more informative to estimate directly what you care about. For example, if your expertise is most relevant to working on a specific health cause, say deworming, I think you’d do better by trying to estimate the difference in cost-effectiveness in that area if you can find the relevant data to do it. The information you get by doing that will probably be much more relevant to your decision and could override the conclusions from this more general analysis. [4]
A template for comparing health interventions in other countries: I focused on comparing health interventions between Colombia and Nigeria out of a partial consideration for helping students in Colombia and because it would be easier than including more countries. However, most of the datasets I used are available for many more countries, so it should be easy to replicate the analysis I did for a couple other countries of your choosing spending at most a couple hours.
I haven’t organized the data I used such that it would be intelligible to any other human, but I could easily do so if someone expresses interest in that in the comments.
Thanks to everyone who heard me expose these ideas even when they were less than half-baked. I appreciated their patience and their comments. I’m especially grateful to Luis Mota, Ángela Aristizábal and Jaime Fernández for reviewing previous drafts of this document and for their comments and support.
- ^
My impression is that the pattern we see in international aid is replicated in areas other than health. Although the poorest countries receive proportionally more international aid than richer countries like Colombia,those amounts are negligible compared to the spending of the government and the citizens of the richest countries. This makes the total or relative magnitude of international assistance that a country receives an erroneous measure of how many resources are invested to solve the problem.
- ^
According to a linear extrapolation I did from the poverty in Colombia at the two national poverty lines, around 30-40% of people in the poorest departments in Colombia live under the international extreme poverty line. In the poorest states in Nigeria around 80% of people live under that same poverty line.
- ^
This is an imaginary situation. I don’t know if these are important considerations for this particular career decision.
- ^
Also, this is me brazenly inserting my opinion here, but I’d like for some of the students at my university to honestly ask themselves: “For the concrete career paths I’m considering, do the considerations that suggest I’d have a bigger impact on my home country add up to more than a 10x multiplier?” If not, perhaps they could have a greater impact by working on causes abroad. That wouldn’t mean they’d have to focus abroad, there are many considerations beyond impact for choosing a career, but it’s good to have clarity on why you’re doing what you’re doing.
NickLaing @ 2023-03-25T05:56 (+6)
Great article really nice job!
I really like your table at the end, and I'd like to challenge a few of your estimates there. I think we ignore and underrate "hometown advantage" (to steal a sports phase). This is just my limited experience and weak intuition talking - it's very hard to put numbers on comparative advantage.
Part of the reason I think we ignore hometown advantage that most EAs interested in global development live in such rich countries, that the multiplier for "targeting the most vulnerable" as you put it might be so high, perhaps 50-100x for work outside their countr rather than 10x as in your case which makes hometown comparative advantages largely irrelevant.
I love the way you put "8x multiplier" for Local network and credentials leading to a greater influence and leverage within the Colombian government. I agree with this strongly.
To that I would potentially add other multipliers for working in Columbia
- Ability to leverage language and deep cultural understanding to be more effective x 2
- Don't waste time understanding the local landscape (health system/ economy/politcal system) x 1.5
- Use local knowledge and networks to identify the most tractable/neglected issues x 1.5
- Happiness/contentment of being closer to home increasing productivity x 1.5
You might also consider poorer countries around you (e.g. Bolivia) where you would retain some of these competitive advantages, while also being able to target more vulnerable populations.
A couple of other comments too
I think doing a masters or something abroad, then coming back and working in Columbia might be a good option. I don't see the connection between studying abroad and working in another country
Also I don't really understand your "Ability to choose the most effective organisations" multiplier in your chart. Why would this increase outside of Columbia? Also you could start your own ;).