General capability - and capabilities generally - have no good y-axis
By Gregory Lewis🔸 @ 2026-08-04T14:11 (+156)
BLUF:
- To determine whether AI is ‘improving exponentially’, ‘hitting the wall’, or any other claim which involves a quantity or magnitude (e.g. ‘This model was a big leap/small increment’). We need a good y-axis: an interval scale of AI capability which means +1 unit always represents the same degree of ‘how much better’, in the same way +1 degree Celsius is always the same amount of ‘how much hotter’.
- Yet there is no good y-axis for AI capability. All our measures are of something related-to but clearly not identical-with it, thus ‘true’ AI capability can be a funhouse-mirror reflection of whatever was measured. Specifically:
- Benchmark score: One small step in benchmark score can be a giant leap in capability, or the opposite, or whatever else. (My 6/10 vs. your 4/10 ≠ I’m 50% better at maths than you).
- Elo et al: Can give a real y-axis in terms of winning chances, but doesn’t translate outside of beating others. (Going from 50% to 73% to 88% chance to get a higher score than you on a maths test ≠ gaining 0 → 1 → 2 units of maths ability over you)
- Epoch Capabilities Index: Analogous to IQ, so the y-axis intervals are dictated by modelling assumptions (IQ 115 → 130 not really the same increment of smarter as IQ 85 → 100). In any case, latent trait(propensity to get high scores across benchmarks) still a funhouse mirror of Capability(generally). Benchmarks are substantially endogenous to the models, so (e.g.) the 2024 acceleration observed in both ECI and TH may be explained by common measurement artefact rather than mutual corroboration.
- Log-loss/prediction: Analogous to reaction time, so in the same way reaction time/digit span/vocab size is non-linear in human intelligence, prediction accuracy non-linear in AI.
- METR Time Horizon: Measured time horizon ~ 10^(k * total score on METR task suite), likely explained by human task-completion psychometrics. If TH is linear in AI capability, then Opus 4.5 → 4.6 is a bigger advance than dawn-of-time → Opus 4.5.
- Perhaps talk of ‘AI capability’ is better deflated, or maybe we await the theory which could do to intelligence what thermodynamics managed for temperature. Either way, our current measurements of AI are numerical gestures toward, not readings of, whatever is really going on.
Introduction
Consider these two graphs:
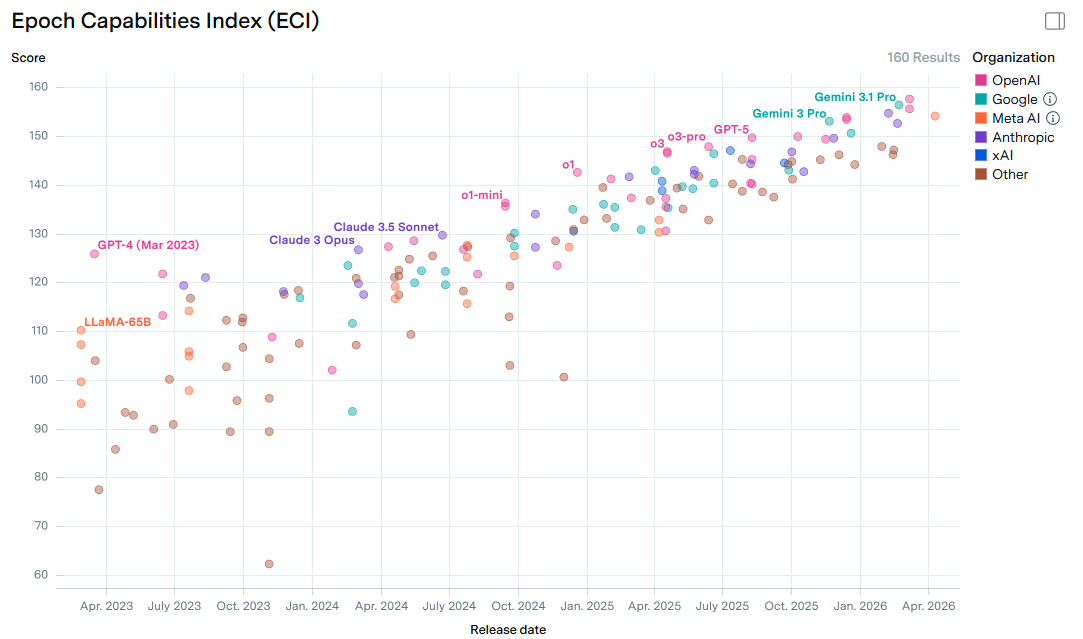
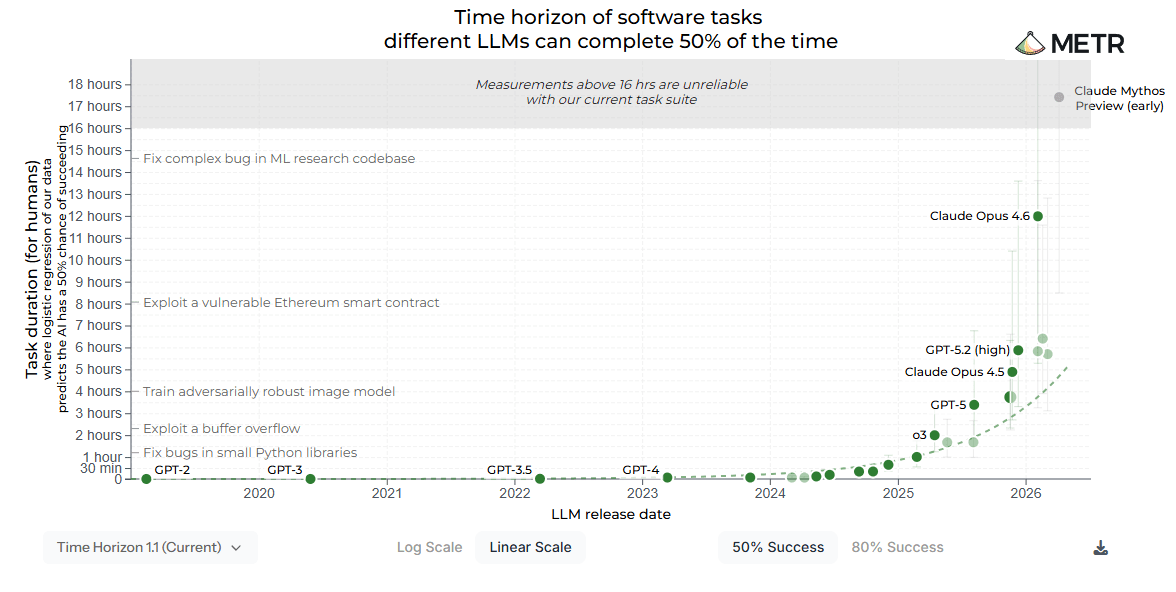
These graphs paint very different pictures of AI progress: the shallow straight line of the ECI plot suggests steady incremental improvement; the (supra?)exponential sweep upwards for time horizons suggests screaming towards the singularity. Both are used (perhaps more than the researchers behind them would like) as summaries of AI in general. Yet which picture is, for want of a better term, right? Is the true (functional) form of AI capabilities best captured by linear-ish ECI or exponentially-increasing time horizons - or maybe something else?
I provide a counsel of despair. These two graphs are essentially the same picture with a transformed y-axis, and neither really measures AI capability. For what the right y-axis is, and the right transform of our measurements to get it, I only have varieties of scare-quotes and question-marks to offer.
Both a poor reflection and a dark glass
We would want our y-axis for AI capability to be an interval scale, and ideally a ratio one (see). Consistent intervals (e.g. seconds, GPS coordinates) give meaningful magnitudes, thus meaningful rates of change, curvature, etc. A true zero is needed for useful talk involving multiplication and division (e.g. exponential progress, ‘10x better’): degrees celsius works fine for temperature intervals, but not ratios: 1C → 2C is the same amount of hotter as 2C → 3C, but 2C not ‘twice as hot’ as 1C. The Kelvin scale, with its absolute zero, makes this meaningful again.
Benchmark scores are already ratio scales in themselves: 20% is double 10%, and 10% → 11% → 13% → 20% is acceleration. But we seldom care about benchmark score, but whatever was being scored (e.g. “Software engineering” vs. SWEBench), and now all our problems begin.
One common issue is floor and ceiling effects: scoring zero on a benchmark seldom implies complete incapability (so doubling benchmark score ≠ ‘The model got twice as capable’); nor 100% imply total mastery (whatever that could mean) either - so score progress slowing because scores cannot exceed 100% on near-saturated benchmarks does not prove AI progress is hitting the wall.
The deeper problem is the translation from benchmark score and ‘true capability’ (or - perhaps better - ‘what we care about’) could be almost anything. Even if we had a benchmark which spans zero to god, in between could still be a funhouse-mirror transformation of the ‘true’ scale (q.v. Vaintrob). Perhaps for some things (e.g. ‘correct control inputs for an autopilot’) the story is a long march through the nines - clearing the last (sub-) subpercentile is what really counts, and anything less is equally useless; perhaps for others (e.g. ‘make scientific breakthroughs’) any% success is transformative, and improving the hit rate mere icing on the cake. In general: for any point on any benchmark, one small step in score could mean a giant leap for capability, or the opposite, or anything between.
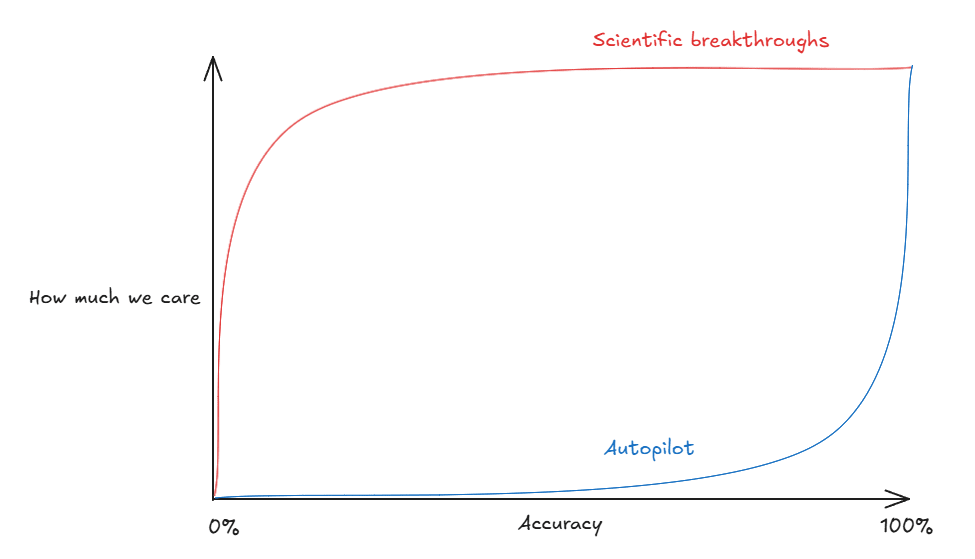
The benchmark → real capability mapping should remain ~monotonic, so ordering roughly works: model A scoring higher than model B on whateverbench argues (if not proves) that model A is truly better at the underlying whatever. But if benchmark data is only really ordinal - it can say a model is better, but not how much or how many times better - it cannot answer many AI questions we are interested in. “How fast is AI progressing?” “Are AI capabilities accelerating or hitting the wall?” “What are the returns to scale?” (etc.) require a y-axis which is linear in capability, not some unknown non-linear-but-broadly-order-preserving transformation of the same.
Human benchmarking also has a y-axis problem
We have been trying to measure capabilities in humans for a while, and reviewing their bitter lessons may make the problems regarding AI unsurprising. They may also be instructive: if our interpretation of benchmarks would return nonsense if they were analogously applied to humans, it probably is not doing much better when applied to AI.
The general problem is you need to make two hops: first from measurement to what was being measured, and second translating from measurand to ‘true’ quantity.
Measurement → Measurand → What you actually care about
These links don’t need to be tight for ordinal claims to translate across: if I score more than you on our maths test, I am probably better at maths than you. The degree of ‘probably’ is modulated by how reliable the math test is (hop 1), and its construct validity (hop 2), but “all else equal likely better” survives so long as the correlations > 0.
But for interval/ratio claims to translate across, these links need to be extremely tight: all-but-lawlike relationships between measurement and what was being measured, and what you’re measuring being all-but-identical with, rather than a rough proxy of, what you care about. It is facially absurd to say I am 50% better at maths than you because I got 6/10 and you 4/10 on our maths test (ratio), or that you → me is twice the degree of ‘better at maths’ than ‘Alice (3/10) → you’ (interval).
Sometimes we get lucky, and the links are tight enough to allow intervals in the measurement to be translated to intervals in capability simpliciter. If I run 100m in 20 seconds, I am - modulo quibbles[1] - about half as fast as a professional sprinter. Ditto, although with more substantial quibbles, upping my deadlift from 50 → 60 → 70kg means my strength has increased by equal increments.
Typically, though, the quibbles are the question. Although Zidane > average professional > average kid on the playground, there’s not a natural ‘footballer capability scale’ we can apply to size these gaps.[2] For some attributes of being good at football - running speed, height, (perhaps) work rate and strength - we have a crisp ratio scale to measure them. But the second hop jumps off the cliff - these are loose correlates: all else equal running faster makes you better at football, but footballing ability is not linear in running speed. For many others - agility, vision, ball control, etc. - even the first hop doesn’t work: we can construct an agility benchmark or a ball skills test, but the scores have no guarantee to be linear in the ‘real’ trait. And overall footballer ability is some messy context-dependent[3] composite of all these things anyway.
Another common problem is ‘what we care about’ can be fuzzy and multifactorial, so different measurements can be more or less valid depending on how the gestalt is litigated. In terms of abilities we can crisply measure, all-time greats do better than typical professional footballers, but only noisily, and by a little: Zidane does not run 10x faster, kick the ball 10x harder, etc. Yet in terms of outcomes - lifetime earnings, n(championships), etc. - you do see orders of magnitude (or divide-by-zero) differences between the best and the rest.
Perhaps the story for the extremization from raw elements to finished achievements is that football is a tournament game: the winners get almost all the spoils, even if they are ‘really’ only marginally better than the losers. Or perhaps some mix of ‘emerging properties’ or ‘compounding effects’ turn apparently small differences in elements to huge gaps in overall ability: Zidane would really be a “100x” footballer if only we could measure footballing properly. Or perhaps there is a jagged staircase of capability, which stratifies those either side of the ledges into qualitatively different levels of performance.
Such problems are common in any field softer than biochemistry: there’s no good y-axis for musicianship, social worker performance, a happy marriage (or happy childhood), democracy, and most of the rest. Our concept of these is some blob with an appreciable sense of more or less, and we can pull out (or construct) measures which align with this sense. Yet the projection of the blob onto our constructed axis is very lossy: these measures can preserve rough order, but have no hope to capture exact size.
A metrological elegy
Nonetheless we have striven to produce a y-axis for AI capabilities. Besides ‘raw’ benchmark scores, we have Elo, Capability indexes, ‘pure’ log-loss/accuracy, and time horizons. Most have analogies to measurements of human ability, and fall short in analogous ways.
The base case: benchmarks (cf. exams)
Benchmark scores have all the problems mentioned already: absolute levels of benchmarked-capability cannot be read off from the benchmark score, the ‘next’ x% could be much easier/harder (or un/important) compared to previous y%, and the rest.
The same applies to human benchmarks - exams. Although exam scores are clearly on a ratio scale (6/10 is 50% more than 4/10), our applications of these numbers collapse them to ordinal data: pass-or-fail thresholds, ranking/percentile in a cohort, and so on.
Elo et al.
For games, we can often measure performance with something like an Elo score: we compare your score to mine to work out the probability that you win and - in reverse - we use the result to update our scores, and so how likely we are to win future games we play.[4]
Underappreciated (at least by me until educated by Toby Ord), is that these measurements can be a true ratio scale of winning odds. Elo is a transformation from the Bradley-Terry model, and although Elo has no true zero or multiple (Magnus Carlsen has double my Elo ≠ I’m half the chess player he is), Bradley-Terry strengths have both: 0 is an absolute zero of player strength - you always lose versus anyone else; doubling my strength means double my odds of winning, no matter who I am up against.[5]
These models do not require games where we play against someone else - any comparison between us could do: user preferences (e.g. ArenaAI - but see), who tends to get higher scores across challenges (e.g. Codeforces) can all work. We can thus ‘Elo-ify’ any benchmark: each in/correct answer is a loss/win of the model against the benchmark, so a model scoring 50% has twice the ‘winning odds’ (so double the Bradley-Terry strength) of a model scoring 33% (1:1 vs 1:2). Given we can count the correct answers, can we use this trick to get a ratio scale of capability after all?
To a first approximation, this is indeed what Item Response Theory does - the maths of Elo and IRT models are similar-to-identical (more later). The reason this does not work (much more later) is it merely relocates the issue to construct validity: even if ‘strengths at doing maths questions’ can be set on a real scale, strength(answering maths questions) is not really strength(“maths”), but some funhouse-mirror transformation of the same.
Elo-esque measures work well for competitions and games because - much like 100m times vs. ‘how fast are you?’ - the construct validity problem evaporates. How good you are at playing a game is essentially one-and-the-same with how likely you are to win the games you play. Although chess players vary in their abilities of tactical calculation, positional intuition, opening knowledge (etc.), the bottom line is who beats who.
But the world, by and large, is PvE. If model A beats model B at Codeforces (or some broadly representative ‘coding benchmark’) 99.9% of the time (~1000:1 odds), it does not follow that it is really ‘1000x better’ at coding simpliciter. Similarly, my 6/10 vs. your 4/10 on our maths homework - even if it was somehow representative of math questions generally - would not demonstrate the ratio of our abilities at maths is (3:2 / 2:3) 9:4.
(And maybe not quite ‘game ability ≡ winning games’, after all?)
Even for games, identifying ability with winning odds can creak at the joints. Like benchmarks, games can have floor (many games break if playing to lose, so the absolute zero of the Bradley-Terry scale - always losing to everyone no matter what - cannot be reached) and ceiling (perfect play) effects. Also like benchmarks, games can vary in their discrimination:[6] the stronger player wins tennis matches more reliably than the stronger team wins football matches; luck intercedes more for poker and backgammon than it does for chess.
Most importantly, our gestalt of being ‘good at [game]’ doesn’t entirely boil down to win probability. Take chess. The best chess engines now will never lose to any human player, even if they played thousands/millions/inf times, yet we might be reluctant to say they are thousands/millions/infinity times better at chess: loosely, the computers win less because they keep finding ‘superhuman’ moves, but more because losing a game of high-level chess requires someone to make a clear mistake, and computers (unlike humans) never do. Avoiding errors is a key part of being good at chess, but - perhaps - it shouldn’t count for essentially everything, even if it can result in total dominance in terms of winning record (cf. AlphaStar and APM).
The absence of substantial errors also puts computer chess deep in the draw death regime: tournaments use an array of unbalanced positions where one side has a moderate dis/advantage to tease out which chess engines are better or worse at holding/converting the position. Yet the competing engines would never have conceded or secured this dis/advantage had they played from the starting position, where instead the ‘worse’ engine would have endlessly drawn against the ‘better’ one. So: are these unbalanced book tournaments capturing a further aspect of being ‘good at chess’ beyond winning (standard) games, or are computers in these tournaments not really playing chess anymore?
ECI (cf. IQ)
It turns out the blob we have in mind with ‘human intelligence’ can be projected not-too-badly onto a single axis (g): diverse tests of cognitive ability (from reaction time to general knowledge) all positively correlate with each other. The resulting number (IQ) is a not-too-bad predictor of the things we think smarter people should fare better at: academic achievement, job performance, lower rates of accidental death, etc.
It also turns out that AI models and their benchmarks behave much the same way. Performance across benchmarks show a similar manifold of positive correlations, where models tend to do better or worse across the board. Thus we can summarize ‘benchmark performance’ into a single IQ-esque number. Enter Epoch, and their capabilities index.
ECI and IQ share similar limitations. Neither is a ratio scale: IQ is (essentially) a Z score, thus the location (mean = 100), and spread (standard deviation = 15) are stipulated as a matter of convention. An IQ of 150 ≠ 50% smarter than average, no more than (if we set mean to 0 and standard deviation to 1) an IQ* of 3 would be “infinitely” smarter than average (and negative times smarter than below average). So too ECI: it initially scored GPT-5 as 2.7, whilst now it scores GPT-5 150, the difference owed to a change in how Epoch set the scale.[7]
Arbitrary zeros and arbitrary units still allow an interval scale. Even without an absolute zero, intervals between temperatures remain if you switch scales: 20C → 30C is half the increase as 100C → 120C, regardless of whether these are converted to Fahrenheit, Kelvin, Rankine, or whatever else. Similarly, the gap between IQ 100 → 130 is still twice that of 145 → 160, no matter our numerical convention - rescaling IQ to mean = 0, SD = 1 gives IQ* 0 → 2 double IQ* 3 → 4.[8]
Intervals Rarely True
Unfortunately, these intervals for IQ or ECI aren’t real either, but derivative from their modelling assumptions. Classical IQ tests give total scores, which (like exams) are collapsed into an ordinal ranking, and these ranks/percentiles are normalized to the bell curve to give Z-scores, and then the Z-scores are rescaled arbitrarily to get the final number. The question of whether IQ 85 → 100 is really the same interval of smarter as IQ 130 → 145 is literally true by stipulation, and in reality somewhat malformed.[9]
The ECI (and modern IQ tests) do something cleverer with Item response theory (IRT), but this shares the same fundamental problem. Epoch translates benchmark scores into capability numbers with the following equation:
score(m, b) = σ(αb(Cm − Db))
The score of a model (m) on a benchmark (b), depends on the difference between that model’s capability (Cm) and that benchmark’s difficulty (Db). The link function (σ) is what converts benchmark scores into this capability-difficulty difference. Epoch - following convention - uses the standard logistic curve: the y axis is normalized score (1 = 100%),[10] and the x axis Cm − Db in arbitrary units:
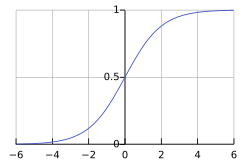
This curve translates different scores on a benchmark to differences in capability between models: if Model A scores 88% (2 arbitrary units ‘above’ the benchmark), and Model B 27% (1 arbitrary unit ‘below’), Model A is 3 units stronger than Model B. With lots of models taking lots of benchmarks (and with reasonable overlap amongst them), you can - much like Elo - run the maths in reverse: from the cloud of benchmark scores, find the best-fitting values for average difficulty and discrimination of each benchmark (Db, αb), and - the objective - the capability of each model (Cm).[11]
But it is the link function doing all the work setting the intervals in capability: 27 → 88% = 3 units, vs. 27% → 50% = 1 unit, etc. In essence, the link function is doing the same thing the normal distribution does for IQ: the raw numbers are fed in, and the interval structure in the underlying trait is dictated from it by fiat.
So what? One issue is this interval structure is sensitive to which link function is assumed. Logistic is the conventional default, but other link functions can fit benchmark data just as well.[12] If you picked one with narrower tails, the models would be more uniformly distributed; if you made the link function asymmetric, you would add skew, etc.
This issue is relatively minor: although link function choice can alter fine structure (e.g. interval of Gemini 3 → 3.1 vs. o3 → o3 pro), the broad sweep of the figures would remain much the same. A simple demonstration is to strip out the interval information entirely: ECI correlates ~0.97 with rank(ECI) across models, so the scatterplots show a similar picture if you switch ECI to ECI ranking.
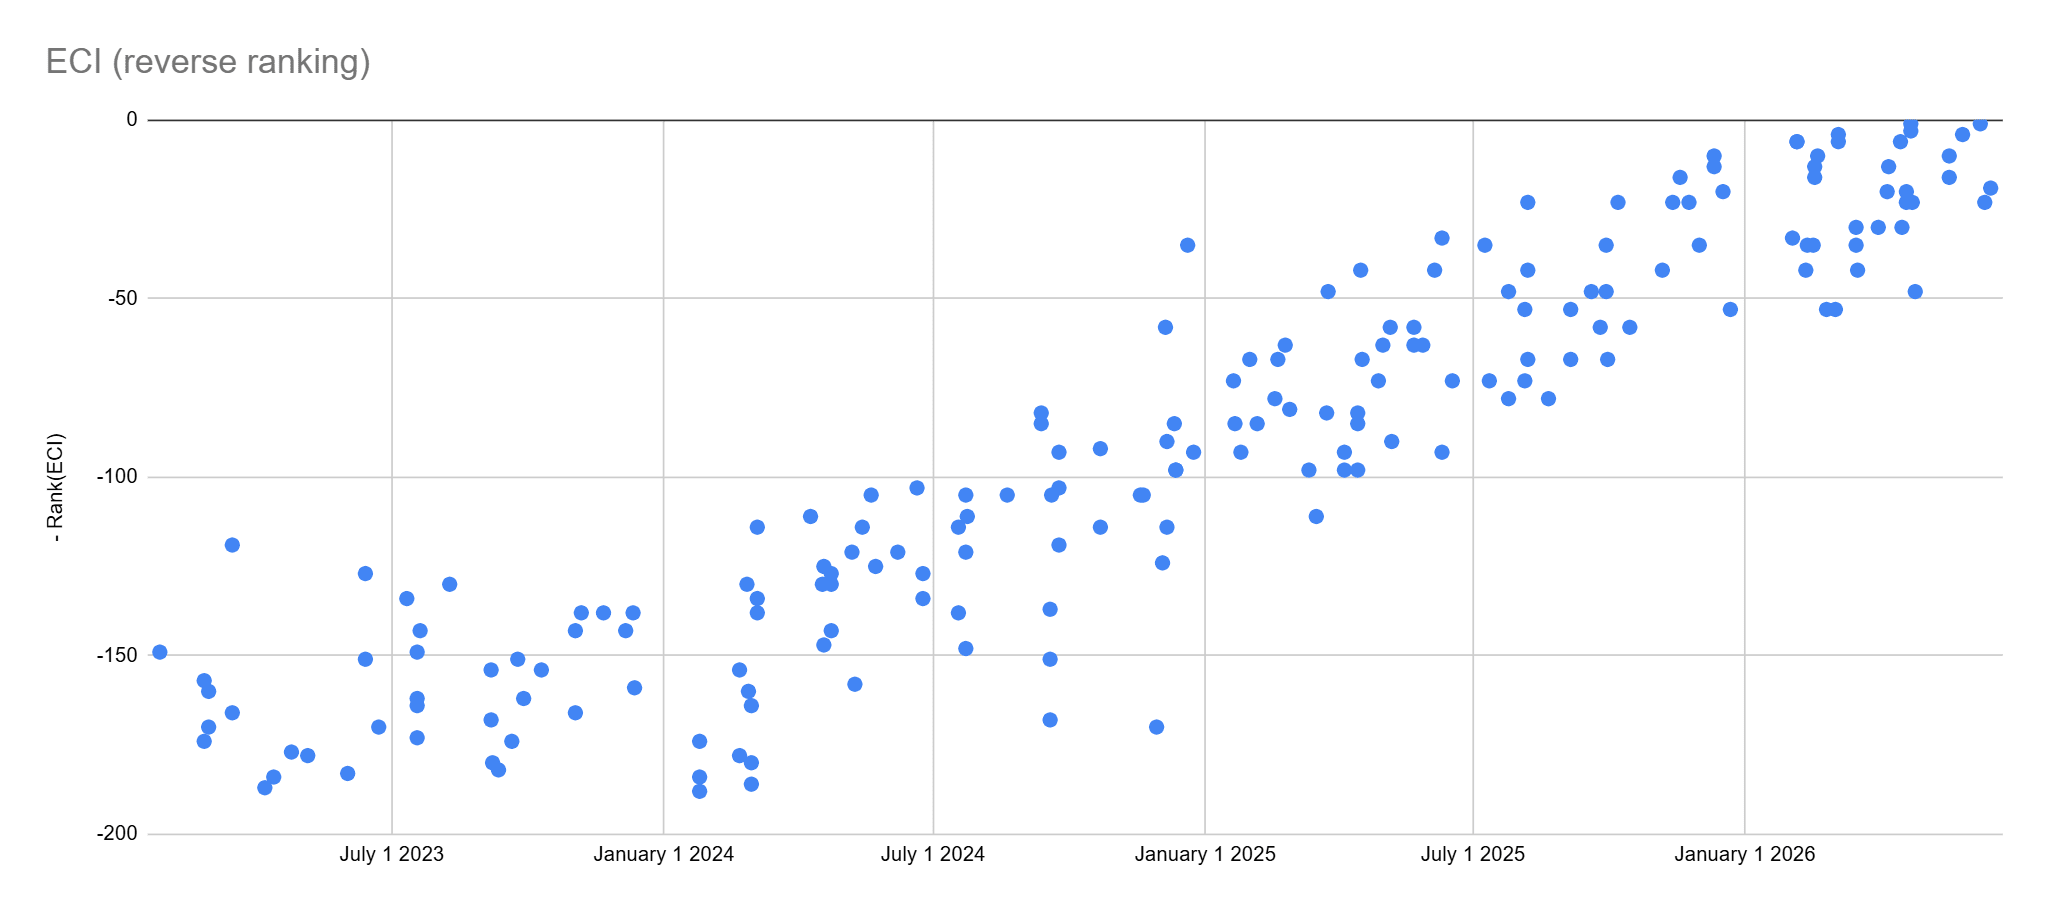
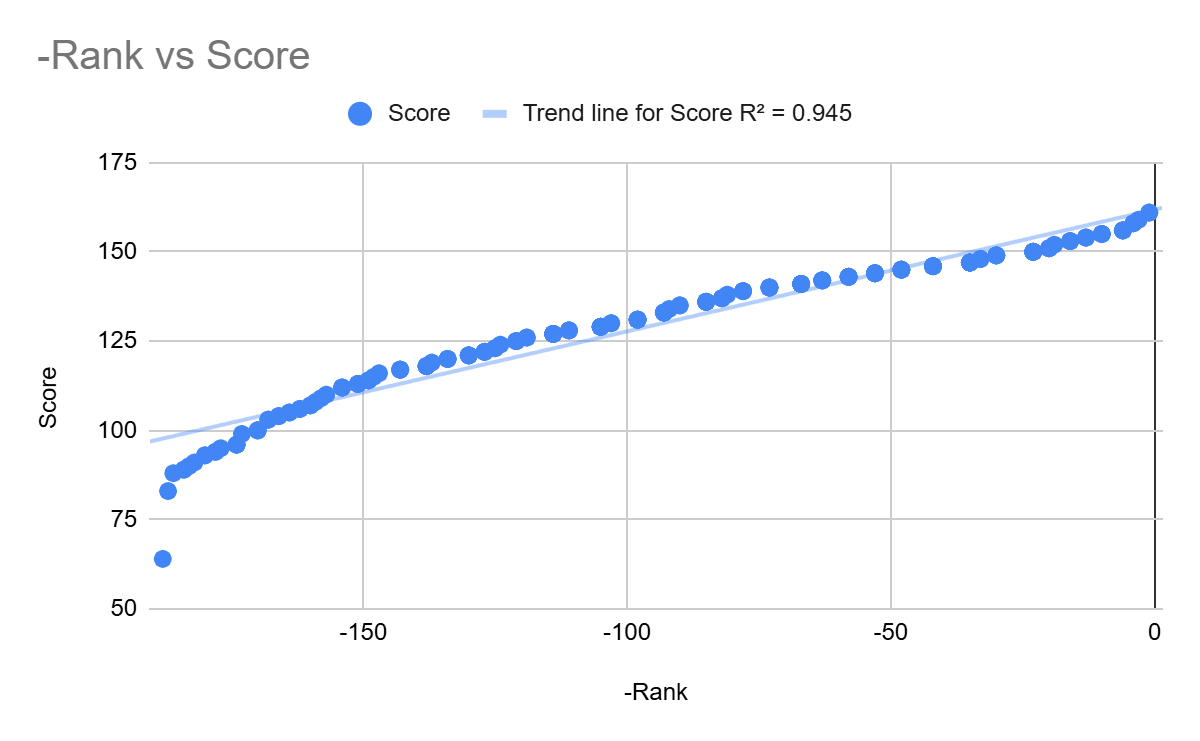
Measure endogeneity
That is hardly a devastating exposé - if ECI scores are distributed not-too-weirdly (~normal, ~uniform, whatever) values and ranks should correlate tightly. But it is a useful preamble to the big issue. The reason ECI rank would be a terrible y-axis for AI capability is ‘rank increase velocity’ is endogenous to release cadence. Suppose all the other labs give up, but Anthropic is sitting on Claude Cthulhu, the next top model. If they release it on Jan 1 2027, the ranking y-axis goes ‘up’ by 1, whilst the wall-clock advances ~6m - clearly ‘slowing down’; if they instead salami-slice 100 incremental upgrades from current SOTA to Cthulhu over the intervening period, now Cthulhu (Jan 1 2027) appears as the summit of an unprecedented burst of AI progress.
Benchmarks can vary in their average difficulty, but also in their difficulty range. The slope parameter (αb) is how IRT captures this: a benchmark which discriminates across a narrow range (so slight improvements in capability give big increases in score) have a high value, so a steep slope (squishing the logistic curve along the x-axis), and vice versa. Although the benchmark parameters are usually treated as a means to an end to get the capability scores, the modelling treats them with equal esteem - benchmark and model parameters (αb, Cm, Db) are fitted jointly to explain the cloud of benchmark results.
The analogous problem for ECI is this. Suppose AI capability is really ‘hitting the wall’, but new benchmarks are only slightly more difficult yet also discriminate more and more tightly across smaller and smaller ranges of true ability: this could ‘cancel out’ to give roughly linear progress. Or vice versa: AI is really accelerating, but benchmark-setters manage to devise higher difficulty benchmarks which span wider and wider ranges, expressing this take-off with linearly-improving scores. In general: for any observed change in ‘model capability’, how do we know it is a fact of the AI models, instead of a reflection of the opposite pattern in the benchmarks used to measure them?
Happily, the IRT mathematics can tell apart these verbally-degenerate joint trajectories of models and benchmarks. Unhappily, this resolution entirely relies on the link function: specifically, the assumption that the link function for each and every benchmark has exactly the same shape, modulo shift and stretch. For AI benchmarks, this is a dubious assumption to make in principle (22 → 37% represents the same amount of capability gain as 88% → 95%, for each and every benchmark?), and in practice they exhibit varying degrees of ‘approximately sigmoid’.
If you relax the assumption that all link functions have exactly the same shape, you end up with something like Mokken scaling. But now the resulting ‘capability’ values are only identified to - welcome back, funhouse mirror - a monotonic transformation. Unless the dubious link function assumption is made, the intervals drift off into the numerical aether.[13]
And the worry that benchmarks are substantially endogenous to the models is sound. Regardless of any gaming or hill-climbing on benchmarks by AI companies, benchmark design (and use!) is implicitly tuned to what can discriminate among current and near-future frontier AI models. ECI partly results from the coevolution between benchmark-setters and model-makers, and disruptions to this dynamic rotates the glass ECI refracts through.
Unfortunately, apparent trends (on an interval scale) or the (interval) differences in capability is a large part of what people want the ECI to deliver. The ECI FAQ concedes other things we care about could be non-linear in ECI units, but asserts ECI is linear in capability (or at least ‘impressiveness’),[14] and that changes in trend indicate (truly) faster or slower progress (e.g., also). All of this, I think, is malformed in the same way as “is IQ 130 → 145 half the increment of smarter as IQ 85 → 115?”: the scale is only really identified up to a monotonic transformation, so all quantitative findings only really verified up to a matter of stipulation.
These issues are well-worn in the psychometrics literature. That psychometrics presumes quantitative properties of the traits through modelling assumptions in the measurement is Joel Michell’s challenge to the field (e.g.), and lurks underneath questions like “Is human intelligence really normally distributed?” (or “Are humans really getting smarter?”). The risk benchmarks hunt the models they are benchmarking rhymes with item drift. The closest human analog to the ECI is vertical scaling: stitching together different tests to span a wider range of ability, to measure improvement along it. This is known to be nightmarish: depending on the method, you get scale compression or explosion (are children taking off or hitting the wall as they go through school?), and little to adjudicate which.
And unlike human psychometrics, the data the ECI has to work with is much weaker. An item bank for a human ability test may have hundreds of individual items, each tested against thousands of humans. The ECI has ~50 benchmarks (each compressed to a single item), ~200 models, and sparse overlap both in terms of “the typical model is only tested against a minority of the benchmarks”, and also “the benchmarks have fairly limited overlap across their range” (the latter was one of the key motivations for the ECI in the first place). So the ECI is trying to do one of the theoretically hardest things you can with IRT, whilst labouring under much tighter empirical constraints.
Forking IRT
I mentioned before that IRT is basically an Elo for the game of responding correctly to benchmark questions. For Elo, here’s the win probability of player A vs. player B, given respective strengths Sa and Sb:
P(A wins) = 1 / [1 + 10^((Sb - Sa)/400)]
For a 1-parameter logistic (1PL) model for a person of ability X correctly answering a question of difficulty Y:
P(correct) = 1/ [1 + e^(Y-X)]
Modulo scaling factors (and exponent base), these are the same equation. The difference of two (latent) variables is being fed into a (logistic) link function to give the (observed) chance of success.
This equivalence provides 1PL IRT the same Elo/Bradley-Terry interval scale discussed earlier (cf. Rasch model): in the same way +100 Elo should increase your chances of winning by the same value of log-odds across all opponents (no matter their strength), an increment of person ability in 1PL IRT cashes out into an increment of log-odds of answering correctly applied to every question (no matter its difficulty).
Implicit to 1PL IRT is the assumption the items have identical discriminations. The reason most applications of IRT (including the ECI) have an additional slope parameter is this assumption does not hold - items vary in discrimination. This second parameter breaks the 1PL ‘Elo-esque’ intervals (specific objectivity, in Rasch jargon): a set increment of ability now gives varying increments of log-odds for different items.[15]
Yet, although this is much easier said than done, perhaps we could construct a set of benchmarks for AI which have ~identical discriminations to one another, such that we can dispense with the slope parameter and fit a 1PL/Rasch model of AI capability. We could then take a deep cut of representational measure theory and demonstrate ECI(Rasch) is an additive quantity.[16] “AI capability” is finally on an interval scale.
Why the scare-quotes again? Because, even if you manage all of this, you circle back to the construct (in)validity reason ‘Elo-ifying benchmarks’ did not work in the first place. With ECI(Rasch), intervals of the capability latent trait are only in terms of log-odds to answer benchmark questions correctly, and the conversion from this to AI capability simpliciter could be anything ~monotonic. Strength(answering maths questions) vs. strength(“maths”) once again.
This, alongside Mokken scaling, completes the ‘pick your poison’ dynamic for IRT modelling. At one extreme (1PL/Rasch) you can load up on modelling assumptions, arduously curate your data to satisfy them, and are rewarded with the right ruler for the wrong thing - how well they answer the questions, not how good they are at the thing the questions were assessing. At the other (non-parametric IRT/Mokken) you relax the assumptions to permit all the data to be thrown in, get a scale you can apply to the right thing, but it is no longer a ruler for anything at all.
Most IRT models (including the ECI) lie between these extremes, and enjoy both problems at once: they produce a ruler of generalized (and discrimination weighted) ‘correct answering propensity’ - neither a straightforward estimate for answering a given question correctly, nor a straight measure of the underlying trait.
(Dimensions of being, and beating, a bat)
ECI, IQ (and Elo) are also expressions of unidimensionality: there is a single axis along which humans/AIs are more or less capable in general. Although this single axis fares better than the tick marks along it, some caveats are worth admiring.
This single axis is not perfectly monolithic for either humans or AIs: verbal/non-verbal, vision/coding, and other splits exist. Thus both score and ranking can slightly vary depending on factor composition and balance - and there are no canonical answers to (e.g.) ‘how heavily should general ability weigh maths vs. verbal performance’?
A bigger one is the factor balance is likely shifting across the difficulty range, so single axis you are projecting onto is wavy (cf. differential item functioning). If you introduce a bunch of high-difficulty coding benchmarks to a capabilities index, a frontier model which is particularly strong at coding will break upwards from the earlier trend at least partly because the general capability axis has been tilted towards its strengths (e.g.).
Endogeneity looms once more. ECI velocity appears to have had a one-time acceleration in mid-2024. This roughly corresponds to the transition to reasoning models, but it also roughly corresponds to an explosion of new benchmarks, predominantly focused on maths, coding, and multi-step reasoning - i.e. the stuff we might think reasoning models are particularly suited for. Tilting the benchmark suite towards reasoning - not “teaching to the test”, but “testing what you hope (or fear) you’ve taught”, confounds the apparent acceleration.
Although far from conclusive, this story is consistent with the data. If the axis did rotate, the IRT model would absorb this into increased capabilities of the newer AIs, but also increased discrimination in the newer (and harder) benchmarks. Plotting discrimination versus difficulty shows discrimination fanning upwards, and plotting benchmark discrimination over time shows the explosion in benchmarks 2024 onwards, which average ~1.5x greater discrimination than those released pre-2024. If you turn off the regularization (which compresses all the discriminations to zero), the pre-vs.-post difference goes up to ~2x.[17]
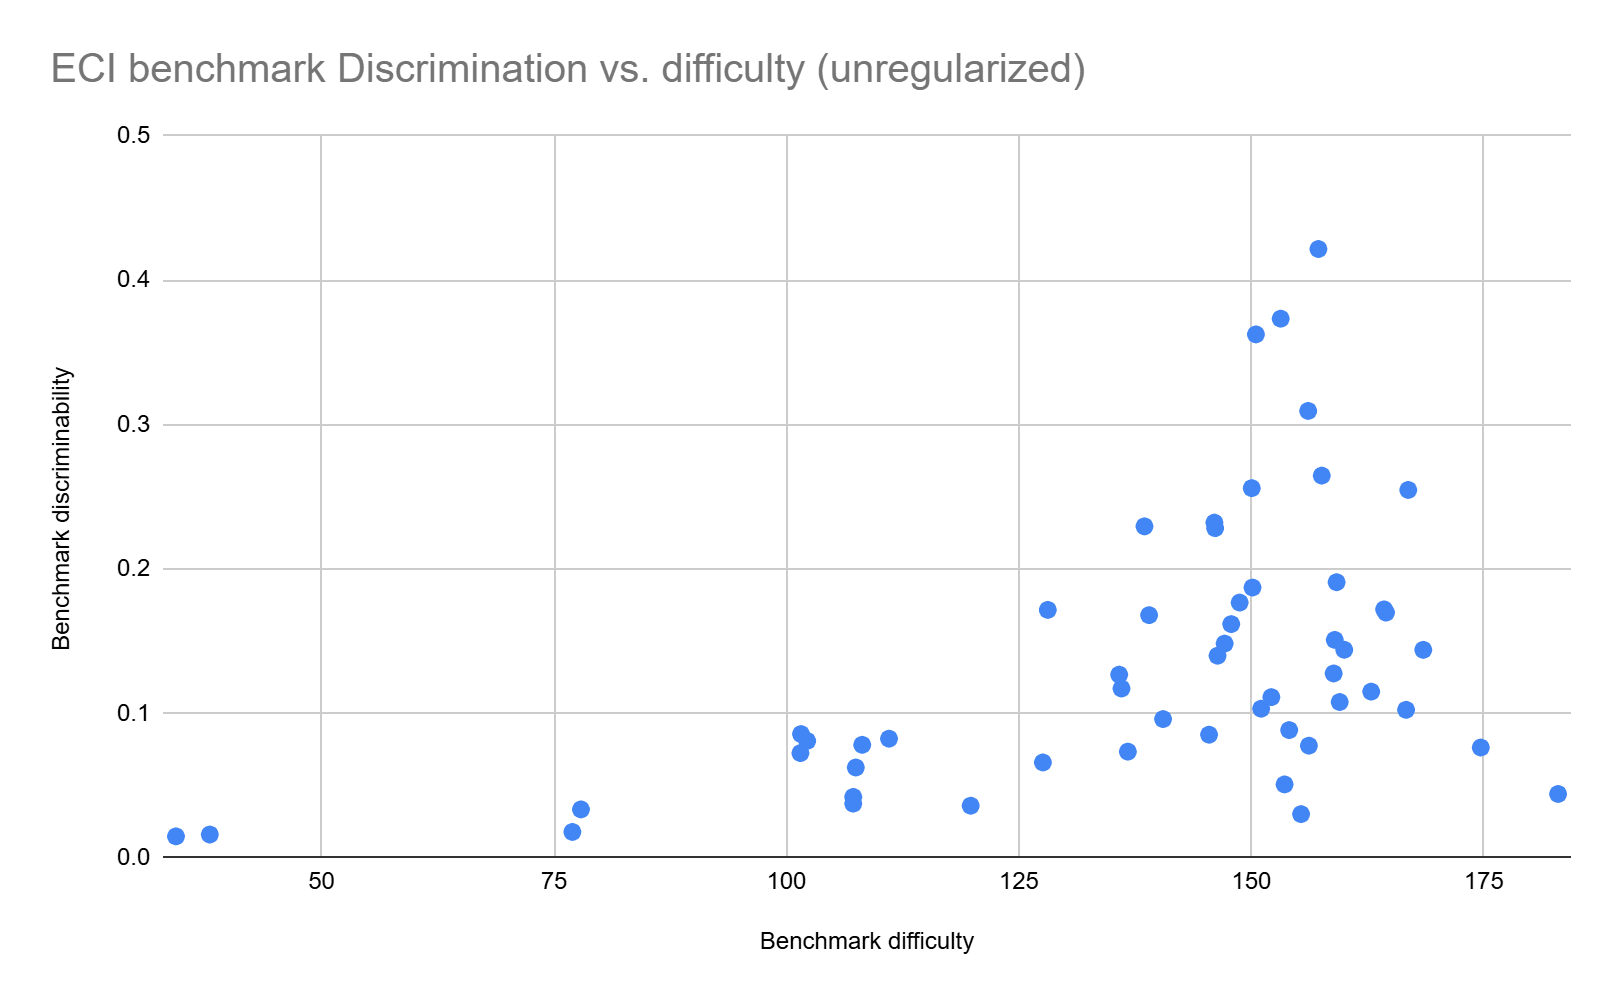
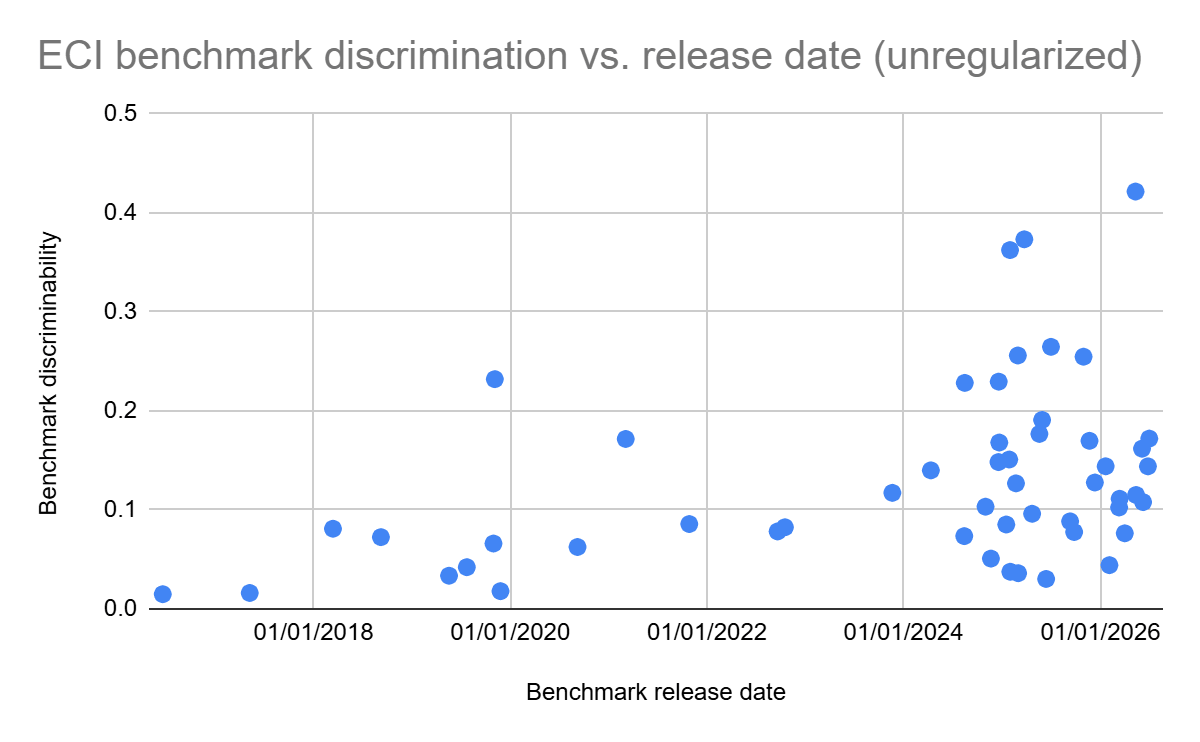
To their credit, Epoch also triangulates the ECI to Weird ML, a math benchmark subset, and Epoch TH, finding the same ~2024 acceleration in the latter 2. My axis rotation/discriminability story also loosely fits these bills:
- WeirdML, which didn’t show acceleration, is a single lower-discrimination benchmark (so somewhat a negative control for my hypothesis).
- The math-subset is composed of Math L5, FrontierMath1-3 and 4, and OTIS. Math L5 is the only one released pre 2024, and has a discrimination ~30-40% lower than the other later and harder benchmarks. I may be only seeing what I’d like to, but the kink on this plot is lower than ECI, perhaps suggesting dose-response between ‘line kink’ and ‘discrimination change’.
- I will say a lot more about Time horizons later, but for now: METR TH is composed from 3 different benchmarks concatenated, and I think it can be shown that the later/harder (sub)benchmarks have higher discrimination than the earliest one too.
The broader story is how well g or ECI summarizes the measurements depends a lot on which measures we include in the first place. We implicitly smooth out the between-human ‘jagged frontier’ of capabilities by designing IQ tests which avoid loading on specialized knowledge, language familiarity, or disability.[18] g/ECI would also look less impressive if we swapped the populations across: if you got models to do IQ tests, or humans a benchmark corpus, you would still have some signal, but much attenuated. The reason why g/ECI work is that human brains are approximately similar to each other, ditto LLMs, and each permits a common axis to be drawn through each group.
That the human and LLM common axis correlate with each other, but poorly so, explains the ‘jagged frontier’ of AI. I think this is best understood without privileging human ability as the truly spherical, but merely the default frame of reference. Bat scientist: “Humans: astonishing vision, but atrocious biosonar”.
Prediction (cf. chronometry)
Outside of test scores, some cognitive metrics come with hard numbers pre-attached: digit span is one, vocabulary size another, judgemental accuracy a third. A favourite of psychometricians disenchanted with standard IQ testing is reaction time/response speed - mental chronometry. Like sprinting 100m, this measure is naturally a ratio scale: if I get the right answers on our maths homework in half the time, I am twice as fast.
You can get similar ‘hard numbers’ for AI by assessing prediction error, which could be applied to next-token prediction (e.g. log-loss in the various ‘scaling law’ papers, q.v.), or to more real-world forecasting problems. But you again run into the familiar problem: you can get a real scale for something only related to what you really care about, and translation between the two something clearly non-linear but otherwise murky.[19]
For humans, reaction time, vocabulary size, and digit span all (weakly) correlate to g. Yet clearly ‘twice as fast’ ≠ ‘twice as smart’; 2k → 3k words not the same degree of smarter (or even ‘better at the language’) as 30k → 31k; a memory athlete who drills their digit span up to the hundreds isn’t some general superintelligence vs. the untrained human population who can manage ~7 (and so on). For AI, even if ‘forecast error’ for next-token prediction was linear to (say) geopolitical forecast accuracy (it is not), getting twice as close in general doesn’t mean generally twice as capable.[20]
Ironically, AI itself illustrates how these measures can come apart. Response speed for an AI model can be modulated by how much compute I throw at serving it: double tok/s ~ halve response times. Yet our natural language would say this is pretty orthogonal to how smart the model is. And although latency does matter for capability (especially if we twist the dials to extremes: GPT-4 responses in a second generally >> GPT-5 responses in a year), the latency/quality trade-off is non-linear and context-dependent.
Time horizons
Perhaps the best try for ‘chronometry, but for something we really care about’ are METR’s time horizons. Time horizon has a real zero, real multiples, and seems something both facially important and naturally interpretable. And by this measure, we see exponential progress - albeit often presented on a log scale:
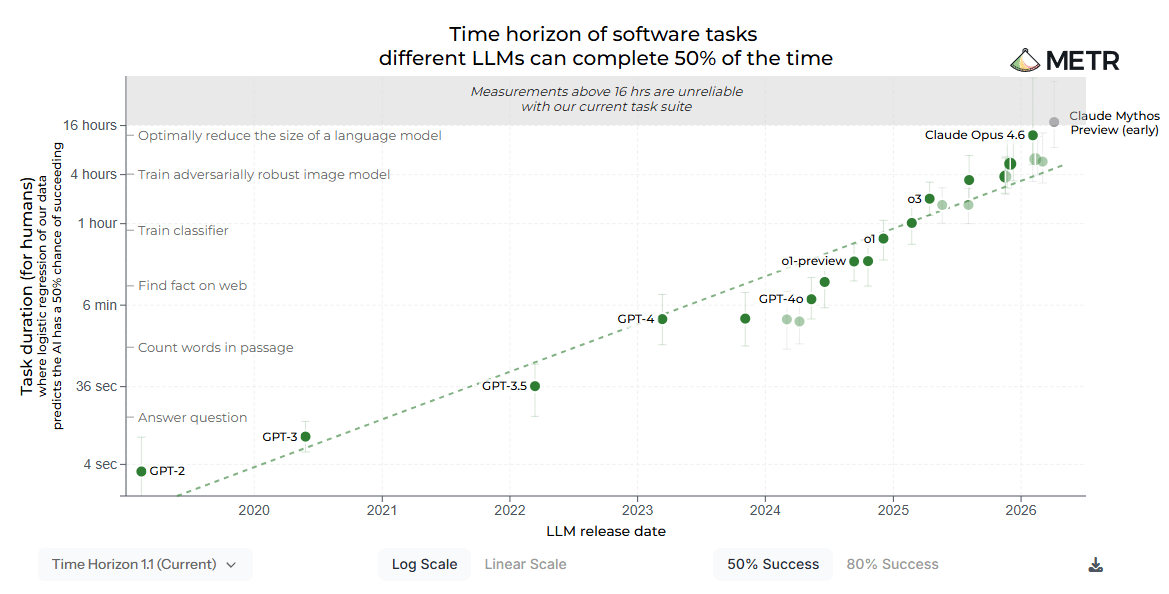
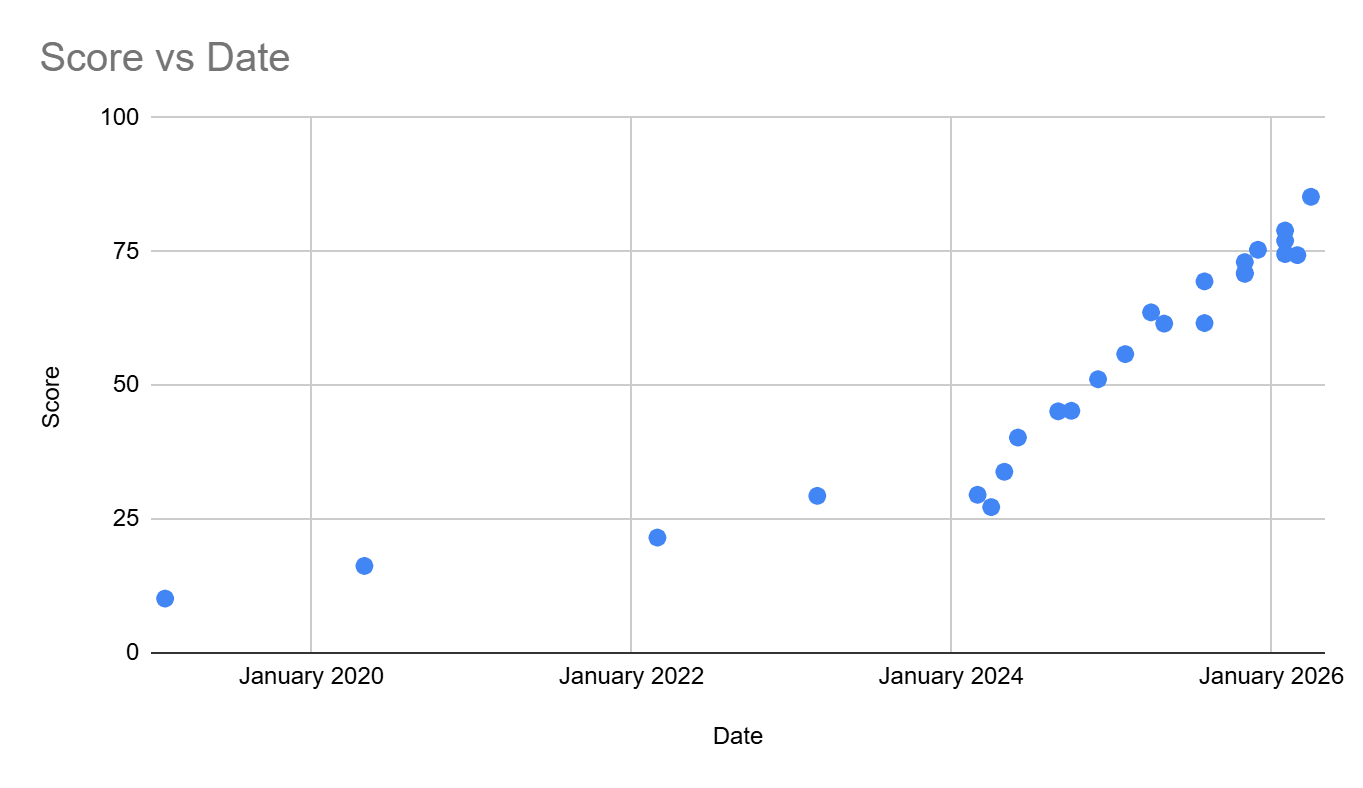
Of interest, if you switch the y-axis from log (50% time horizon) to raw score - what proportion of tasks the models managed to complete - the graph looks remarkably similar: ~linear trend to ~2024, then a steeper ~linear trend since.
This suggests log(50% TH) is linear in raw score, and that suggests 50% time horizons are exponential in raw score. Both indeed are the case, so ‘exponentiate the raw score’ is a good shortcut to the same results as METR’s much more sophisticated item-level technique.
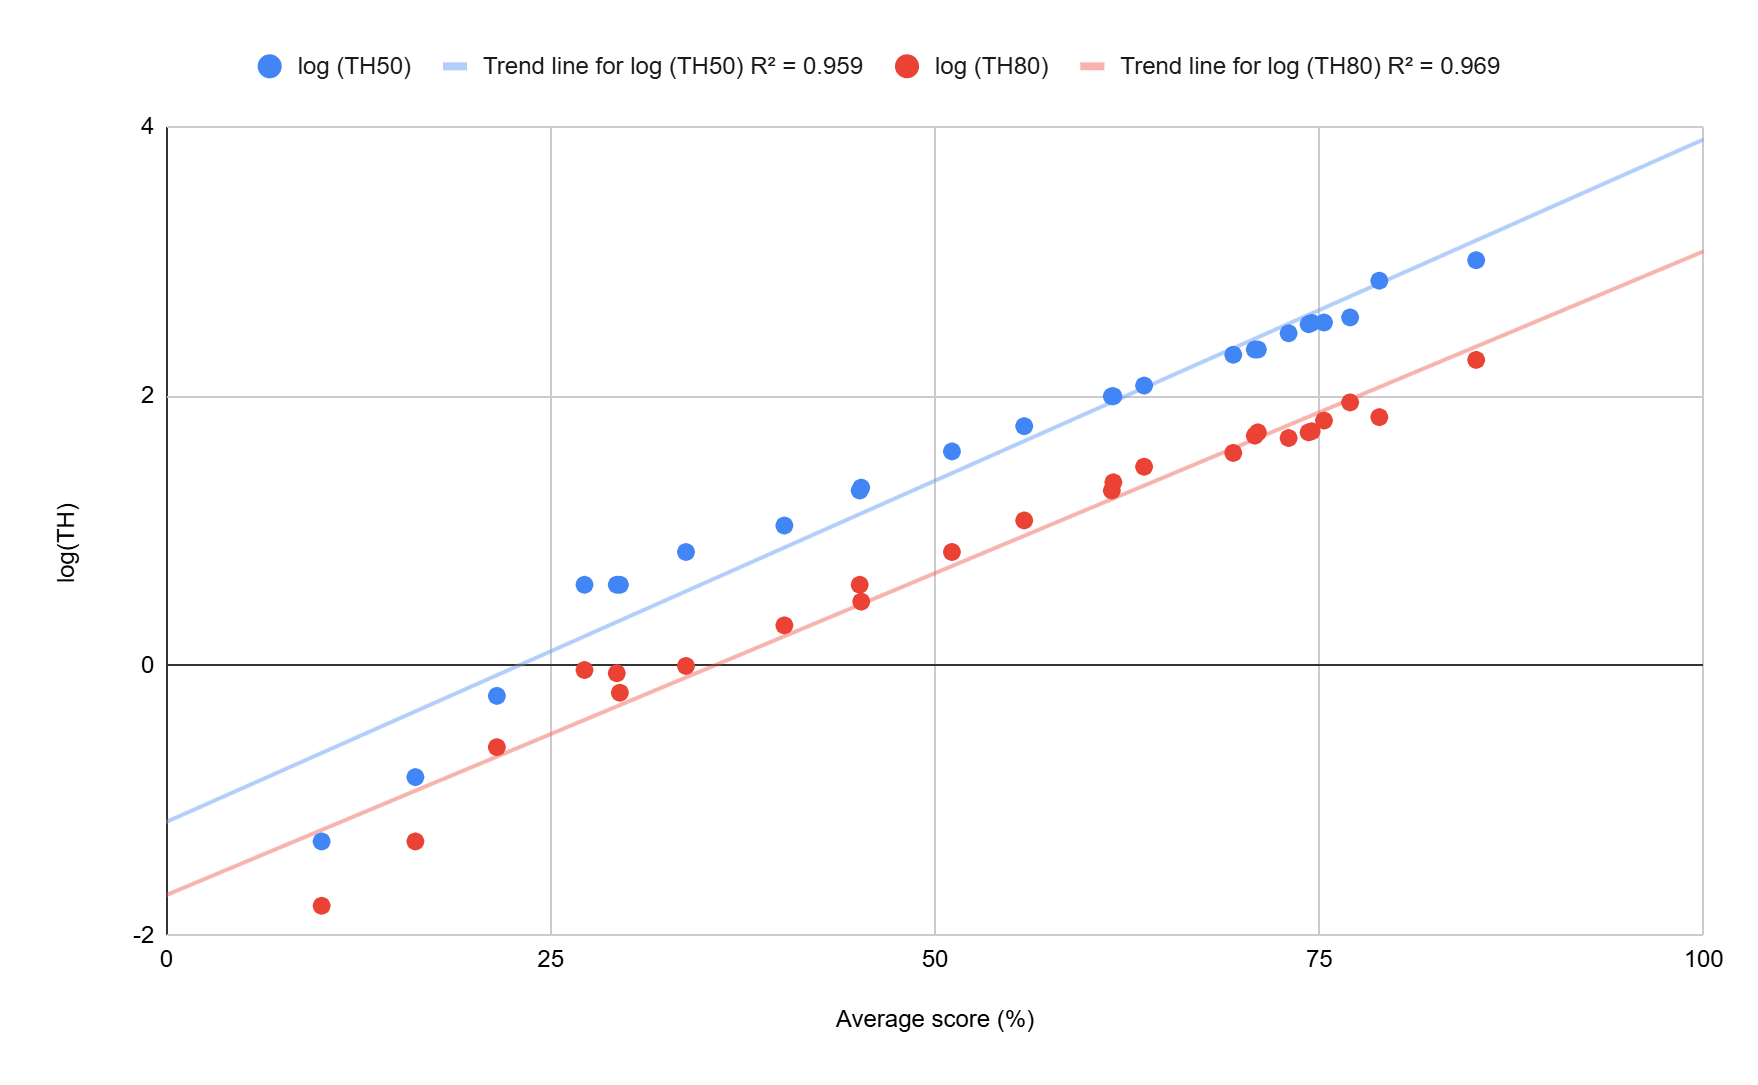
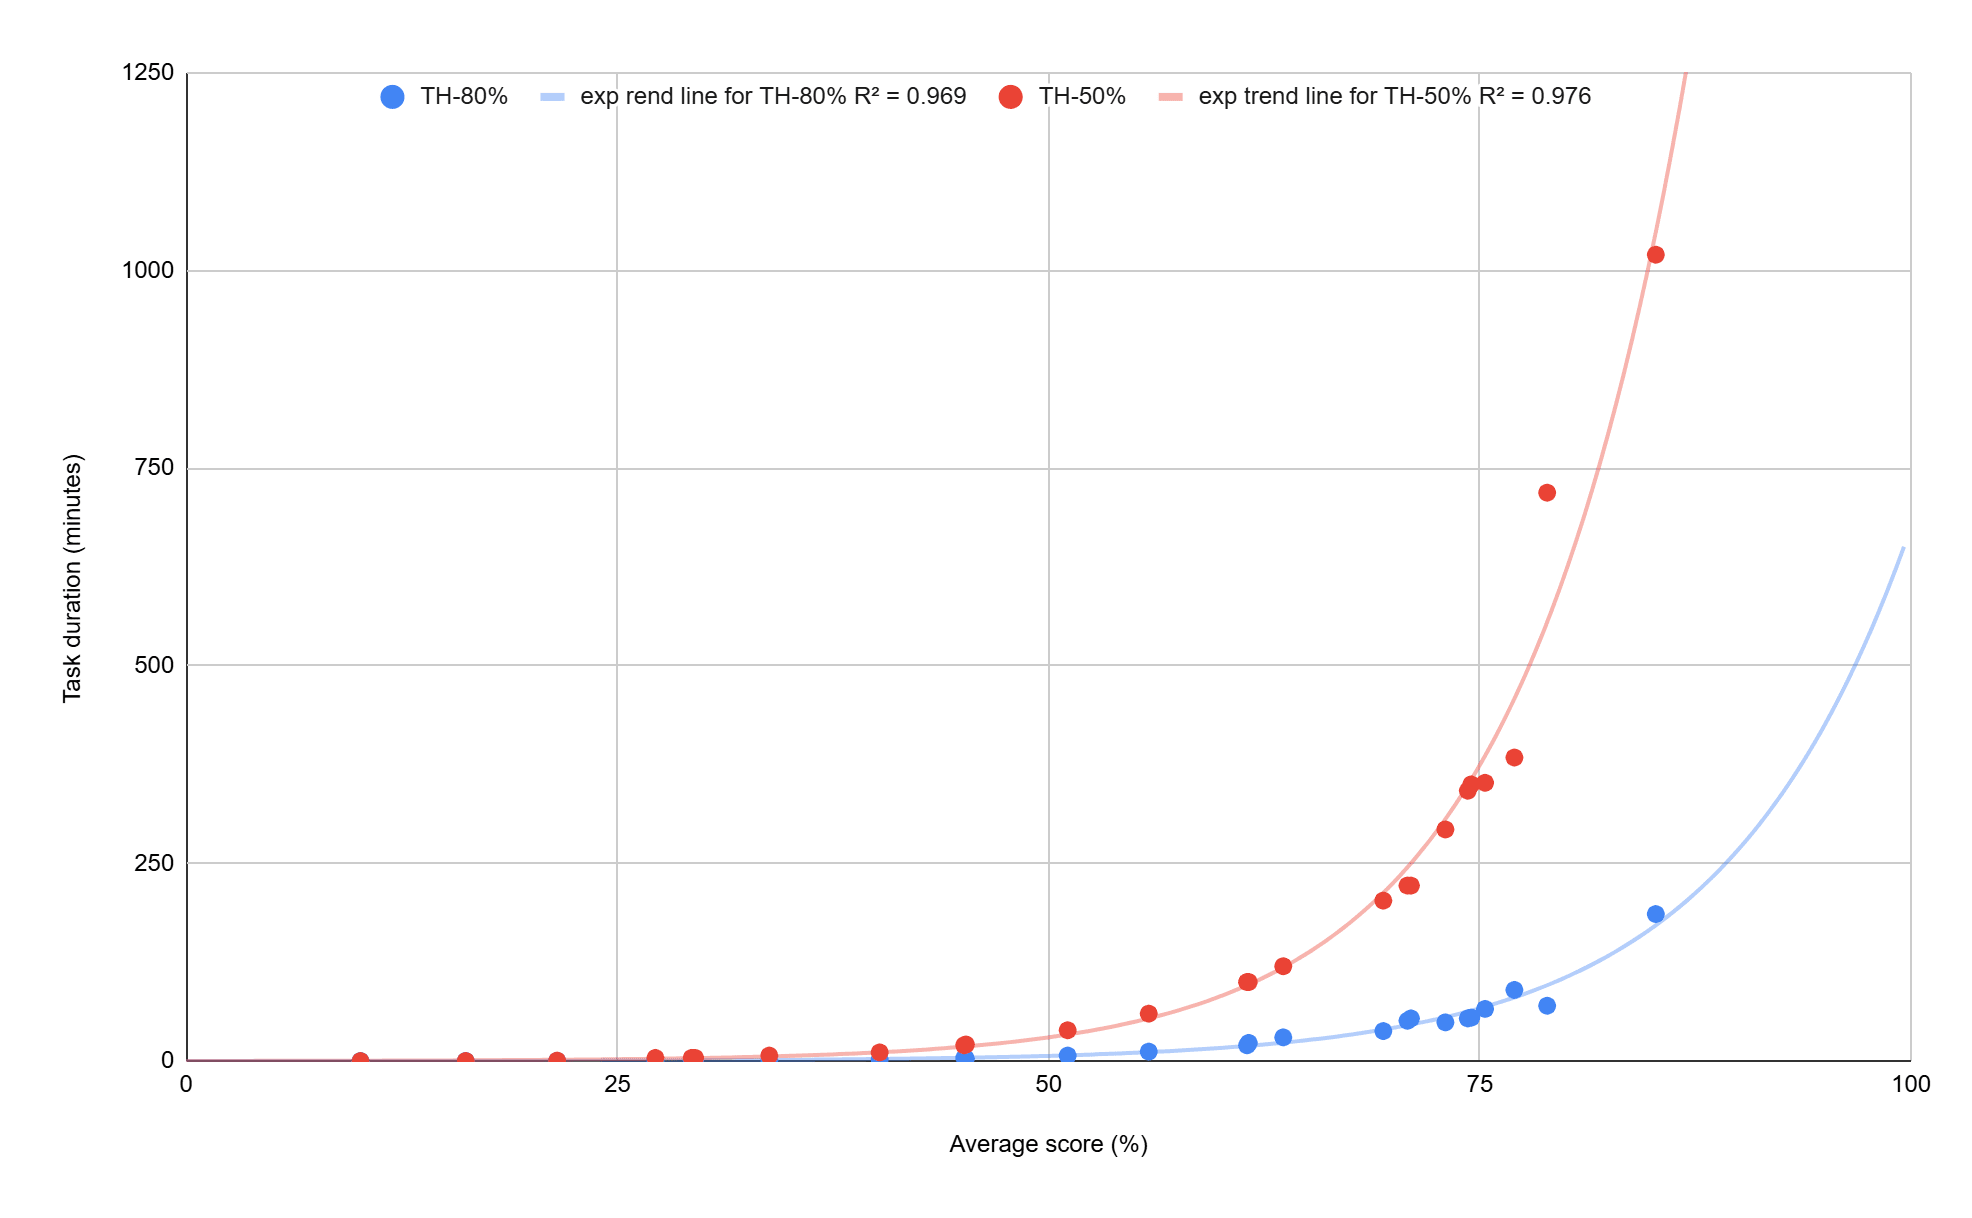
The reason why total score and time horizon line up so well is METR’s item-level technique is basically[21] the same 2-parameter logistic model we saw earlier in the ECI:
P(success) = σ(α(log h − log t))
METR’s TH, unlike Epoch’s ECI, assesses models against all items in their test suite. In such cases, the total number of correct answers is nearly a sufficient statistic for the IRT model’s ‘ability’ parameter (log h), and so >0.9 correlations between total score and latent trait value is the typical finding.[22] That the latent ‘ability’ trait is literally log (50% time horizon) explains the exponential relationship in the second panel: total score ~ log h, h = 50% TH, so 10^score ~ 50% TH. Thus linear improvements in benchmark score translate into exponential growth in time horizons: each 6% in score ~ 1 doubling.
Human “capability” is also exponential in time horizon
So what? Time horizons were independently measured, and the good fit of the model that asserts TH ~ 10^(score) is an empirical finding rather than some stipulated definition. If you measure time taken and find it varies on a log scale task-to-task, ‘better models can do exponentially longer tasks’ should follow however you reasonably slice your analysis. It also appears to generalize: log TH correlates pretty well to the ECI (suggesting you could have timed tasks in alternative benchmarks and seen something similar), and similar-shaped findings emerge, albeit with less rigorous measurement, across many domains. If we are inclined to dismiss the exponential curve as some mechanistic reparameterization, we need to offer a similarly-general mechanism.
I have a suggestion. “(time taken) ~ 10^(item difficulty - human ability)”: the time a human needs to complete a task explodes exponentially as it gets progressively more difficult for them; a less “capable”[23] human takes some constant multiple more time to complete the same tasks as a more capable one.
For face validity: I hope I could retrieve items in the 12x12 times table much faster than a child yet to memorize it could calculate them, but it would take me vastly longer (i.e. lock me up with the textbooks for weeks) than a Maths PhD student to do a question on their prequal exam. But I think we’d be reluctant to resolve OOM differences in time taken to OOM differences in ‘true’ capability.
The psychometric literature on human response/task completion times also agrees. From ‘reaction time’ to ‘completing an untimed online test’, the distribution found is a broadly lognormal one (see). Further, differences in ability seem to work as multiplicative factors: a common model for completion times is a log(normal) IRT, with subject ability and item difficulty as latent variables, and completion time scaling exponentially to their difference (e.g., also).[24]
Some results from METR also point in the same direction. METR reports that the per-task completion times (i.e. different baseliners attempting the same task) had log-ish variation run-to-run (see). METR also found their SWEs were ~10x faster than baseliners given the same tasks taken from maintaining METR’s code.
Writing this into the model would log the y axis again - exponential gains in TH equate to ~linear gains in ‘true’ model ability. It also implies tasks don’t have a freestanding duration to discover, as task duration is always relative to the ability of whoever/whatever is trying to complete them: a ‘2 hour task’ could turn into (say) a 1 or 4 hr task, if the baseliners were more or less able.[25] In essence, we have reframed the exponential as something ‘about humans completing tasks in general’ rather than ‘about AI progress in particular’.
Intuitive/interpretative prelude
Whether you accept this reframing a matter of interpretative taste - the numbers can work either way we parameterize the y-axis. Even if I am right logging drags them closer to folk impressions (e.g. child → me → Math PhD is not ‘really’ spanning many orders of magnitude in maths ability; Alice cracking 70% on the METR task suite is not ‘really’ a 10x more capable SWE than Bob who gets 50%, etc.), perhaps our intuitions are log(reality), in the same way our eyes and ears are roughly log(brightness) and log(sound). Time is in fact the real currency of capabilities for both humans and AIs, so linear improvement for either on a maths test or other benchmark indeed implies exponentially improving capability.
Perhaps. But insofar as folk impressions count, they count against (TH was proposed as an intuitive quantity). And exponentiating everything cuts both ways: if we say our 5 year old is really getting exponentially ‘better at maths’ as they progress from times tables to maths PhD, we also need to say there are many orders of magnitude between the two (cf.). So an AI model could be 100x (1000x, whatever) better than the average person (or average expert) at X, yet still nowhere close to being superhuman at it - what’s the time horizon to discover general relativity in 1915 for an average physicist?
Most important, though, is that taking the exponential seriously is not only counter-intuitive when applied to humans, but looks odd when applied to AI models themselves. Opus 4.6 has a 50% time horizon of 719 minutes, Opus 4.5 a 50% time horizon of 293. If we take 50% TH as linear in AI capability, Opus 4.6 is more than twice as capable as Opus 4.5. Thus, as an interval, Opus 4.5 → 4.6 was a greater advance in AI capability than 0 → Opus 4.5. A version bump of a frontier model represents a greater advance than going from dawn-of-time → Turing → LLMs → reasoning models, and all the incremental advances up to and including Opus 4.5 itself.
Maybe this is a cheap shot: on the 80% horizon Opus 4.5 → 4.6 is only (perhaps ‘only’) 40% as large an advance as everything up to and including Opus 4.5; Opus 4.6 was a bit above trend, and we’re at the upper range of the scale where the confidence intervals are exploding. But exponential curves give plenty more where that came from:[26] Opus 4.1 → 4.5 being a larger interval than 0 → Opus 4.1 (on both 50% and 80% horizons, and with better-behaved CIs) isn’t much better; nor the GPT 4→5 interval being ~30 times larger than GPT 3 → 4; nor the mid-point between GPT2 and GPT5.4 being roughly o3.
But perhaps all this simply underlines that time horizon figures should not be taken literally as ‘AI capability’: as METR has said (repeatedly, among many other things, yet largely in vain), performance on fairly ‘clean’ SWE/ML/Cyber tasks does not straightforwardly translate to ~anything else. So (e.g.) hitting 8hrs/1 week/1 month/whatever doesn’t necessarily mean labour automation (although METR and others seem to like the ‘1 month’ bar, and AI futures is willing to swing at extrapolating the 80% TH out to ~3-125 years);[27] the baseliner time horizon being ~1.5 hours ≠ frontier models are 10x software engineers; etc.
Not so fast. Even if we’re cautioned from taking time horizons literally, we are invited to take them linearly. We assess time horizons to take something from them, and surely the minimal something is that ‘AI is on an exponential’ (e.g.). Thus the temptation is to take caveats around task domain, ‘messiness’, 50% vs 99% reliability (etc.) as offsets or scaling factors - with an exponential curve, these tend not to matter much.
Yet if ‘(your preferred specification of) AI capability = m(50% Time Horizon) + c’, all[28] the previous implausible conclusions around version bumps on the current frontier being greater leaps in AI capability than going from perceptrons to reasoning models bite again: affine transformation does not change the interval structure. To avoid them, one needs to alter the functional form of time horizons (presumably to something sub-exponential) with some sort of non-linear transformation.
‘AI capability’ ~ f(measurement), where f is a non-linear transformation which warps the intervals? Funhouse mirror, our old friend…
Time horizons and ECI share an axis kink
If you look again at log(50% TH) vs. raw score, the relationship isn’t quite linear, with a knee at ~ 25%:
I think this is best explained as a minor suite composition artefact: the easiest/shortest ~25% of tasks are Software Atomic Actions (SWAA), whilst most of the remainder are from Human-Calibrated Autonomous Software Tasks (HCAST). The small kink implies the items aren’t quite log-uniformly distributed by duration, with short/SWAA tasks mildly undersampled: the graph climbs upwards more steeply as SWAA is saturated, slowing down at the SWAA → HCAST transition at 25%.
Perhaps more interesting (/concerning) is the score vs. time graph breaks at a similar point: score progress (thus time horizon progress) accelerates after passing ~25%, the same SWAA → HCAST transition:
This suggests measurement artefact could explain the apparent acceleration of capabilities in 2024. SWAA and HCAST are essentially two (sub)benchmarks stitched end-to-end. If HCAST items have tighter discrimination than SWAA ones, then a constant rate of progress in ‘capability’ would give a shallower slope across the SWAA items than it would across the HCAST items, so traversing from SWAA → HCAST would cause the straight line to kink upwards.
We should expect HCAST to discriminate more tightly than the SWAA in principle. If an HCAST item is roughly analogous to a series of atomic software actions which need to be successfully completed in sequence, then P(HCAST success) ~ P(SWAA success)^n(atoms). The ^n term would amplify small differences in atomic success rate to larger gaps in multi-step task completion probability - cf. Ord on AI-agent half lives.
Empirically, HCAST having tighter discrimination than SWAA explains the logistic fit over-predicting success on short tasks, as well as the ‘HCAST only’ fit in the original paper giving a steeper trend. It also offers an elegant resolution to the paradox whereby editing the data so Opus 4.6 succeeds at all the short tasks it failed lowers its time horizon by about 25%:
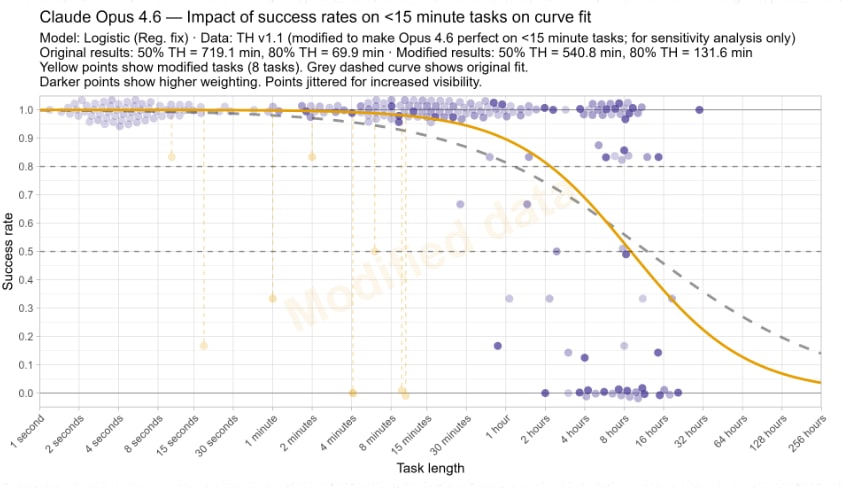
If SWAA and HCAST items have different discriminations, a logistic curve fitted over the entire set has to split the difference between them for its slope parameter (grey dashed line). If you set all short tasks to success, this eliminates the lower discrimination SWAA portion, so the model can err towards the higher discrimination HCAST region to fit a steeper slope (yellow line) which passes through 50% earlier.[29]
Earlier I suggested the 2024 kink upwards in the ECI could be explained by the transition from non-reasoning to reasoning benchmarks, and rotating the measurement axis to line up closer to model strengths accentuates progress - newer ‘reasoning’ benchmarks discriminate between reasoning models more tightly than the older ‘non-reasoning’ benchmarks.
The parallels to TH here are neat: the lower-discrimination SWAA region is the collection of earlier non-reasoning benchmarks (recall in the ECI each benchmark is collapsed to a single item), the higher-discrimination HCAST region is the collection of later reasoning benchmarks, and the seam where the mathematical modelling stitches them together the kink in the axis. So rather than independent corroboration of an acceleration in 2024, TH and ECI may simply have agreed to share the same “start giving reasoning tests to the reasoning models” distortion of their y-axis.
Perhaps money, as a measure, stinks the least
Perhaps for time horizons we could specify ‘capability’ to be something more like ‘economic utility’ than 'intelligence'. “Can do twice as long tasks” is not a crazy bid for “twice as productive” (labour is priced by the hour), and so TH really does demonstrate AI is getting exponentially better at useful work, regardless of whether that means AI is getting exponentially better simpliciter.
This substitution helps a little, but not all that much. The earlier caveats still make the translation of time horizon into economic usefulness murky: ‘can do 8 hr tasks’ ≠ ‘can do a day’s work’; perhaps time horizon is to economic utility as sprint times are to footballer value on the transfer market. The empirical correlations, even in the domain the TH suite targets, appear loose: TH climbing exponentially ~1 to ~5hrs in 2025-6 gave -20% to (many caveats) +20% software engineer uplift in METR’s studies.
It also goes wrong the other way. I think agentic coding has proven at least ‘small-t’ transformative for software engineering (a few have told me ‘we don’t code by hand anymore’), but said transformation is invisible in the time horizon curve, which (like other coding benchmarks) progressed on-trend through Opus 4.5/Claude code.
Reality reconciles these dissonances, and we can try too. Perhaps “shadow productivity” ate initial real gains (SWEs in 2025 internalized the initial uplift by migrating to a >20% less unpleasant style of work, and now enjoy this alongside shipping faster as capabilities got better still); or perhaps ‘vibe coding’ only addicts us to the sensation of performance whilst hindering good software development - in the same way social media/screens/smartphones seldom uplift, but typically parasitize, our personal lives. Perhaps earlier models (Opus 4.1? o3?) would have been enough to drive the coding transformation, but models improved beyond ‘minimum sufficient’ capability before the products/ecosystem/user behaviour could catch up to harness it.
My point stands regardless: capacity (for economic use) cannot be read off the time horizon graph, but instead refracts through these intermediate considerations. If “TH is the measure of the potential to have economic effect, but this is very loosely coupled to when and how much these effects materialize”, we’ve lost most of the attractive concreteness and are back to fairly-ineffable.
Zooming out to broader economic indicators is similarly discordant: (e.g.) AI company revenue and CapEx are going roughly exponential, whilst any impact on employment remains difficult to discern. And an even wider variety of other stuff can intercede: Jevons, Baumol, winner-take-all, externalities, plus the usual “future is here, just not evenly distributed/overhang” vs. ”circular financing; subsidized demand”, etc. And the economic indicators are not always straightforward to measure in their own right (e.g. index number problems).
Their key advantage, though, is the rotation of ‘capability’ towards a more concrete and meaningful bottom line. Willingness to pay for an upgraded model may not say how much capability the upgrade represents, but tells you how much it is worth - the currency for economic value is currency. “Should I care about ECI hitting 300? (or 50% TH hitting 1 year?)” remain open, whilst “should I care about unemployment doubling?” basically answers itself. Most stories of AI weirding the world have them do drastic things to the economy along the way - if you see the AI transformation ‘everywhere except the productivity statistics’, perhaps you haven’t seen an AI transformation yet.[30]
Finale: AI as normal epistemics
Maybe we should blame our minds, rather than our measures, for this mess. If ‘AI capability’ is composed in our heads as some vibesy n-point-something-ish dimensional blob, the measuring-sticks we evoke from it are inevitably malformed, and re-erecting the ideal from their crooked timber a fool's errand. The economic measures are the least bad only because they best side-step the “but what does AI capability really mean?” mire.
Perhaps, then, this blob in the middle of the funhouse mirror is better off deflated. We only really have the measures and the weird morphs between them. Some scales may better serve particular purposes, but talk of which are realer or truer measurements of ‘AI capability’ no better than judging pirouettes at a masquerade.
Not quite: most natural language lies between ‘fully specified’ and ‘meaningless’. On the deflationary reading, all my intuitive appeals earlier (“AI capability is not linear in X”, “My 50% higher score doesn’t really make me 50% better than you”, etc.) are counterfeit: face validity is mere convention, no better or worse than any other we care to stipulate. But all those appeals were true, and thus truth-apt. We may not know what a happy childhood exactly is (or whether it can be exactly anything), but we can be sure understanding it as “proportional to the dollar value of birthday presents received” is impoverished beyond bankruptcy. If you define ‘musicianship’ as how fast someone can play the notes, your definition sucks.[31]
Our minds can measure verbal blobs a little better than an ordinal scale - we can also roughly order intervals. In terms of “democraticness” not only Iceland > United States > North Korea, but the US → NK gap is much larger than Iceland → US one.[32] Sciences softer than biochemistry are hindered, but not sterilized, by only really having ordered metric scales to work with. From numerically spelling out our guesswork, running the numbers may revise our understanding: a correlation matrix could persuade us (e.g.) human intelligence has ~one dimension (or personality ~5) even if we initially thought otherwise; if “democraticness” scores are evenly-distributed rather than clustered, this tentatively suggests democracy comes in spectra rather than stages.[33] Metrics can also score against reality: football analytics can still find measures which better predict winning, even if they never distil the essence of footballing.
We could hope for more. Like AI benchmarks, liquid thermometers have floor/ceiling issues: mercury freezes and alcohol boils at temperature ranges you could be interested in. Their thermal expansion as liquids is not perfectly linear: the ‘measured by mercury expansion’ and ‘measured by alcohol expansion’ temperature scale (+ others) systematically differ. We got to real temperature (and more accurate and wide-ranging thermometers) through steady iteration and refinement between theory and measurement (q.v. Hasok Chang’s masterwork Inventing Temperature).
Maybe AI could turn out the same way, and our current situation is more analogous to early thermometry than softer science. Although in practice the ECI labours under worse data than human psychometrics, in principle it should vastly exceed it by quality and quantity (AIs don’t get tired, can be reset, and deliberate ablations are less morally troubling). The log-loss scaling laws are pretty lawlike, and perhaps effective compute alludes to a Carnot engine. Perhaps better taskology could atomize economic work into particular activities, and those into atomic actions, and their statistics the elements to show what AIs can really do.
But not all hopes are expectations. Unlike hot and cold, our pre-theoretic intuitions on AI are far apart - see the various camps sneering at each other on twitter re. coping, in thrall to (un)vested interests, or whatever. Unlike thermometric fluids (or matter generally), AI measures do not all expand pretty-much linearly modulo small distortions, but differ by functional form. And unlike freezing and boiling points, there are precious few external anchors for triangulation and calibration; endogeneity blooms instead. Practically, the triumph of temperature took a while, the triumph of psychometrics still awaited, and AI has further to travel over more difficult terrain. Yet time, according to many, is scarce.
In the meanwhile, the best we can do is the usual playbook for tricky questions: where possible, deflate to specifics, and argue in their native currency. “Is AI a major cybersecurity risk?” has a variety of variably concrete indicators: incidents, insurance premia (H/T Guive Assadi), CVEs, cyberevals, testimonials. Each is murky, and how to weigh each in an answer may depend on how we word (or interpret) the question. But at least some of them are concrete, and the narrative lines we draw through the data can at least give vague predictions of real things we may or may not see next.
A member of the public (or the policy maker) may ask broader questions about AI in general. The narrative verdict here is necessarily inconclusive. The economic indicators are perhaps the least-bad summary - not only because they have the best purchase on what people really care about, but the track record of economics tempers expectations. The numbers, as they stand, can only gesture towards what may or may not be really going on.
Acknowledgements
Thanks to Tom Cunningham, Max Dalton, Max Daniel, Oscar Delaney, Jean-Stanislas Denain, John Halstead, Lizka Vaintrob, Dan Williams, and Linchuan Zhang for commentary on earlier drafts. Special thanks to Alex Barry, David Manheim, and Toby Ord for especially thorough review and criticism. Their kind help does not imply agreement, and the errors remain my own.
I wrote this whilst supported as a contractor with Forethought.
- ^
E.g. Longer distances (200m, 400m, etc.) start to load more on endurance, shorter ones (e.g. 40m dash) load more on acceleration than top speed. Yet natural language typically means fast as roughly top speed/short distance (vs. e.g. a marathon time), and 40-200m times are not-too-far from proportional.
- ^
Less than coincidentally, we have a much murkier grasp of what a footballer ‘twice as good as Zidane’ would look like, whilst a sprinter ‘twice as good as Usain Bolt’ is much clearer: they would have a 100m time of ~5 seconds, running a bit faster than a Cheetah.
- ^
Running fast matters more to a winger than a goalkeeper, height more important for a central defender than a midfielder, etc. Football punditry exhausts itself dissecting finer interaction terms - certain capabilities could matter more or less depending on team formation, style of play, complementarities between certain players, etc.
- ^
This oversimplifies. Elo relies on underlying strength being unidimensional, and so orderings thus transitive: it doesn’t work so well for games which have more ‘rock/paper/scissors’ dynamics.
- ^
The motivation for Elo transforming these strengths, despite losing these neat properties, is to make constant differences easily interpretable: if I have 100 Elo more than you I have ~64% chance of winning, no matter if your Elo is 200 or 3000.
- ^
Sort of. “Tennis matches discriminate much more tightly than football ones, so tennis games are more likely to return the slightly-stronger player as the winner”, vs. “Tennis matches and football matches have similar discrimination, but it so happens there are wider gaps in strength between elite tennis players than there are between top football teams” can be mathematically equivalent - you have to appeal to something outside the model to adjudicate (more later).
But if this is granted, one can see the ‘consistently beating’ and ‘dramatically better’ can come apart. Suppose Alice is 10% more productive than Bob: if I’m really good at assessing applicants (say I can reliably discriminate 1% differences in productivity), Alice will have a much higher “winning jobs I offer” Elo than Bob. if I’m much worse (say I can only reliably discriminate 50% differences), then Alice and Bob look much closer in terms of ‘job Elo’, without any change in their real ability.
- ^
Cf. Page 3 of the Rosetta stone paper:
During this stage we also address the model’s identifiability issues, where multiple different sets of αb, Cm, Db arrive at the same predicted performance(m, b). This occurs in two ways:
Multiplicative rescale: The model fits the data equally well with {αb, Cm, Db} and a rescaled version {kαb, Cm k , Db k } for some factor k ∈ R \ {0}.
Additive shift: The model fits the data equally well independent of the absolute values of Cm and Db. So Cm + δ and Db + δ would in theory yield just as good of a model fit, for some δ ∈ R.
- ^
To be slightly more technical, interval scales identify their quantities up to an affine transformation - y = mx + c. If you remap the zero to any value (c), and stretch/shrink the tick marks by whatever amount (m - can't be zero), the distance between two points on the new scale is proportional to the distance between them on the old one, and so ratios of these distances remain the same.
- ^
So how come, if IQ is really ordinal after all, can we do things that assume it is on an interval scale - like calculate averages, plug it into regressions (etc.) - and still get sensible answers?
In essence:
- Parametric statistical methods are broadly robust to variable transformations: regression techniques will still work okay even if IQ was ‘really’ log-normal or otherwise warped.
- They roughly approximate non-parametric methods with large enough samples, and the sense we are making from the result is often dropping from interval → ordinal anyway. Although a purist would note you shouldn’t do t-tests on likert scale data (as ‘strongly agree’ → ‘agree’ may not be the same decrement of approval as agree → ‘neither agree or disagree’) it is usually safe to say the population agrees with A > B if there’s a statistically significant difference in mean score despite “3.3 → 3.7 on the Likert scale” being kind of meaningless.
- The relationship between IQ and X are commonly non-linear for most X, so it is up for interpretative grabs whether the non-linearity emerges from (e.g.) ‘being smarter has accelerating returns re. X’ vs. ‘being smarter has linear returns re. X, but IQ is concave in ‘true’ human intelligence’
- ^
Usually. Some benchmarks have a guessing floor (e.g. for a benchmark composed of 5 option MCQs, random guessing scores 20%), and some have a score ceiling <100% due to question noise. You can (and Epoch does) add additional parameters to the equation to adjust the y-axis for each benchmark appropriately.
- ^
Epoch adds a touch of regularization (ridge regression) in their fit. Although it is likely too mild to be that material, I’m not sure regularizing is the best approach: given your main interest is in the parameter values, biasing them to reduce variance may not be the right trade.
- ^
In principle the data can discriminate, especially out on the tail: they changed the link function for Chess Elos from normal ogive to logistic because the fatter tails of the latter better captured the true rate of upsets - normally distributed performance asserted weaker players beat stronger ones much less frequently than they actually did.
In practice, tail behaviour for AI benchmarks is very noisy/uninformative, and any link function which is roughly linear over the ‘middle’ of percentages will likely do. Table 9 in the index ECI paper compares a logistic link function versus a clipped linear one, finding they are indistinguishable on the data (e.g. R2 0.8641 vs. 0.8683).
- ^
One curiosity/complaint raised by Joel Michell is you also lose the interval scale with perfect item discrimination. If all items each have a strict threshold of difficulty where all models below score 0, but all equal or more capable score 1, then your items form a strict Guttman scale, which only offers ordering: a model which passes the easiest 10 items is better than the one which passes the easiest 9, but there’s no data to set where the 10 items are distributed along the difficulty axis. It seems dubious you ever really captured an interval scale if it would vanish again at the limit of better measurement.
Maybe not. Perfect discrimination may not mean a better measurement: items with strict threshold are less informative than ones with smooth curves: the former only gives 1 bit of information, whilst the latter gives a P(success) with many more. But this does rely on the (Guttman/) error-generating process being informative: that you are getting the smooth variation because “ability is probabilistic wrt answering questions”, not measurement error or other noise.
- ^
The Rosetta Stone paper was curious about why the capability index found the gap between GPT 3 → 4 was about half GPT 4 → 5, as most intuited the second gap was smaller:
GPT-3 to GPT-4 to GPT-5 Many people were less impressed by the jump from GPT-4 to GPT-5 compared to the one from GPT-3 to GPT-4. But our statistical framework predicts that the jump from GPT-4-to-GPT-5 was possibly twice as large as the one from GPT-3-to-GPT-4! We show this in Table 10.
Why is there a discrepancy between the model’s predictions and how people felt about the sizes of these two jumps? One possible reason is that there were many more notable releases between GPT-4 and GPT-5, like GPT-4o and o3, compared to between GPT-3 and GPT-4. Another possible reason is that our model’s predictions for some of these earlier models are especially unreliable, since they’re based on sparser data.
Given the current ECI starts in 2023 (~GPT4 onwards), it seems Epoch opted for the data sparsity explanation (although ‘wider range’ and ‘sparse data’ are problems the ECI was addressed to in the first place).
My deflationary counter-offer is simple: the capability index intervals are essentially artefacts of the modelling assumptions, so carry no warranty of being linear in vibes, impressiveness, ‘true capability’, or anything else. Range restriction to GPT-4 onwards makes the relative gaps smaller, so any counter-intuitive divergence less apparent: unlike GPT 3→4 ~ 0.5*GPT 4→5, GPT-5 being the midpoint of o3 → GPT-5.2, or o1 the midpoint of GPT-4 → GPT-5 (etc.) provokes a shrug or a squint.
- ^
In slogan form: the discrimination is the ‘unit’ of the ability scale in 1PL/Rasch, so a slope parameter tacitly admits the items are measuring ability with different units, leaving the question open about sampling across them.
- ^
Not quite. As stated, this demonstration would be circular: the Rasch model is ‘validated’ on data we selected to fit it in the first place. But pretend for sake of argument we validate this constructed instrument with something else.
- ^
This is all ad-hoc, but I think a fair prima facie case - and there’s nothing in my file drawer. To list some caveats:
- We could argue over whether the regularized or unregularized figures deserve pride of place (cf. footnote 11): the published ECI index uses regularized figures, but unregularized ones give ‘raw’ data to explore, and regularizing slopes to zero doesn’t make huge amounts of theoretical sense. In any case, regularization only mildly attenuates the picture.
- Raw average on an arbitrary pre/onwards 2024 cut is not a great figure: you might want to weigh benchmarks by how often they are used, compare to other date cuts, perhaps piecewise linear regression, etc. But probably not a horrible illustration of rough effect size, and the scatter plot by date looks clear enough to me.
- On running the ECI repo, some of the benchmarks did not have release dates, so I googled to add them back in. This is likely error prone, and ‘release date’ can be fuzzy (should a ‘v2’ benchmark get a new release date?)
- One test I didn’t do would be refitting ECI on earlier or later subsets of benchmarks, on the rationale making ECI data even sparser/noiser likely ablates any change in trend information even if it happened. “I added a bunch of noise and the finding can no longer be found” doesn’t refute it. Other more sophisticated statistical methods I was either too lazy to discover or too lazy to perform.
The reason this analysis is far from conclusive is it amounts to affirming the consequent. Although this picture fits with axis rotation, it also fits with a straight axis where it so happens the benchmarks got more discriminating but the IRT model correctly absorbs this and still reports the true model capabilities. Or a simpler pure discrimination story: most of the assessments have been done on recent-ish models (~ECI 150), so much easier or harder benchmarks (the former which tended to be released earlier) have lower discriminations because they are stuck near their floor or ceiling, or simply have too little data to fit a curve.
But on the grasping hand, it at least shows the slope parameter is doing a lot of work in the modelling, and the instrument is changing over time/ability range (you generally prefer not to see both large variation and clear trends in your item parameters). Further, the axis rotation story neatly extends to other measurements with the same one-off acceleration, and the face validity (“You start giving reasoning tests to the reasoning models”) is not too shabby either.
- ^
(Owed to Alex Barry) I understand the ECI ignores the vision benchmarks to score models which do not have vision. The human parallel is edifying: in one sense, it is absurd (/suspicious) to set a standard IQ test to a blind person, provide no assistance, score them zero, and report they are mentally handicapped. In another, being able to see is a pervasive pre-requisite for many activities, so the zero score is an honest proxy for a severe disability.
Which is more salient returns to verbal wrangling of ‘what we care about’, with a social model of disability style context dependence. In the paleolithic a blind person might often be the least capable member of their tribe, no matter their other strengths. I hope things have changed since.
- ^
A related ‘hard number’ is effective compute: how many FLOPs a model needs to match performance of an earlier reference models. This is handy for giving ratio scaled comparisons of algo efficiency, but doesn’t help much with the y-axis. Say Claude Cthulhu is 10x more efficient than Mythos, so can match its performance with 10x less compute (collapse the different dimensions of training/inference/whatever for simplicity). Yet it doesn’t follow that with the same amount of compute Cthulhu’s 10x larger effective compute converts to ‘10x more capable than Mythos’ (cf.).
- ^
And, similar to the autopilot/scientific breakthrough example earlier, big leaps in capability could correspond to small increments of error reduction, or vice versa.
- ^
Less basically: unlike ‘standard’ IRT, the ‘item difficulty’ analog (human task length) is being measured directly, so the model ‘ability’ parameter can be fitted directly to known values of ‘difficulty’. The slope parameter (α) is to allow different models to discriminate more or less tightly across items: perhaps model A can do all tasks <1hr, but no tasks >1hr, whilst model B’s success rate degrades smoothly from 10m to 10hr, so model A should get a much steeper curve than B.
Although it appears models discriminate similarly enough that fitting per-model slope parameters might be more trouble than they are worth vs. a single fixed slope for all of them. Even more detail can be found in appendix C.4 of the original Time Horizon paper and Alex Barry’s write-ups. But nothing I say here is sensitive to these details.
- ^
It is strictly sufficient in 1PL/Rasch. The value of ‘almost’ for standard 2PL IRT depends on how uniformly distributed the items are, although things have to get pretty weird for the total score to stop correlating tightly to the latent ability parameter.
That fancier IRT models usually add little beyond simply counting the correct answers in such cases explains why they aren’t routinely used by teachers grading homework, but only when things are indeed pretty weird, or where the stakes of the test are so high to make marginal improvements in resolution worth taking (e.g. nationwide selection).
- ^
“Capability” in terms of the IRT parameter as we saw in IQ tests and the ECI. So all the previous problems still apply.
- ^
For completeness: often the response time literature is also modelling speed-accuracy trade-offs, so individual time-intensity and accuracy enter as two separate variables. But (unsurprisingly) they positively correlate, so we can collapse them to a single variable for our purposes here.
- ^
This story predicts that you should get a range of offset exponential curves when applying the same questions to different baseliner populations: each should still find the hardest ones take ‘exponentially longer’ but you are multiplying or dividing all the values by some factor.
It also implies a further complication given METR’s approach of grabbing baseliners via convenience sampling. As fine-grained ability could substantially vary, different benchmarkers attempting the same task could be estimators of multiples-different true durations relative to each of them (and so biases in which baseliners with which relative ability levels attempt which tasks - cf. incentivization - could add weird directional effects as well as lots of log-distributed noise).
Although I think this hits the absolute y-axis values badly, it probably doesn’t matter much for the general curve. Your population of baseliners has some (albeit noisy) ‘average overall ability’, so keeping the tasks the same but changing the baseliner ability for those tasks should shift measured duration up and down by (also noisily) a constant multiple. This is loosely analogous to the shifts resulting from ‘50% vs. 80% (or 99%?)’ success.
Another prediction, although likely overdetermined, is trying to vertically scale the existing time horizons work upwards given heterogeneous baseliner variation for the ‘new’ items vs. the ‘old’ ones will prove fiendish.
- ^
If the exponential has a doubling time of 6m, t-7 months → t is a bigger leap on the y axis than dawn of time → t-7 months, for all past present and future t.
- ^
Outside of METR and AI futures for time horizon, you also see a similar tactic of 'set a threshold value for the measurement, then extrapolate the trend up to it' for (effective/) compute (e.g. Cotra, Davidson, Aschenbrenner).
This is fine in itself, but it doesn't sidestep external validity - although it may obfuscate it. The essential (dare I say 'load bearing') link to what we care about is being made by the threshold of (e.g.) X FLOPs or Y TH = transformation. "We're just extrapolating the trend in its own terms (with assessment of whether it really means anything postponed to an out-of-sample future juncture)" can be a bit too convenient. - ^
Strictly, you can fiddle the offset to avoid the odd ratios/comparisons to nothing problems, but I assume this isn’t more palatable if we go back and change any ‘0’s to ‘GPT-2’ (or GPT-3, or wherever you want to start) etc.
- ^
Slope steepness has more dramatic effects on further percentiles (80%, 99%, whatever else) - in this case, the steeper slope gives Opus a lower 50% horizon but a higher 80% one. Cf. link functions and tail behaviour earlier in the show.
But this doesn’t make it benign: the logistic curve is (rotationally) symmetrical around 50%, so moves in the midpoint are expressions of overall ‘task completion ability’. That a model could be assessed as less able for more reliably completing short tasks is not great.
- ^
As a lagging indicator, this may not be much use for early warning. But we can extrapolate trends in these indicators - obviously treacherous, but not obvious the same exercise for other AI metrics is less so. And if, after a while, we struggle to find any macroeconomic trend to extrapolate, perhaps that is a signal too.
- ^
So, strictly speaking, our intuitions identify the interval structure of ‘true capability’ better than ‘arbitrary monotonic transformation’. AI capability is closer to linear in (say) ECI than ECI^250, log(log(log(ECI))), etc.
But I can have it both ways: we can see AI capability is closer to linear in X than some chosen-for-absurdity monotonic transformation of X, but also see, in absolute terms, it is nowhere close to linear in X. The bar for useful intervals is all-but-identification, not barely-better-than-nothing.
- ^
This can recapitulate all the main measurement problems in miniature. For although our heads can manage US → NK > Iceland → US wrt democracy, we start to struggle with:
- Fine structure/lots of similar small gaps to compare: try ordering the absolute differences in democracy between (say) the UK and Norway/Denmark/Germany/Austria/France?
- Broad contours/large leaps: Which is bigger, China → Turkey or Turkey → Norway?
- Residual multidimensionality/’off axis’ comparisons: Singapore vs. Serbia (or Saudi Arabia vs. Somalia) fall short of the democratic ideal in very different ways. Which of each is more democratic overall?
- ^
Needless to say measures of democracy are extremely difficult to make (q.v.), so any suggestions from their numbers are very tentative. I mention it as illustration, but I’ll also pre-empt the “But you’ve conceded we can use the numbers literally as some evidence about democracy - so what’s the problem with people doing the same thing for AI capabilities?” objection.
- ‘Spectrum’ vs. ‘Stage’ was chosen with care as you only need an ordered metric rather than interval scale: we can do a democracy tier list without saying S → A is 2x B → C.
- Unsurprisingly, the typical use for these measures is for rough ordering and categorization, and analogous-to-AI velocity/ratio/curvature claims are avoided. Our World in Data’s democracy section has many indices which you could take velocities or ratios of, but its discussion instead collapses them into ordinal scales: loose categorization by ranking, ‘getting better or getting worse’, etc.
- One could press that numbers offer some small Bayesian evidence to take them literally in terms of intervals and ratios. So this graph tentatively suggests recent democratic backsliding in the US has made it ~15% less democratic overall, and the effect size (0.1) roughly similar to the jump corresponding to women’s suffrage in 1920. Fair enough. But tentative suggestions can be declined (I think most would find “15% less democratic” vaguely credible; but “Trump’s second term has been as bad for US democracy as women getting the vote was good for it” clearly absurd). They also should be made tentatively, rather than “AI is hitting the wall”/”AI is exponential” stated baldly, +/- a pet graph pasted below as a proof text.
Denis @ 2026-08-08T18:02 (+11)
Very provocative post. A few minor comments, not criticisms!
- Maybe some of your reference cases are more complex than you imagine. Temperature, for example, is not trivial. Depending how you measure it (ideal gas vs electrical conductivity), you get two aifferent seemingly linear scales that agree only at the two points where you force agreement (e.g. Oc and 100C). But also even using Kelvin, it's not at all obvious that this is the correct linear scale to use. Maybe the true scale is exponential or logarithmic relative to this: (e.g. one could argue that the differencebetween 10 K and 100 K is the same as that between 100 K and 1000 K ... or you could argue (if you're a chemist, that in the correct scale 300 k is 2x 290 K which is 2x 280 K ...). Today, after mant years, we have a settled system, but it doesn't mean anything - anybody working with quantum computers will know that one degree close to 0K is a lot more "difficult" than going from 285 to 284 K, while maybe cosmologists use phrases like "10's of millions of degrees" where Celsius and Kelvin are basically the same, and only worry if the temperature changes by a million degrees ...
- All this to point out that the question of measurement is rarely trivial once you get past counting things!
- What people do in science and engineering is to make two lists:
- what are the tangible outcomes we need? (e.g. what is the cost per kJ of energy delivered to a home? ...)
- what are the physical, tangible measures we can make? (e.g. how many kg of fuel did we use? what temperature was reached? what was the % completeness of the reaction? ...)
- And then, they try to build a model in which the available data will predict the desired output. Sometimes it's possible, but usually it requires a lot of assumptions, which need to be tested and validated continuously.
- They always also keep in mind that all models are wrong, but some are useful, and constantly re-check if their model is useful and remind themselves of the ways it is wrong, especially if applied in and area it wasn't intended for.
- In this context, IMHO asking how capable an AI is is just far too difficult and too broad. To use your football analogy, Messi might be better than anyone in the world at scoring with his left foot, but there are guys on my amateur team who would be better at defending a corner than he would.
- What's most realistic is to ask more granular questions (e.g. likelihood to enable a bioterrorist to produce a new virus, likelihood to successfully complete a problem that takes a skilled human 1 week, ... ), and then look at more tangible ways to test exactly that. Which of course is what AI Safety labs do. Just as IQ is meaningful but flawed, any measure of general capability will be flawed.
All this was a long-winded way of saying that yours is a great analysis and a valuable contribution, but that with the right mentality, people have found ways to measure and predict in complex situations before. It feels that AI is another level of complexity, but the principles that give us the most insight do not change.
Buck @ 2026-08-09T01:02 (+10)
Thanks for this post. For the record, basically everyone who works on the metrics you're talking about agrees with you on this.
I agree that "revenue" is a pretty nice number. Notably, this metric predicts that Anthropic will have revenue equal to the rest of gross world product in ~three years.
Vasco Grilo🔸 @ 2026-08-10T14:37 (+4)
Hi Gregory. Great post.
I mentioned before that IRT is basically an Elo for the game of responding correctly to benchmark questions. For Elo, here’s the win probability of player A vs. player B, given respective strengths Sa and Sb:
P(A wins) = 1 / [1 + 10^((Sb - Sa)/400)]
Nitpick. I think the above is the probability of winning plus half of the probability of drawing.
Gregory Lewis🔸 @ 2026-08-11T11:29 (+4)
Thanks Vasco, and you are right. How Elo and related systems 'manage' draws/partial credit is something I didn't explore, but as you say the commonest approach is to set 'draw' at 0.5. The equation above is still true for games which only have wins or losses (so P(A draws) = 0).
Charlie_Guthmann @ 2026-08-04T19:00 (+4)
Some musings on meta science here, kind of tangential and half baked. capabilities is a function of intelligence only once you pick a specific technology and you fix a utility function over the tech, otherwise it's not well defined.
I haven't done formal probability in long enough to have the exact words, but essentially you can think of building a technology as a markov chain of decisions. Both the path you take and the chance of success at each path are (partly) a function of your (intelligence). Capabilities is taking a utility function defined over the tech tree and multiplying it by the current probabilities/expected number of steps to different parts of the tree.
imagine you are trying to build a spear. You have 2 choices of sticks, 2 binding agents (glue or chords), 2 choices of stones, and only 1 of each choice is going to work. I guess you can think of this in p or bits but essentially you have 1/8. chance of a random walk working, given we fix p(success per task) at 100% for simplicity (https://metr.org/blog/2025-03-19-measuring-ai-ability-to-complete-long-tasks/ also it already has its own discussion).
Ok so the maximum intelligence in any situation is getting to the absorbing node/final tech in the minimum number of steps (with 100% chance). For any specific technology there does exist some (not necc unique) pathway s.t. there does not exist any other pathway with less (difficulty weighted) steps. So capability is always bounded on a specific tech.
The divergence (ratio of difficulty weighted steps) between the random walk and the correct path is basically the amount of juice on that tech intelligence can give you. This is basically unbounded in theory. Also p(success per task) might be a function of the same underlying architecture as p(correct path taken at node n) idk.
Now multiply a utility function over the tech tree. The increase of capabilities is the delta in utility per step between the two intelligences.
It also gets much more complicated in reality. Paths can be self correcting if when the agent goes down a wrong path there is some probability > 0 that they can realize this, which depends both on the intelligence of the agent and the nodes in the tech path itself. Similarly, some paths are smooth and monotonic among all the reasonable choices and others will punish greedy algorithms. but I think the core intuition is what I said earlier.
Charlie Harrison @ 2026-08-26T09:30 (+3)
Gregory -- thank you for the interesting post. I admit I have *read most of it twice and not fully understood. May I ask two clarifying questions? Specifically on ECI.
First: you say link function choice is "relatively minor" (rank and ECI correlate ~0.97), but you also raise an endogeneity point, which "entirely relies on the link function." I think the first claim holds link functions vary, shared-shape assumption stays fixed; the second is about dropping the shared-shape assumption itself. You say a shared-shape assumption is "dubious" but I'm unsure what your reasons are?
Second: I'm wondering what the empirical test(s) is for your critiques. In general, if you think measures of capabilities are not robust in some way, what is the sensitivity analysis? I am thinking like an economist here.
One idea -- refit ECI under different (common) link functions, see if the "speeding up" trend survives. I don't think Epoch runs this, though their appendix comes close, although I don't think this would be a crux for you.
Two other ideas that came to mind, specifically on 'measure endogeneity':
- Fit using only benchmarks that predate the model being scored.
- Let discrimination depend on whether the benchmark came before or after the model.
Would you find these interesting or cruxy?
Thanks, Charlie
Gregory Lewis🔸 @ 2026-09-04T07:05 (+7)
Hello Charlie,
Thanks for your reply, and apologies my OP was unclear. Hopefully I do better here.
1) Your distinction between "there is a shared shape across all link functions" and "which shape across all the link functions" is correct.
Re 'which shape?': if you switch from a logistic curve to clipped linear one (or, I expect, most/all reasonable alternatives) you likely twiddle the exact values and rankings, but the broad order and ~linearly-increasing-over-time sweep of the data should remain much the same. Very loosely, even if the tick-marks on your ruler are all over the place, longer distances measured by multiple rulers laid end to end will still be in the right ballpark.
Re. 'shared shape': But you need to assert all the items/benchmarks have identical shape to resolve a single interval scale across them (very loosely again: that all the rulers laid end to end have the same length). Perhaps one way of understanding this goes back to the 'endogeneity graph':
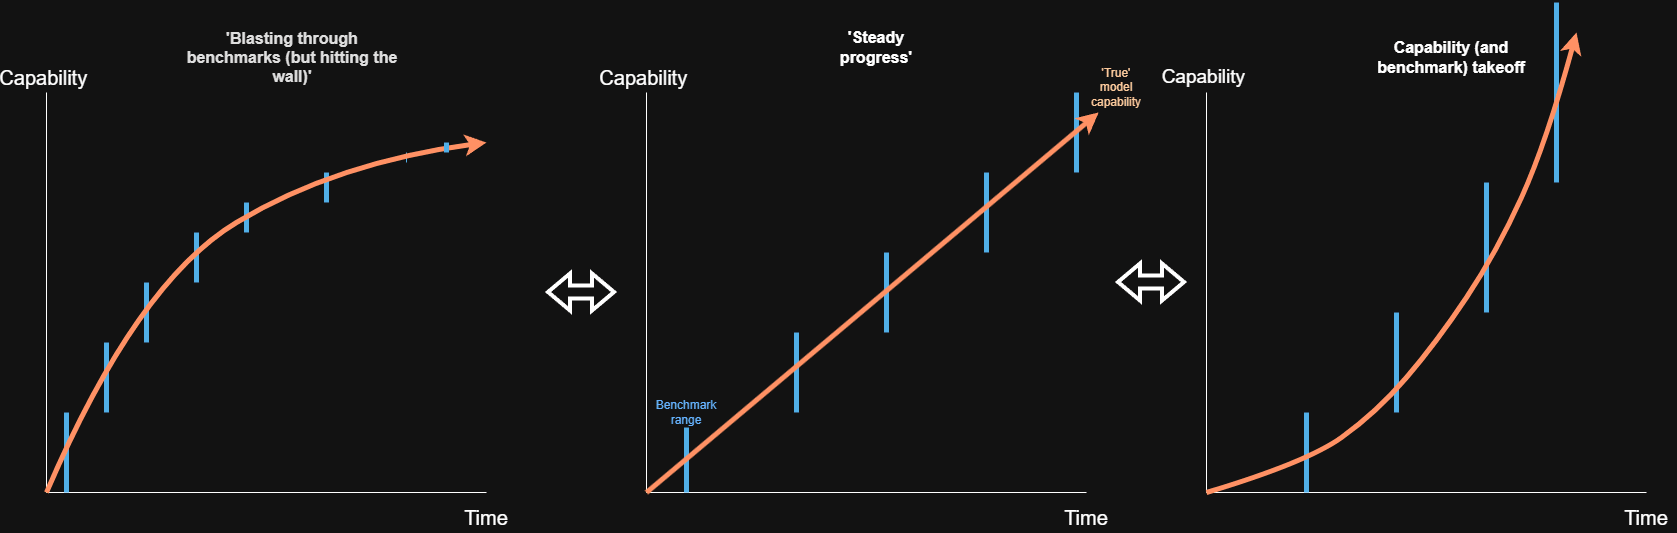
Handwaving: one way you could move from the middle panel to either of ones flanking it is to assert the y-axis should be re-parameterized: "True capability is really exponential/logarithmic in the ECI capability trait value". Yet (loosely) you could bake the same transformation into the capability trait itself, by stipulating a progressive warp of link functions across benchmarks as they increase in difficulty.
For 'why doubt shared shape?', I think there's a fair case for brute incredulity: why should benchmarks for (e.g.) chess puzzles, science questions, verbal reasoning, (log) time horizons for coding tasks (etc.) all share the same relationship between score progress and general capability? Empirically, browsing some of the 'benchmark score vs. ECI plots' on Epoch's website shows some look more or less S-curvy than others, and the data too noisy and sparse (and likely reliant on tail behaviour) to uniquely identify an logistic curve versus others that look similar.
2) My broad criticisms draw on ~fundamental limitations to IRT or underspecification/ambiguity around 'AI capability' - in either case, I don't think there's a crisp statistical test or methodological fix. Although I think this covers the endogeneity worry in general (it seems hard for the data alone to distinguish methodological distortion from secular trend), trying to pin down particular niggles is handy in its own right, and offers a gesture at the broader complaint: if the 'just read the number straightforwardly' gets the right answer and my metrological quibbling just chases shadows, so much the worse for me - and vice versa.
Your suggestions could be worth doing, although I think the results would only be cruxy in one direction. On my end, I'd guess the speeding up result is robust to link function choice, and would only mildly attenuate if you restrict to pre-model benchmarks (or somehow upweight them relative to post-model benchmarks) - i.e. I wouldn't take positive results as confirmatory proof. Yet if you found (e.g.) speeding up is sensitive to link function choice, that seems much stronger negative evidence.
Some further ideas, although I'm not sure they're worth much:
- I understand there's 'quasi-parametric' IRT which lets you twiddle the link functions - and anyway you could play with simulation data to see how shape-sensitive the results are. By and large, the response curves of the benchmarks certainly tend to be S-shaped, so (e.g.) "But if you only tweak the s-curves slightly between benchmarks you can generate huge de/accelerations" vs. "To ablate results like this you need to stipulate hugely warps which we don't actually see in the data" could be informative.
- I guess all of this will be confounded by reducing power (see fn. 17), but besides testing on earlier or later subsets, you could try and curate an equal discrimination set of benchmarks across the range, or narrow the set to those which bracket the trend break in 2024.
- One could review all the benchmarks, and subjectively score them by how 'reasoning-y/multistep' each is, then somehow reweigh/compare classes to see if it lines up (i.e. do the benchmarks get more reasoning-y over time? Does this correspond to benchmark discrimination? If we somehow 'correct', does the trend break vanish). But even if so (and going back to the problem where external validity is up for grabs), it doesn't seem crazy to assert that "true/important" capabilities do load more heavily on reasoning at you go up the range, so even if the benchmark measurement axis is rotating, this rotation keeps it parallel to the 'true capability' axis.
NickLaing @ 2026-08-06T16:48 (+3)
I couldn't see it there on first glance, but I suspect @Gregory Lewis🔸 this would go down well and stimulate more conversation on the dark side.
I mean the LessWrong forum.
Gregory Lewis🔸 @ 2026-08-06T19:51 (+2)
I did cross-post, although perhaps I flubbed it given in languishes in relative obscurity...
Jeff Caruso @ 2026-08-08T15:46 (+1)
The "dark side" is a perfect descriptor for the LW forum. :-D
Sharmake @ 2026-08-04T17:56 (+3)
At least re the Epoch ECI vs METR's time horizons, I'm pretty certain they're expressing the same thing, but in different units, and linear ELO/ECI progress in a Bradley-Terry model is exactly the same as exponential improvements.
I haven't read much of the rest of the article, so I can't decide whether it's right, but I do think that there is likely a mistake in differentiating the progress rates based on ECI vs Time Horizons.
Karthik Tadepalli @ 2026-08-04T17:41 (+1)
The best and scariest post I've read on the forum in a long long time. Incredible work
NickLaing @ 2026-08-05T06:31 (+18)
I agree its great, why do you think it is scary in particular?