EA Survey 2024: Demographics
By Willem Sleegers, David_Moss @ 2025-02-28T10:39 (+92)
Summary
In this post we report results about the demographics of the EA community from the latest EA Survey.
Most results remain similar to previous years, with a majority of respondents identifying as men and having a White racial/ethnic identity. A large percentage of participants have attended top universities. And, politically, respondents remain largely left-leaning, though we note an increase in center-left respondents compared to previous years. Also, the average age of the community continues to increase, which may be related to seeing fewer students and more respondents currently being employed.
In addition to these demographics, we also report on the respondent’s career strategies. A larger percentage of respondents reported relying on earning to give compared to the previous survey. This year's post also includes new results on respondents' main approach to doing good, as well as their diet, which was last asked about in 2019.
The main findings are:
- Gender
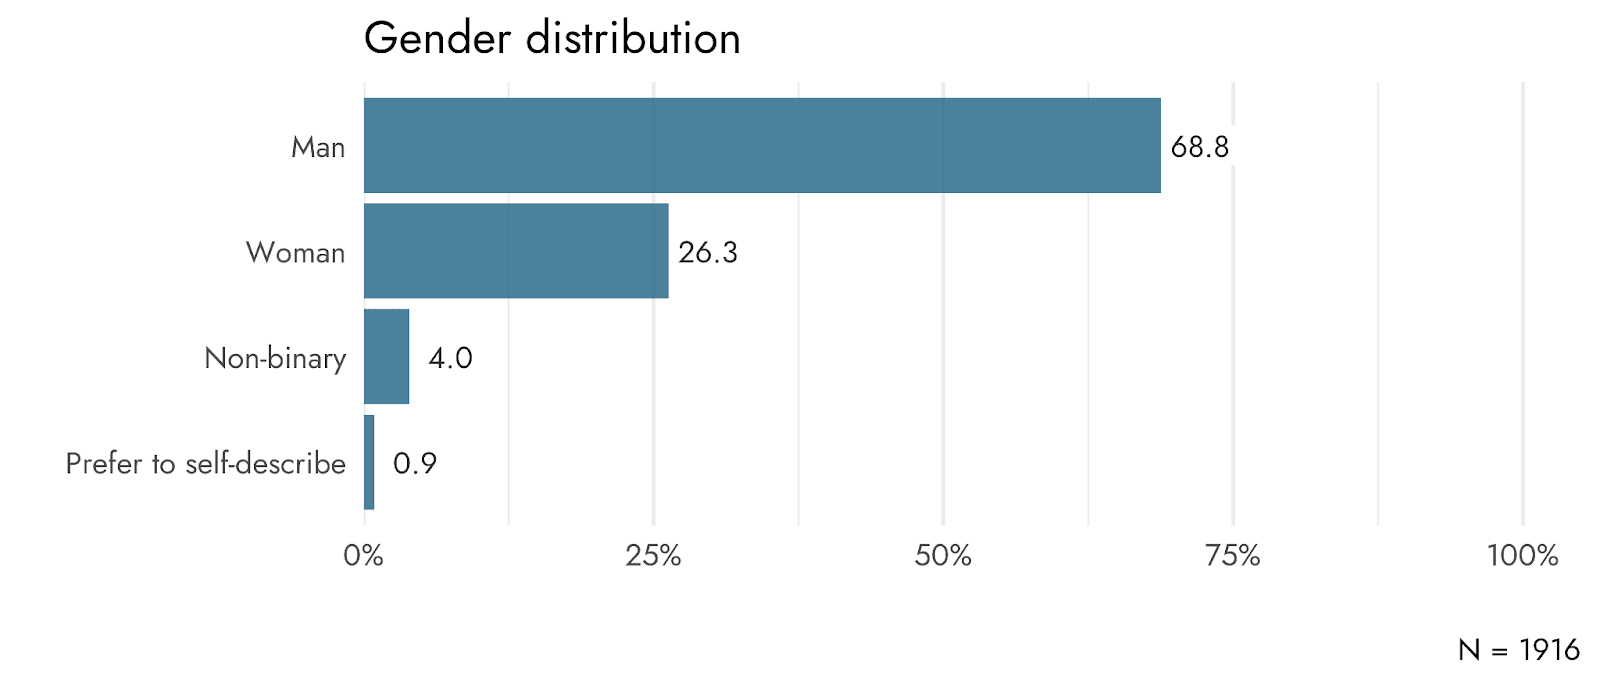
- Men make up a large portion of the EA Survey respondents (68.8%), followed by women (26.3%), non-binary respondents (4%), and respondents who preferred to self-describe (0.9%).
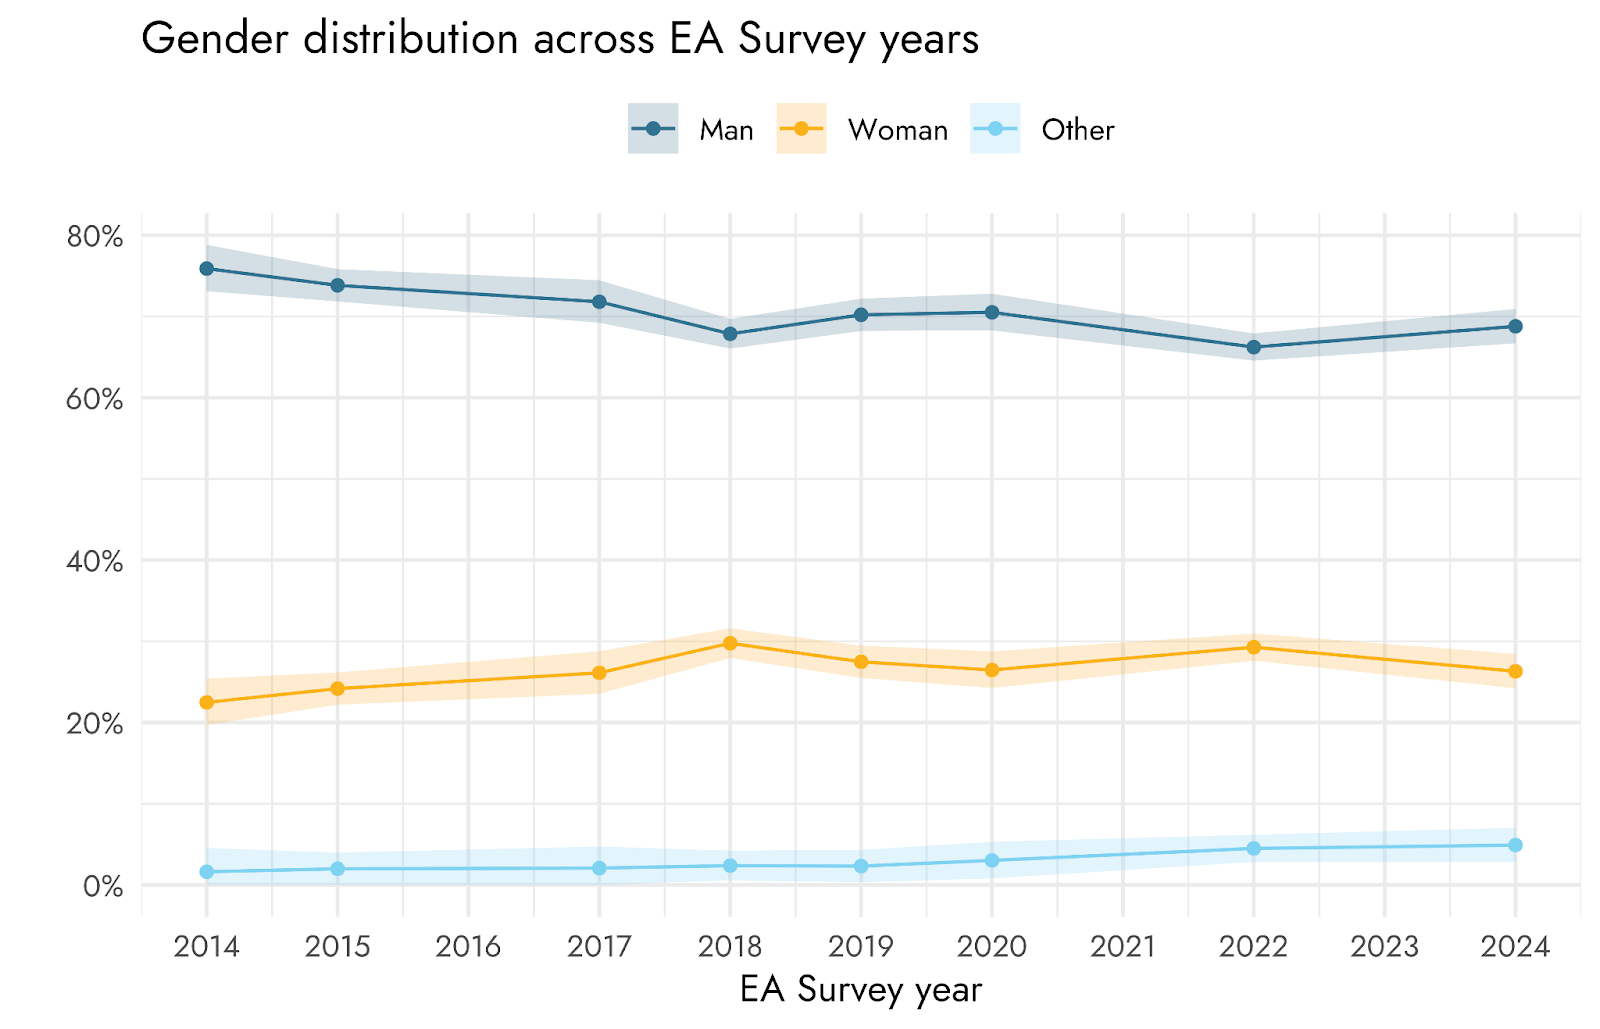
- There have been minor fluctuations in the percentage of men and women over the years, with the most recent change (since 2022) indicating a small decrease in the number of women (from 29.3% to 26.3%) and small increase of men (from 66.2% to 68.8%)
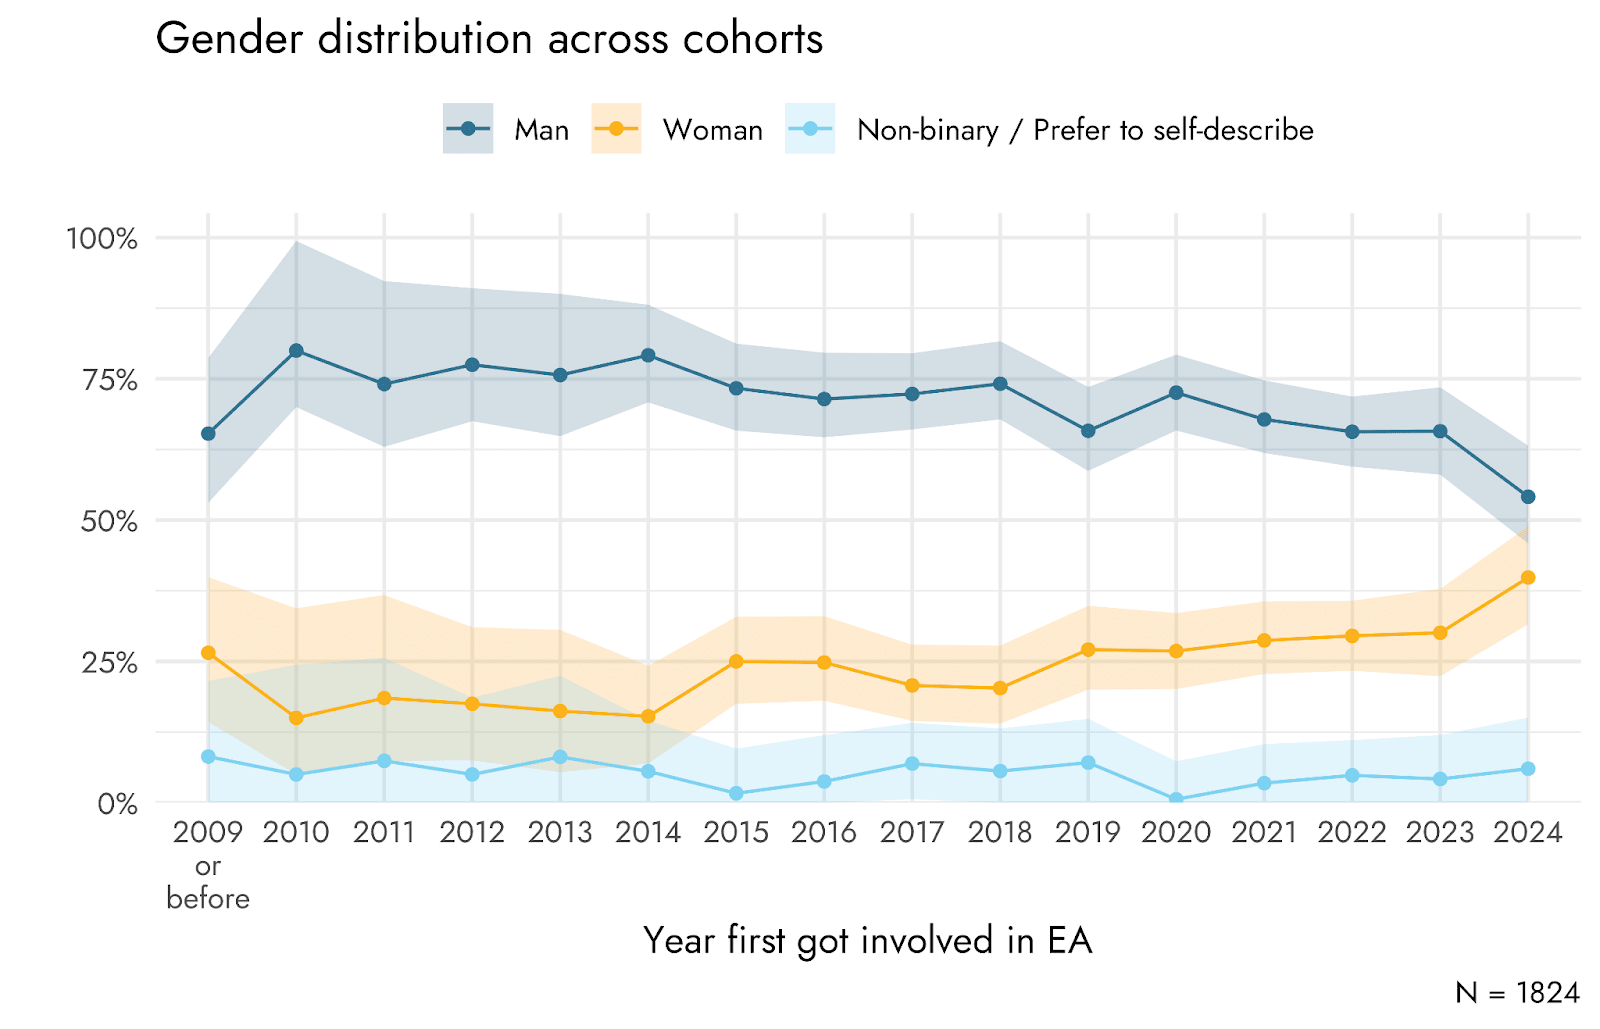
- More recent cohorts of EAs (as indicated by the year they first got involved in EA) have lower percentages of men and higher percentages of women than earlier cohorts
- Racial/ethnic identity
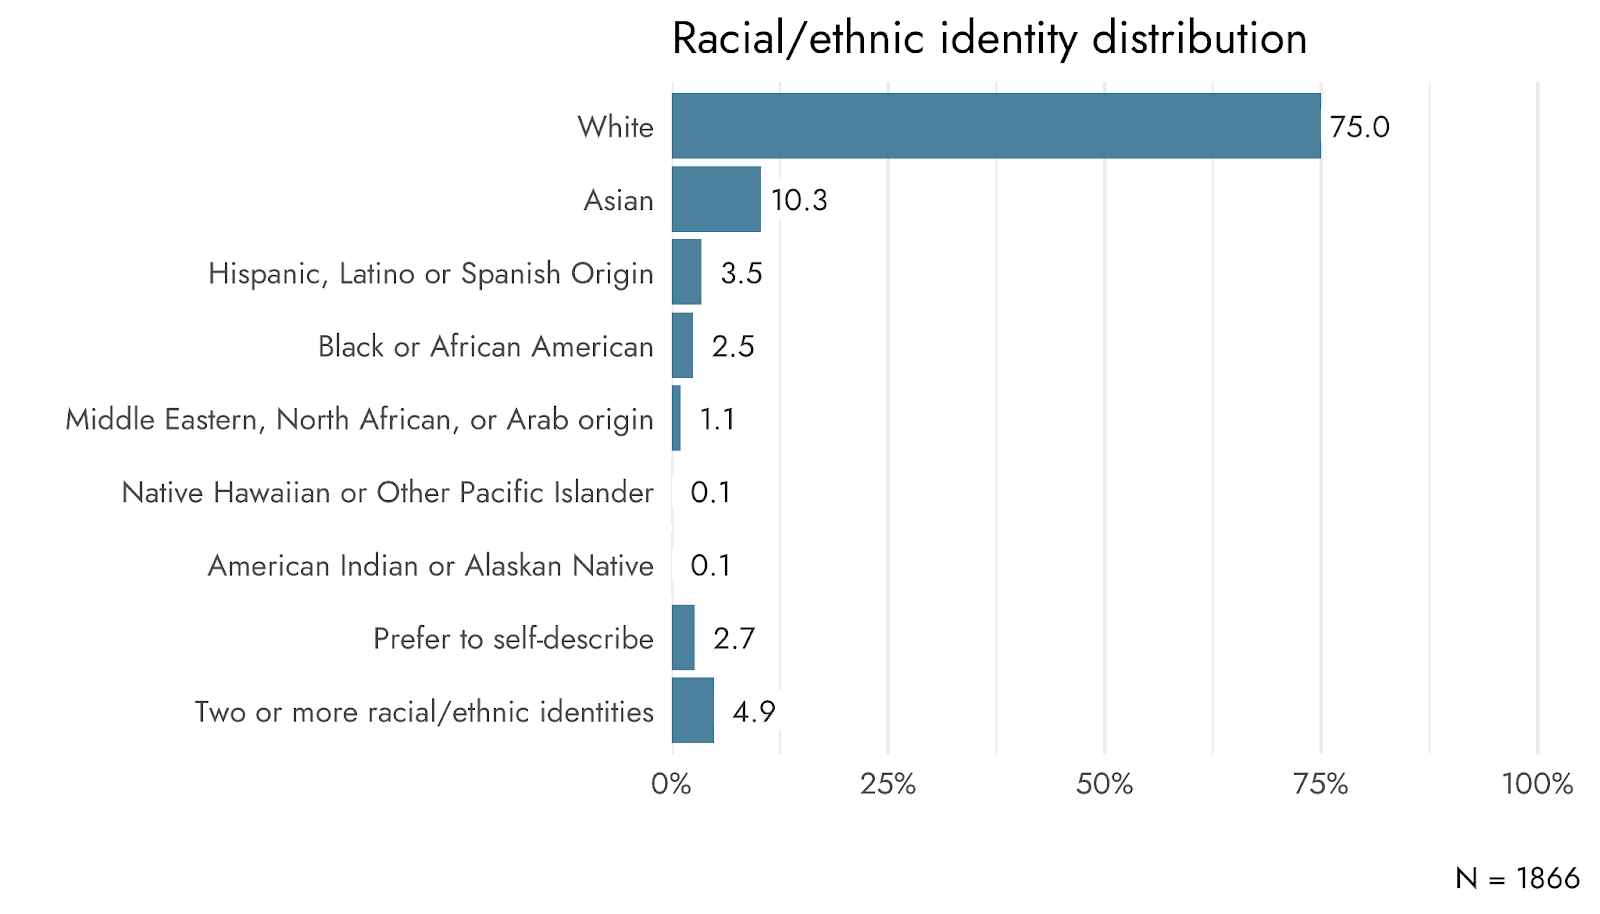
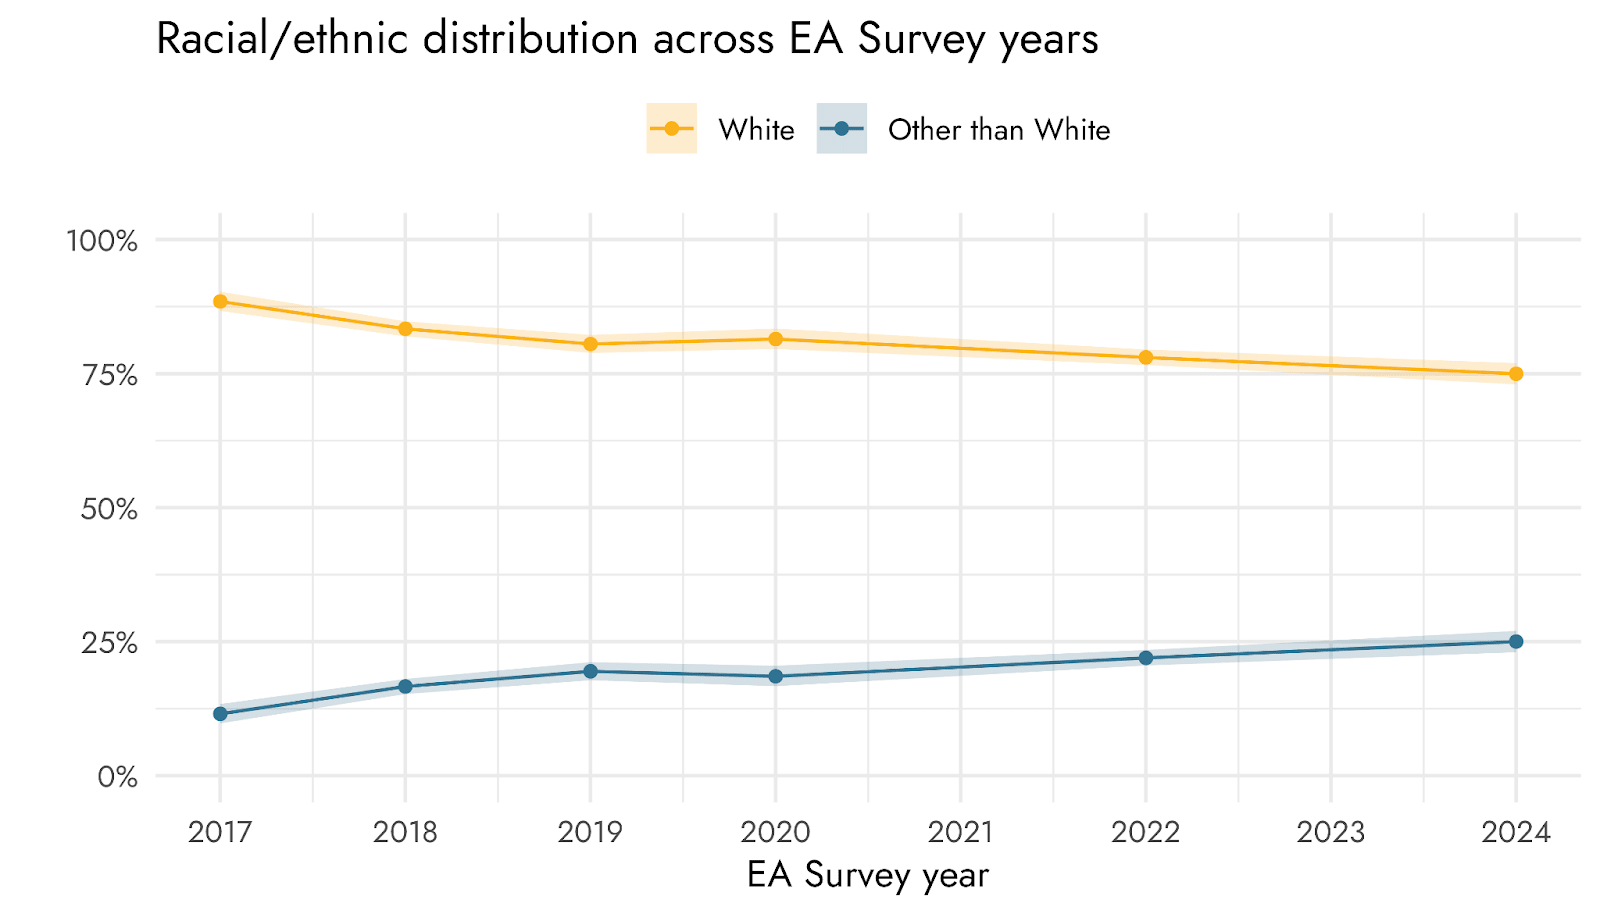
- The majority (75%) of respondents reported having a White racial/ethnic identity
- The proportion of White respondents has remained fairly flat over time, with signs of a small decrease
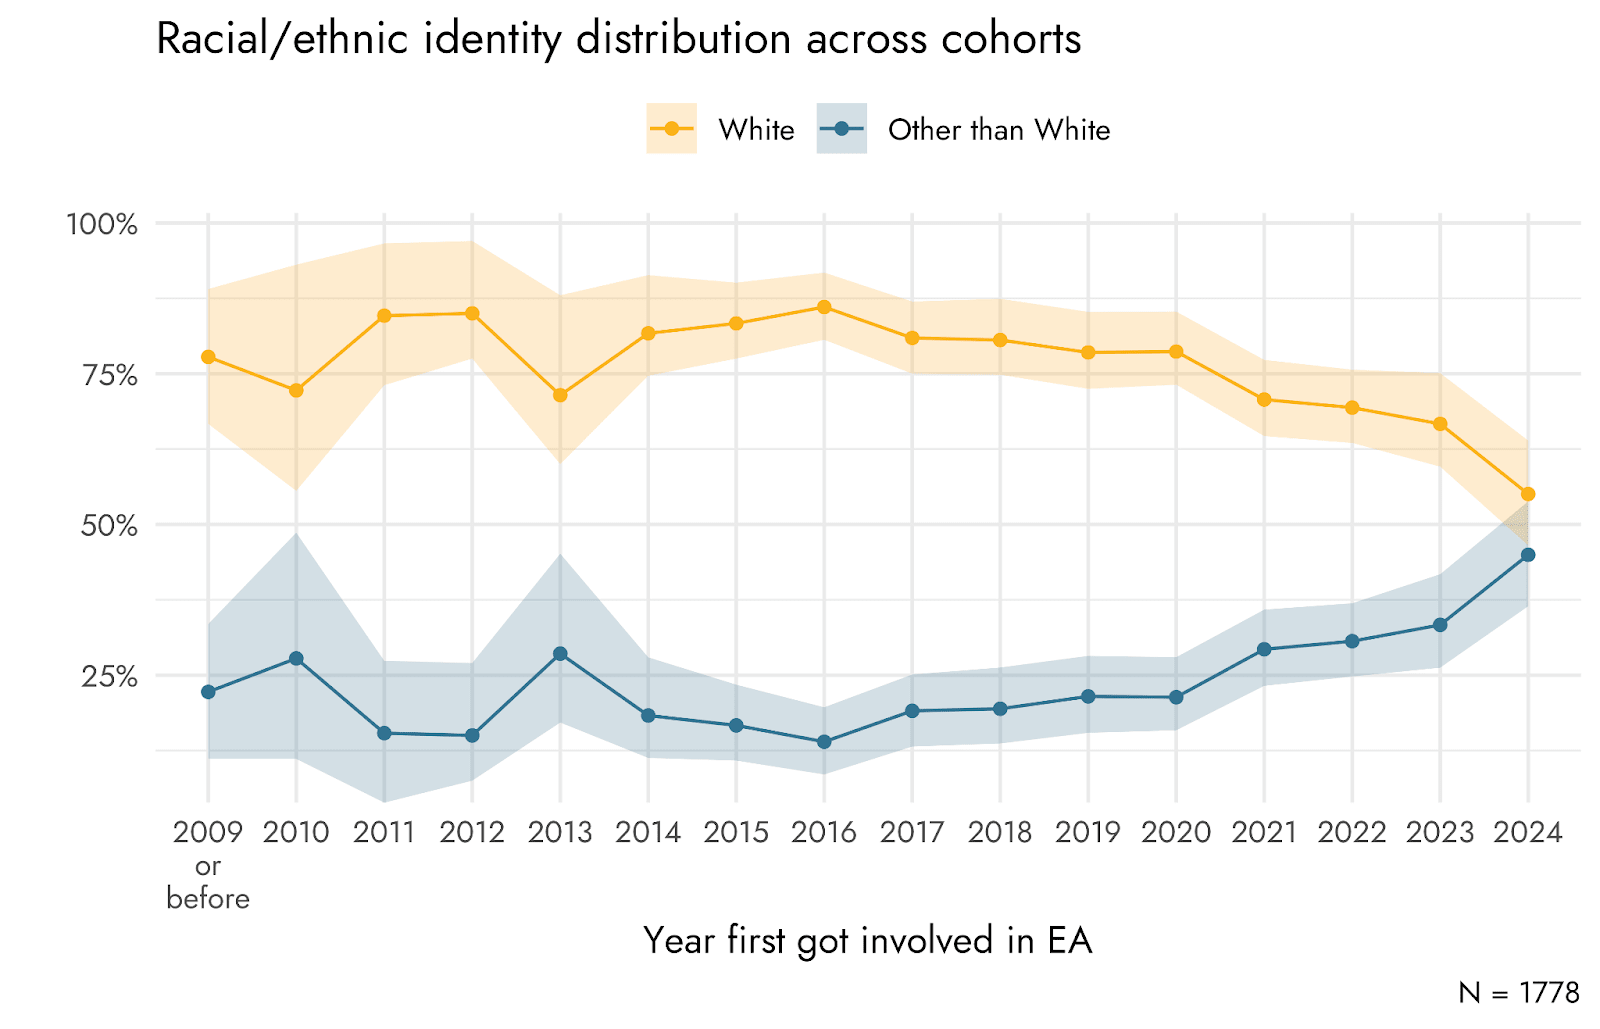
- More recent cohorts contain lower percentages of White respondents
- Age
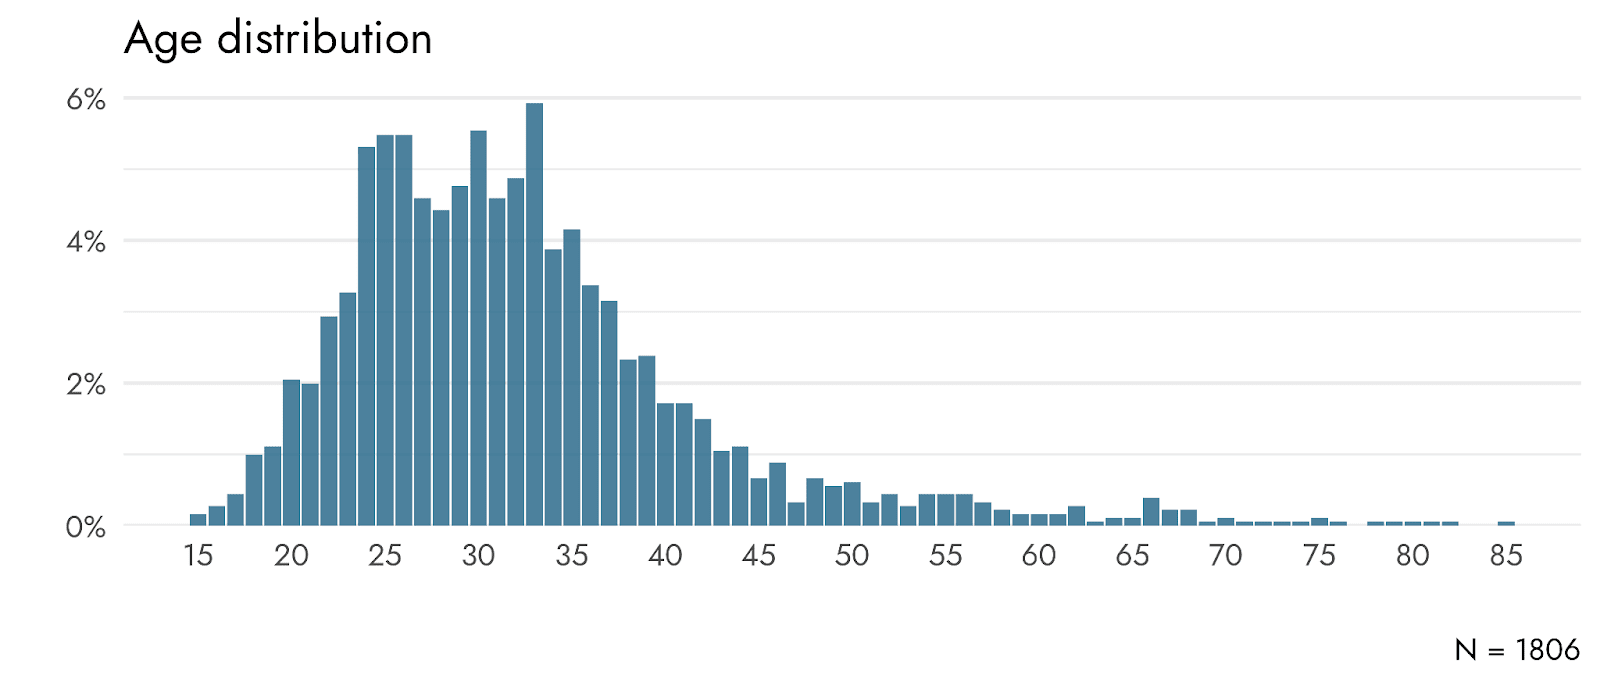
- The average age of respondents was 32.4 with a median age of 31
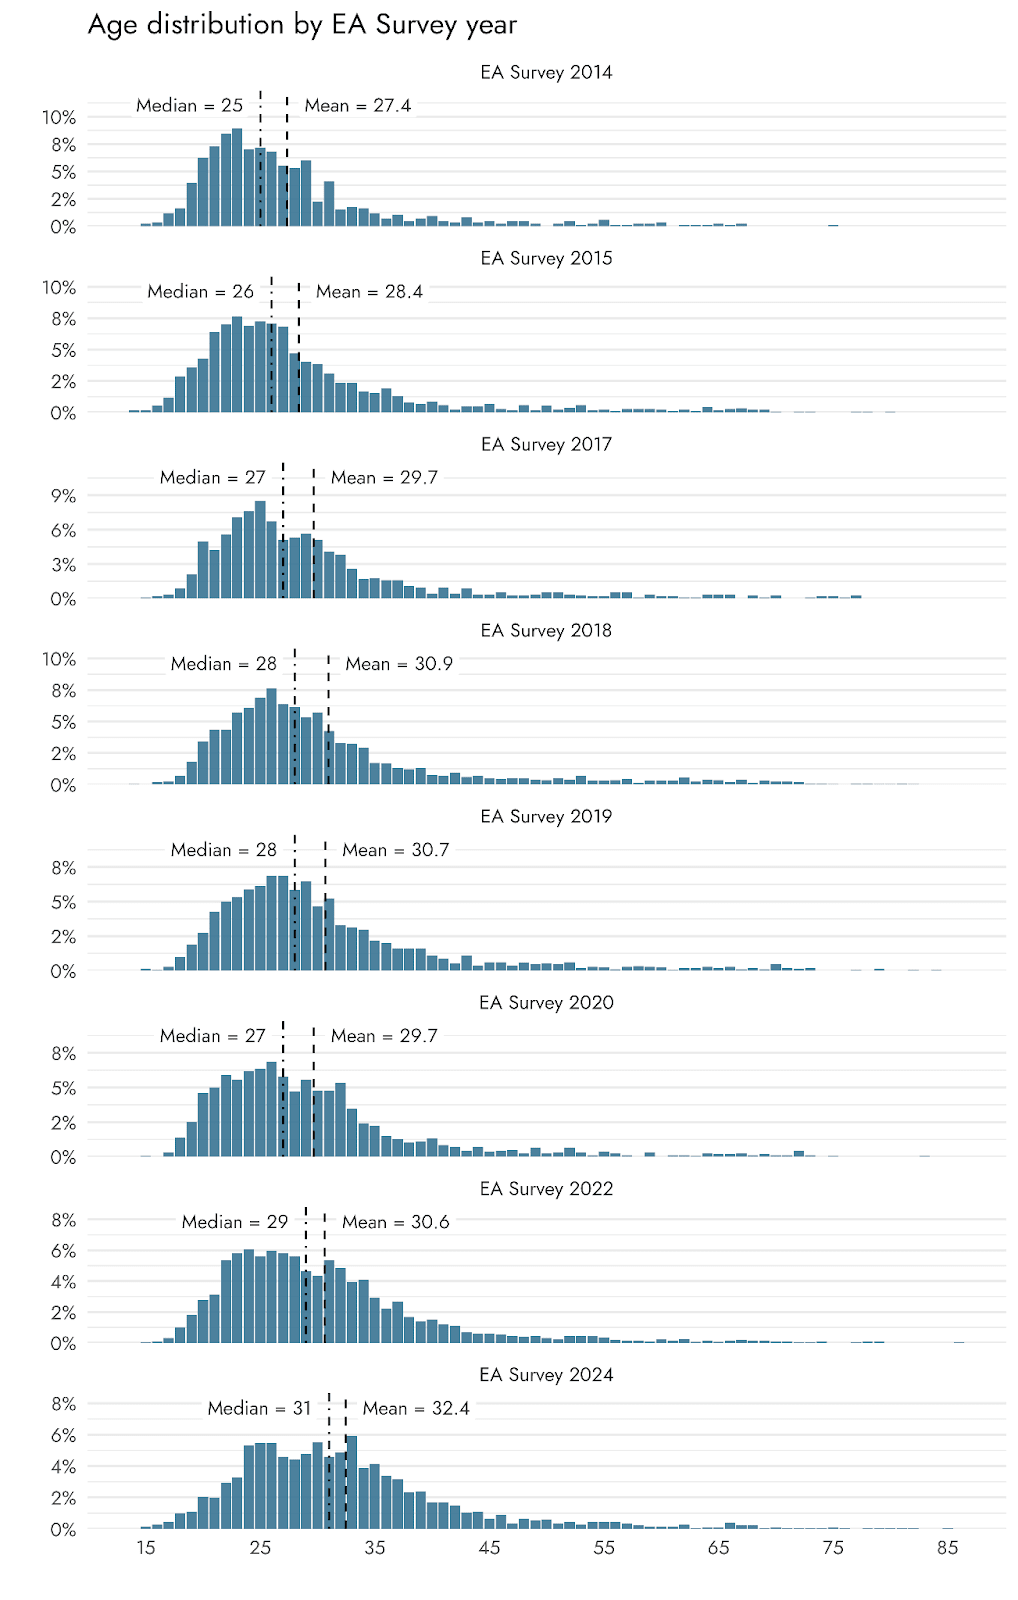
- We find a steady increase in the average and median age across EA Survey years
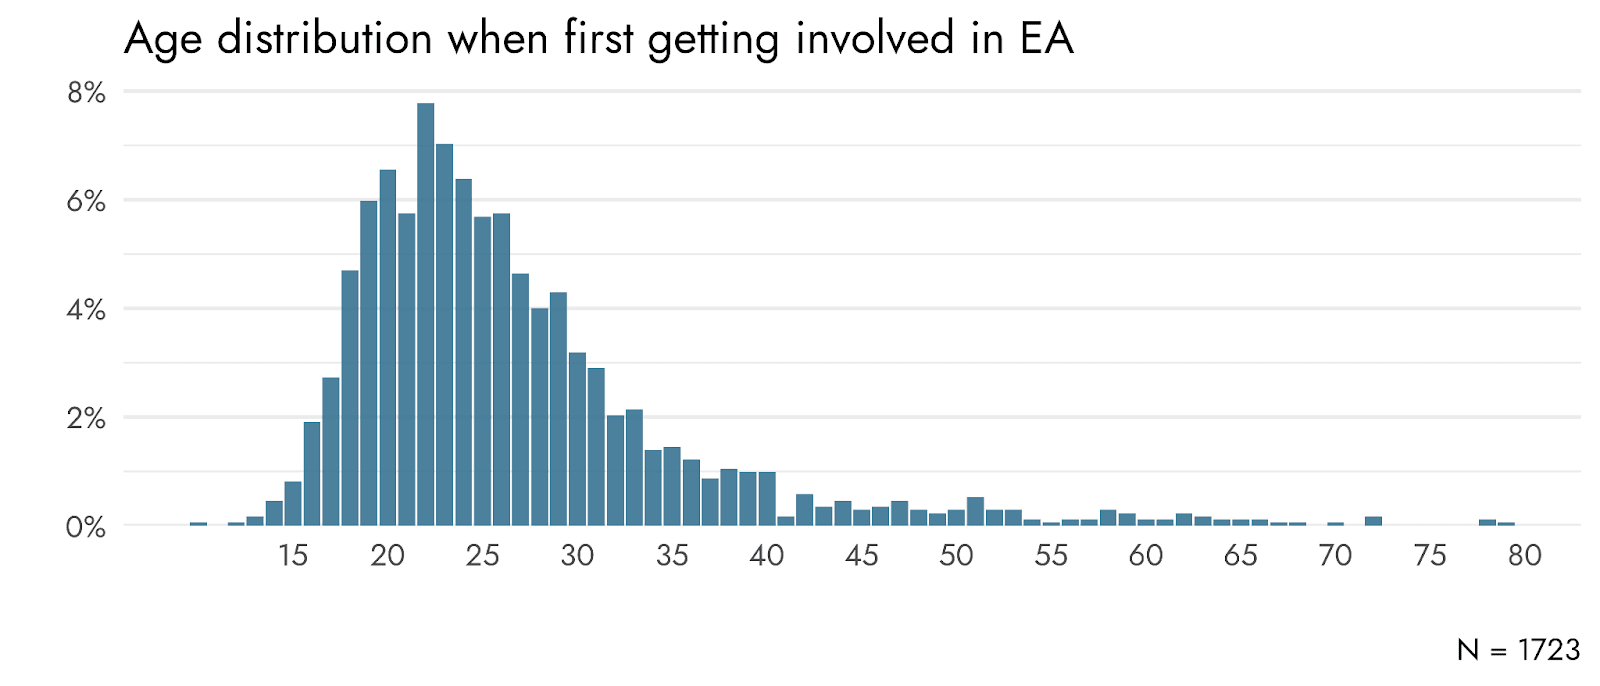
- The average age when respondents reported first getting involved in EA was 26.7 with a median age of 24
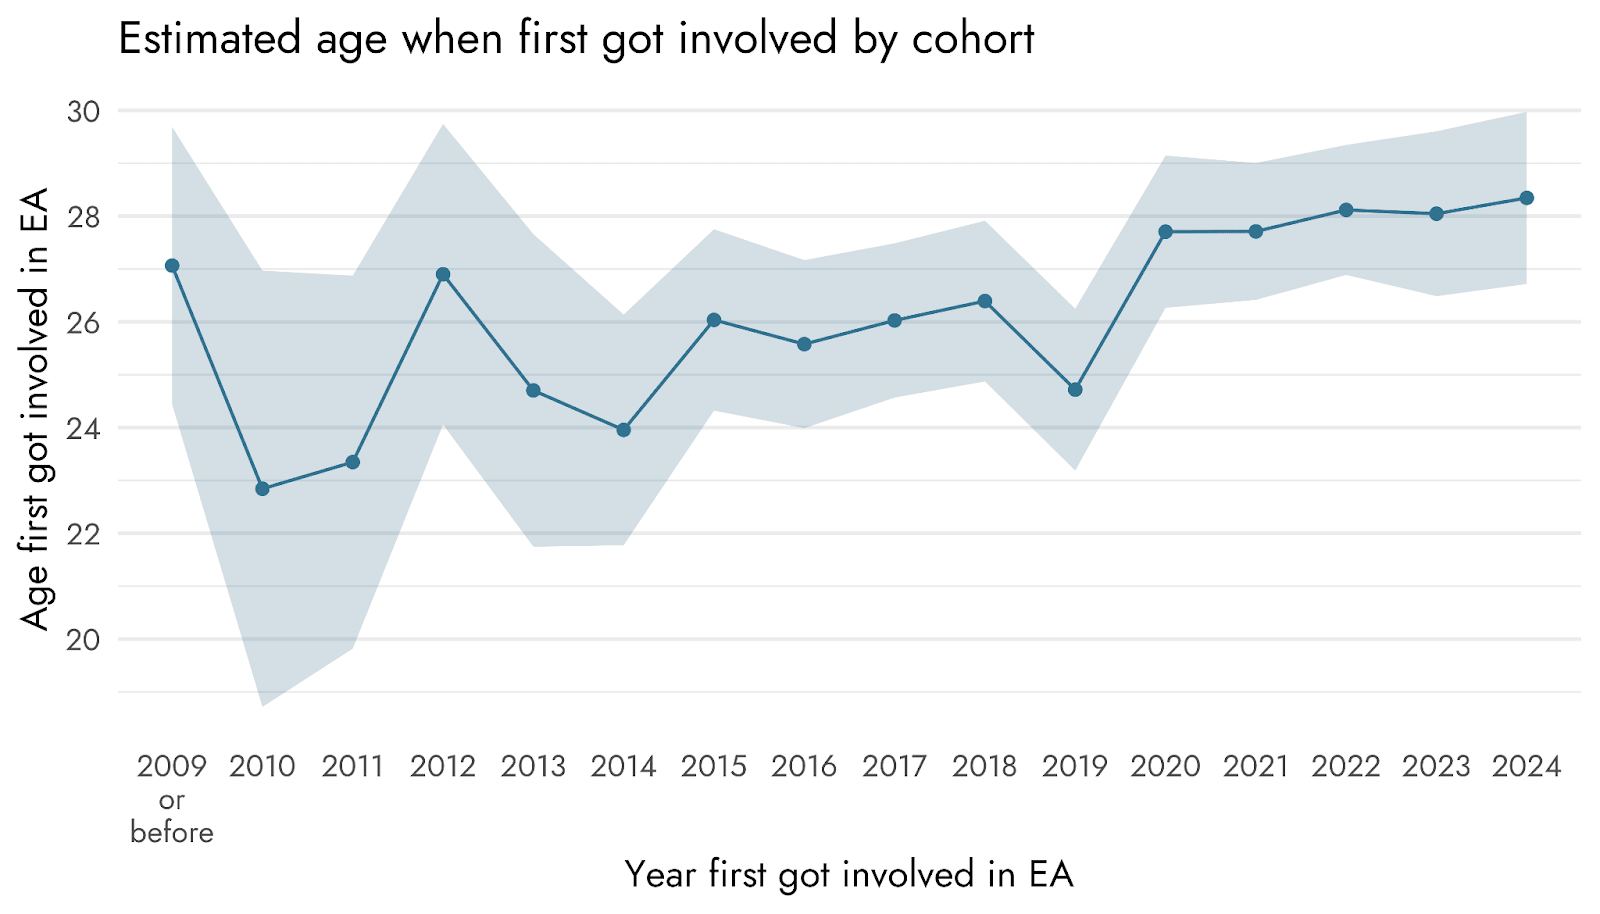
- The average age when respondents first get involved in EA is higher in more recent cohorts (~28 years) compared to the oldest cohorts (~25 years)
- The average age of respondents was 32.4 with a median age of 31
- Education and employment
- Almost a quarter of the respondents (23.3%) reported being a student
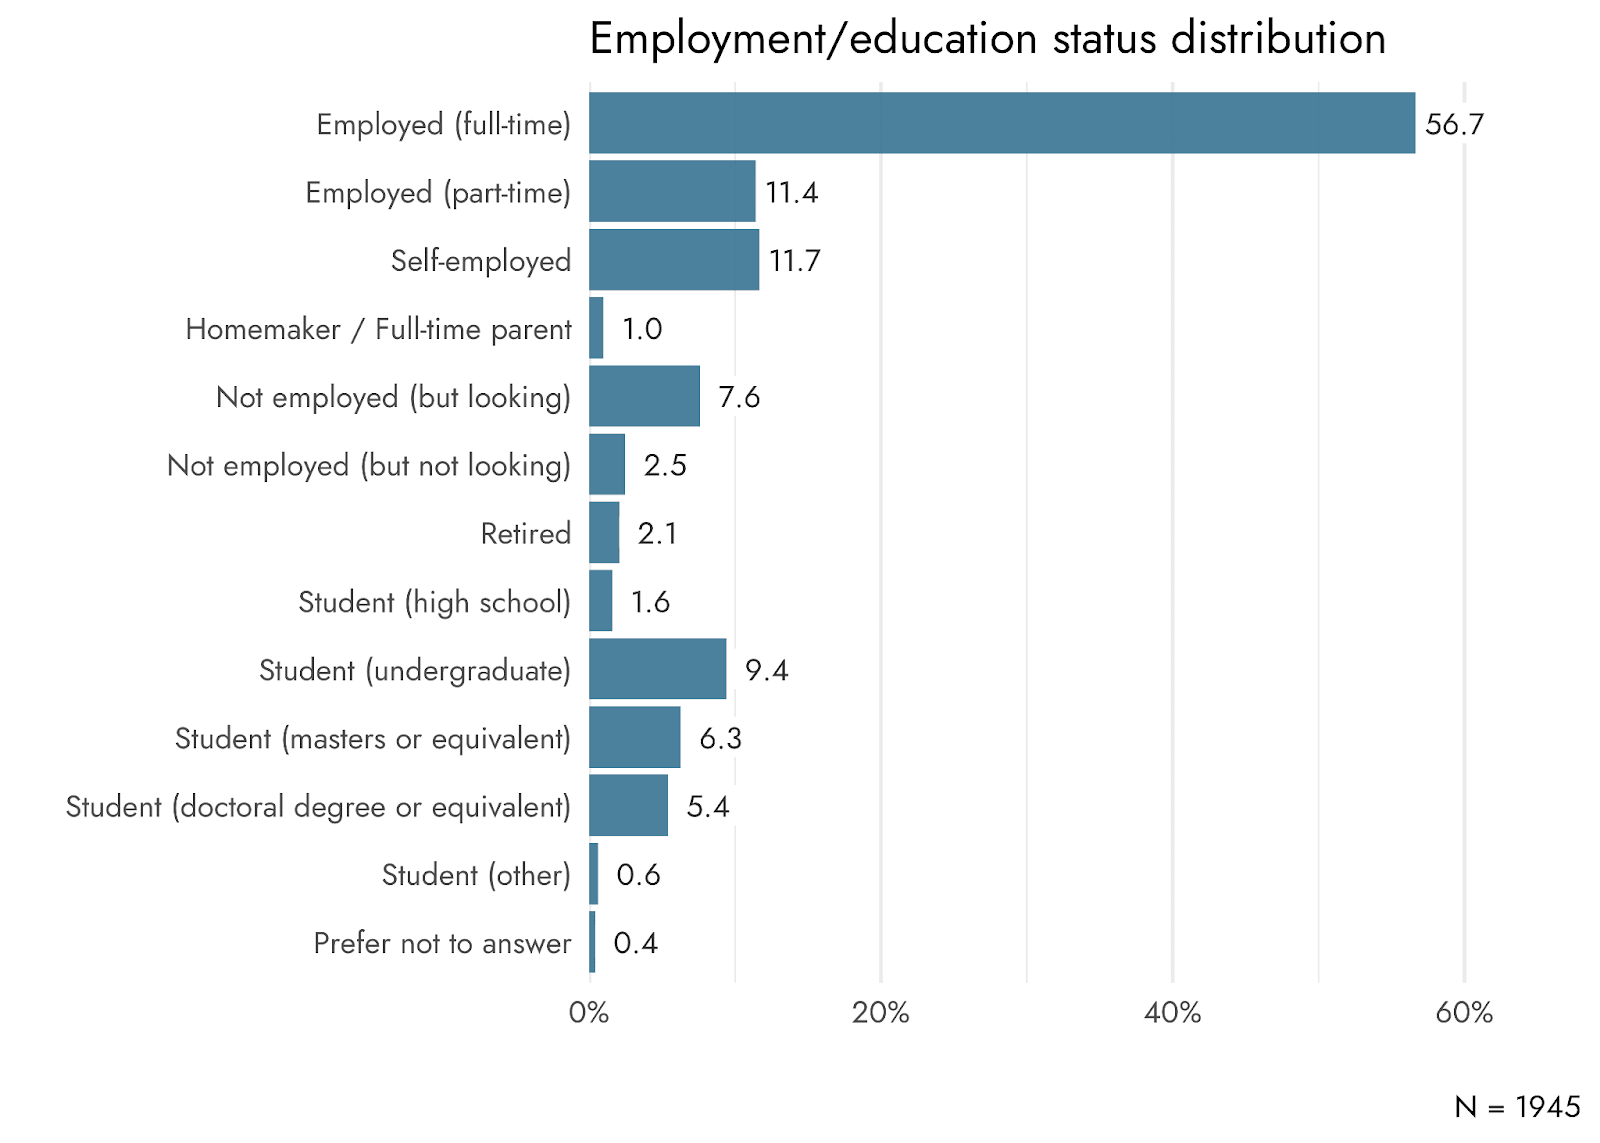
- Over half of the respondents are in full-time employment (56.7%), followed by being self-employed (11.7%) and part-time employment (11.4%)
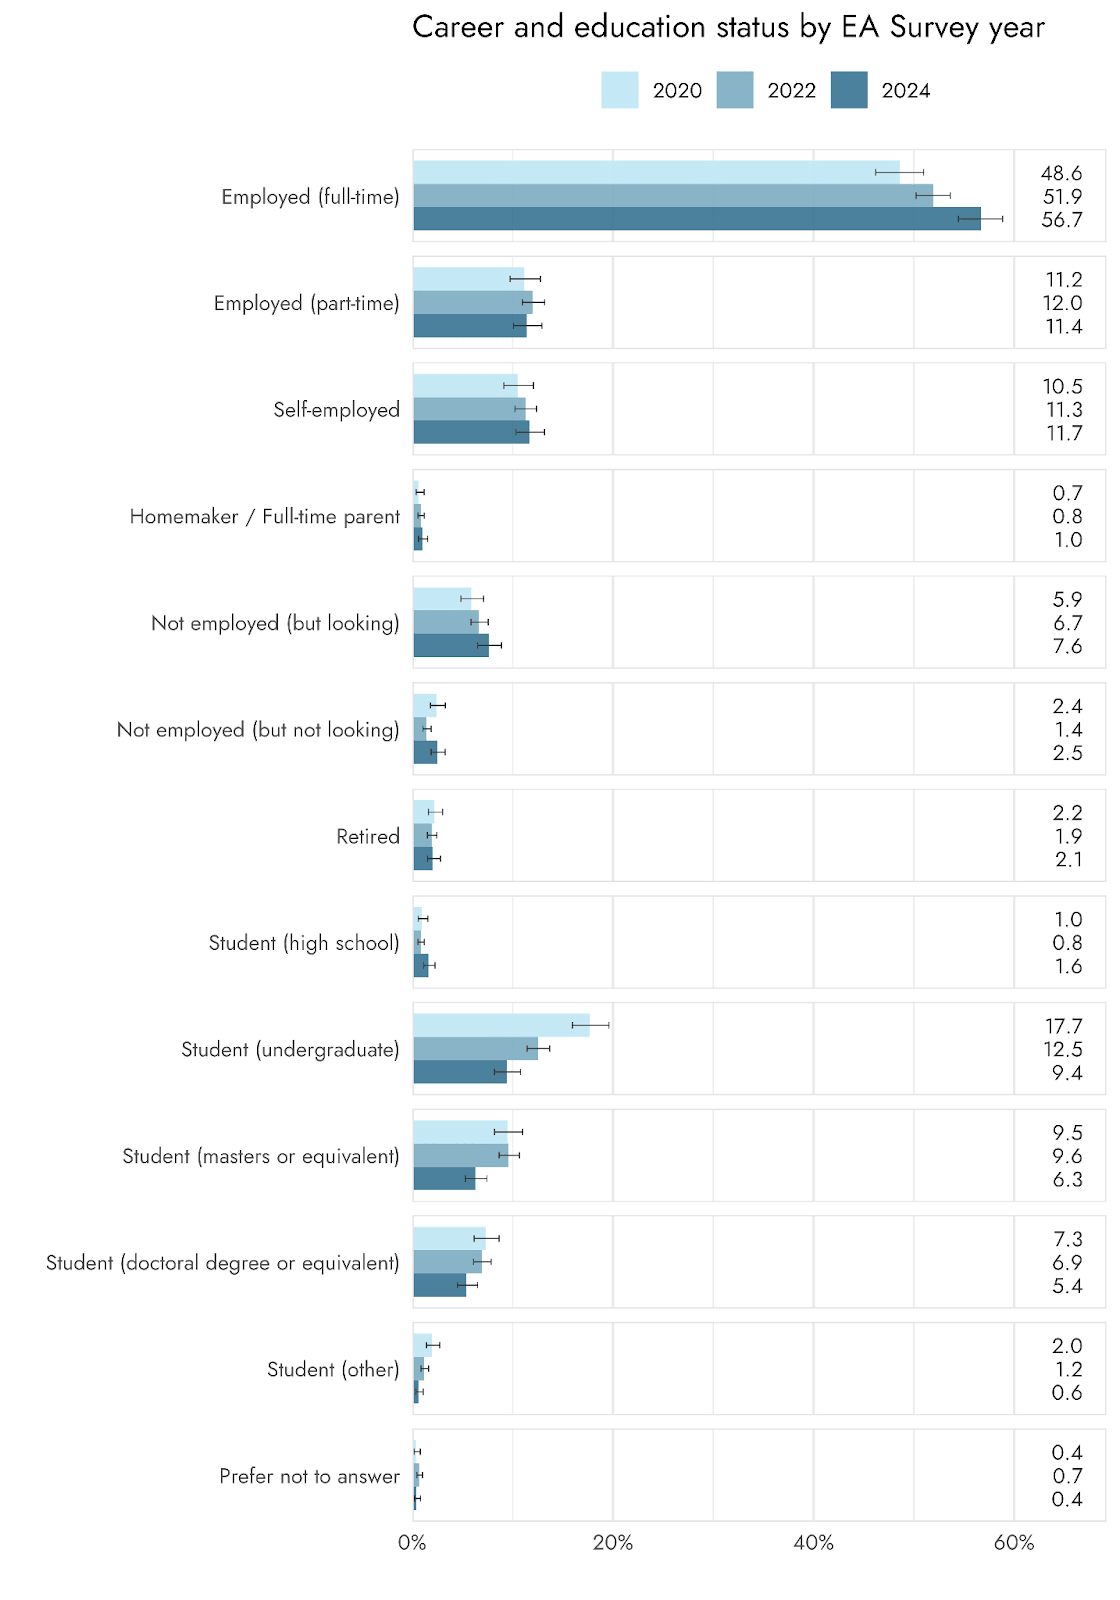
- The percentage of respondents in full-time employment has increased from 48.6% in 2020 and the number of students has decreased
- The percentage of undergraduate students in particular has decreased from 17.7% in 2020 to 9.4% in 2024
- Universities
- About 30% of respondents who reported attending a university reported going to a top 25 ranked university and almost 80% attended a top 200 ranked university
- Career strategies
- Respondents most commonly selected research as their main strategy for career impact (18.5%), followed by earning to give (15%), and 14% reported that they are still deciding
- Compared to 2022, we see an increase in the percentage of respondents who use earning to give as their main strategy for impact (from 10.2% to 15%) and a decrease in the percentage of respondents who are still deciding (from 19.6% to 14%)
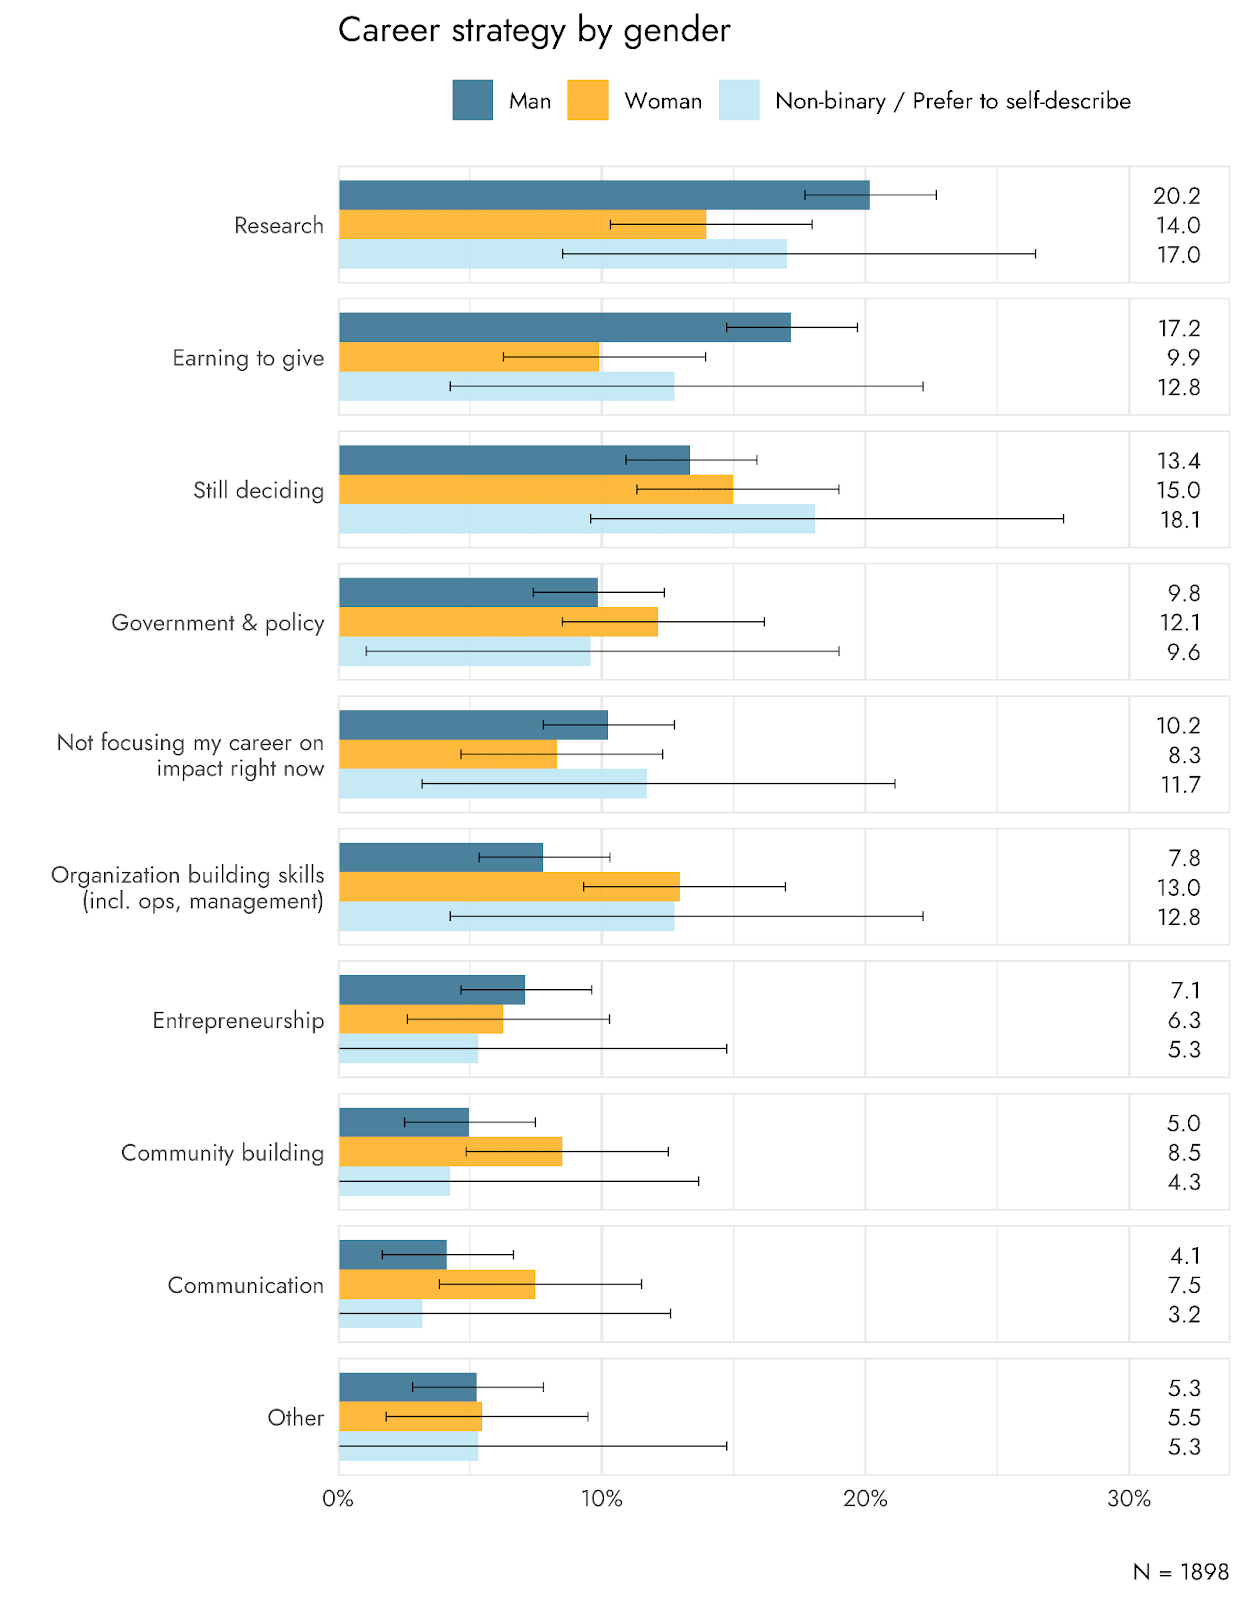
- Compared to women, men more frequently reported following a career in research (20.2% vs. 14%) and using earning to give as their main strategy for impact (17.2% vs. 9.9%). In contrast, more women reported pursuing organization building skills (13% vs. 7.8%) community building (8.5% vs. 5%), and communication (7.5% vs. 4.1%) compared to men.
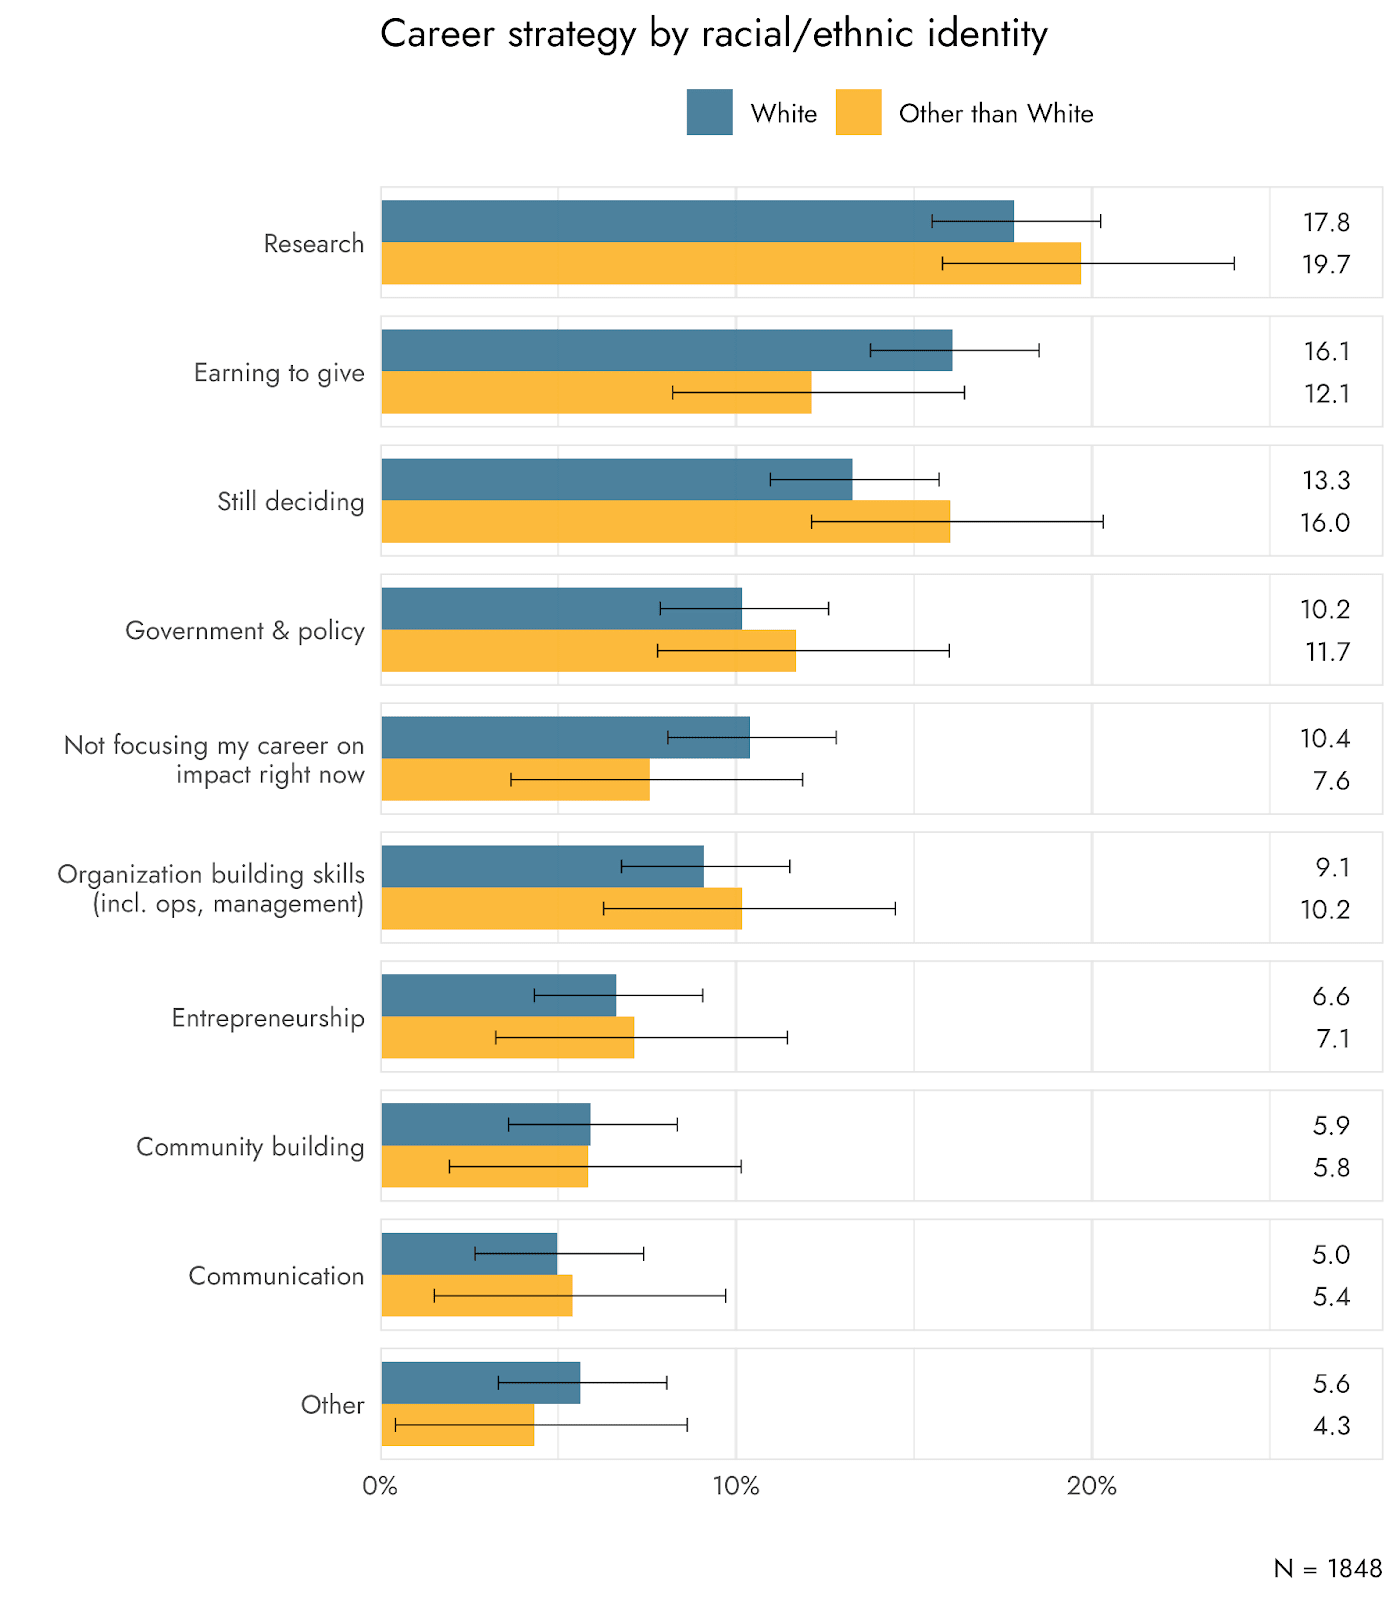
- A slightly higher percentage of White respondents, compared to non-White respondents, report pursuing earning to give as their main strategy (16.1% vs. 12.1%)
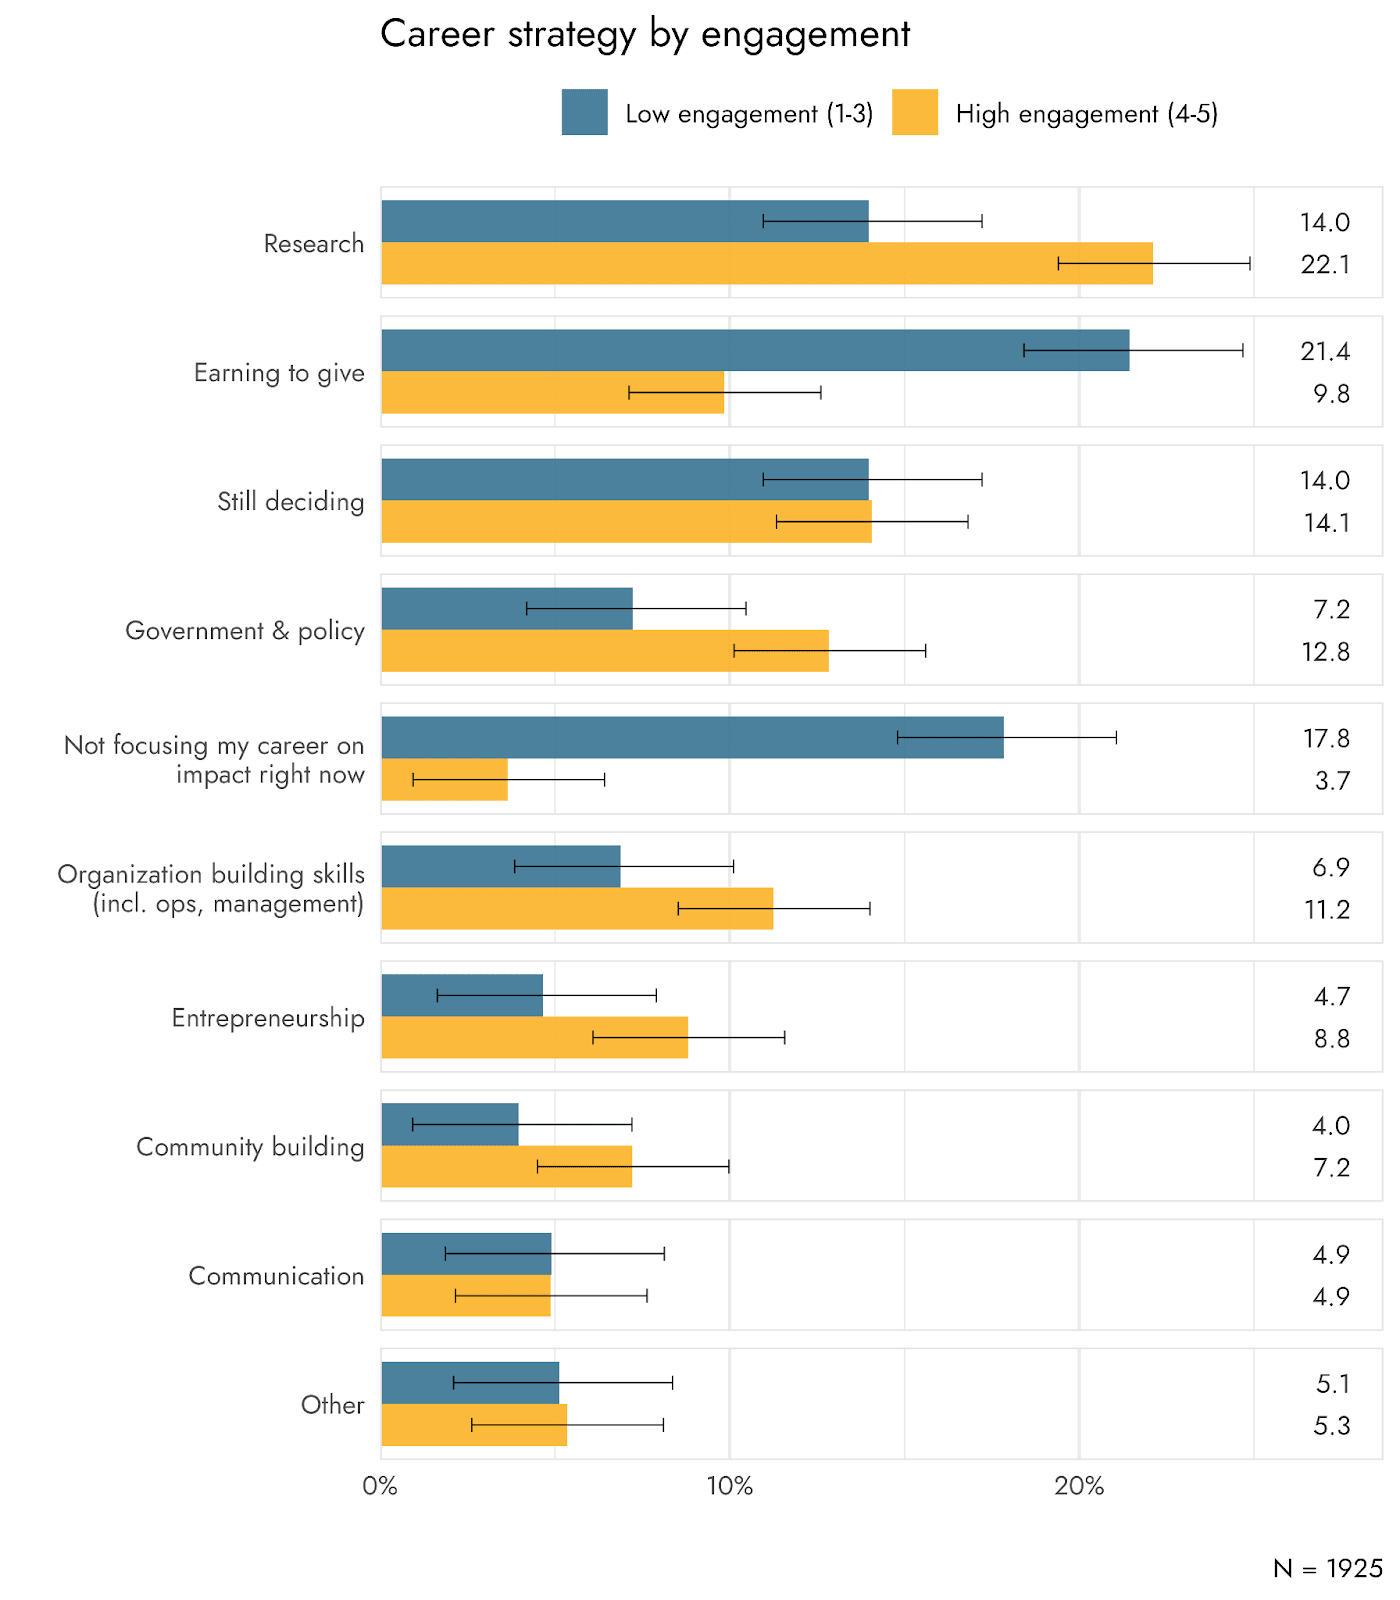
- More differences were found between low and highly engaged respondents. Highly engaged respondents were more likely to pursue a strategy in research (22.1% vs. 14%), government & policy (12.8% vs. 7.2%), organization building skills (11.2% vs. 6.9%), entrepreneurship (8.8% vs. 4.7%), and community building (7.2% vs. 4%). Less engaged respondents were more likely to rely on earning to give (21.4% vs. 9.8%) and they were also more likely to not focus their career on impact at this time (17.8% vs. 3.7%).
- Approaches to doing good
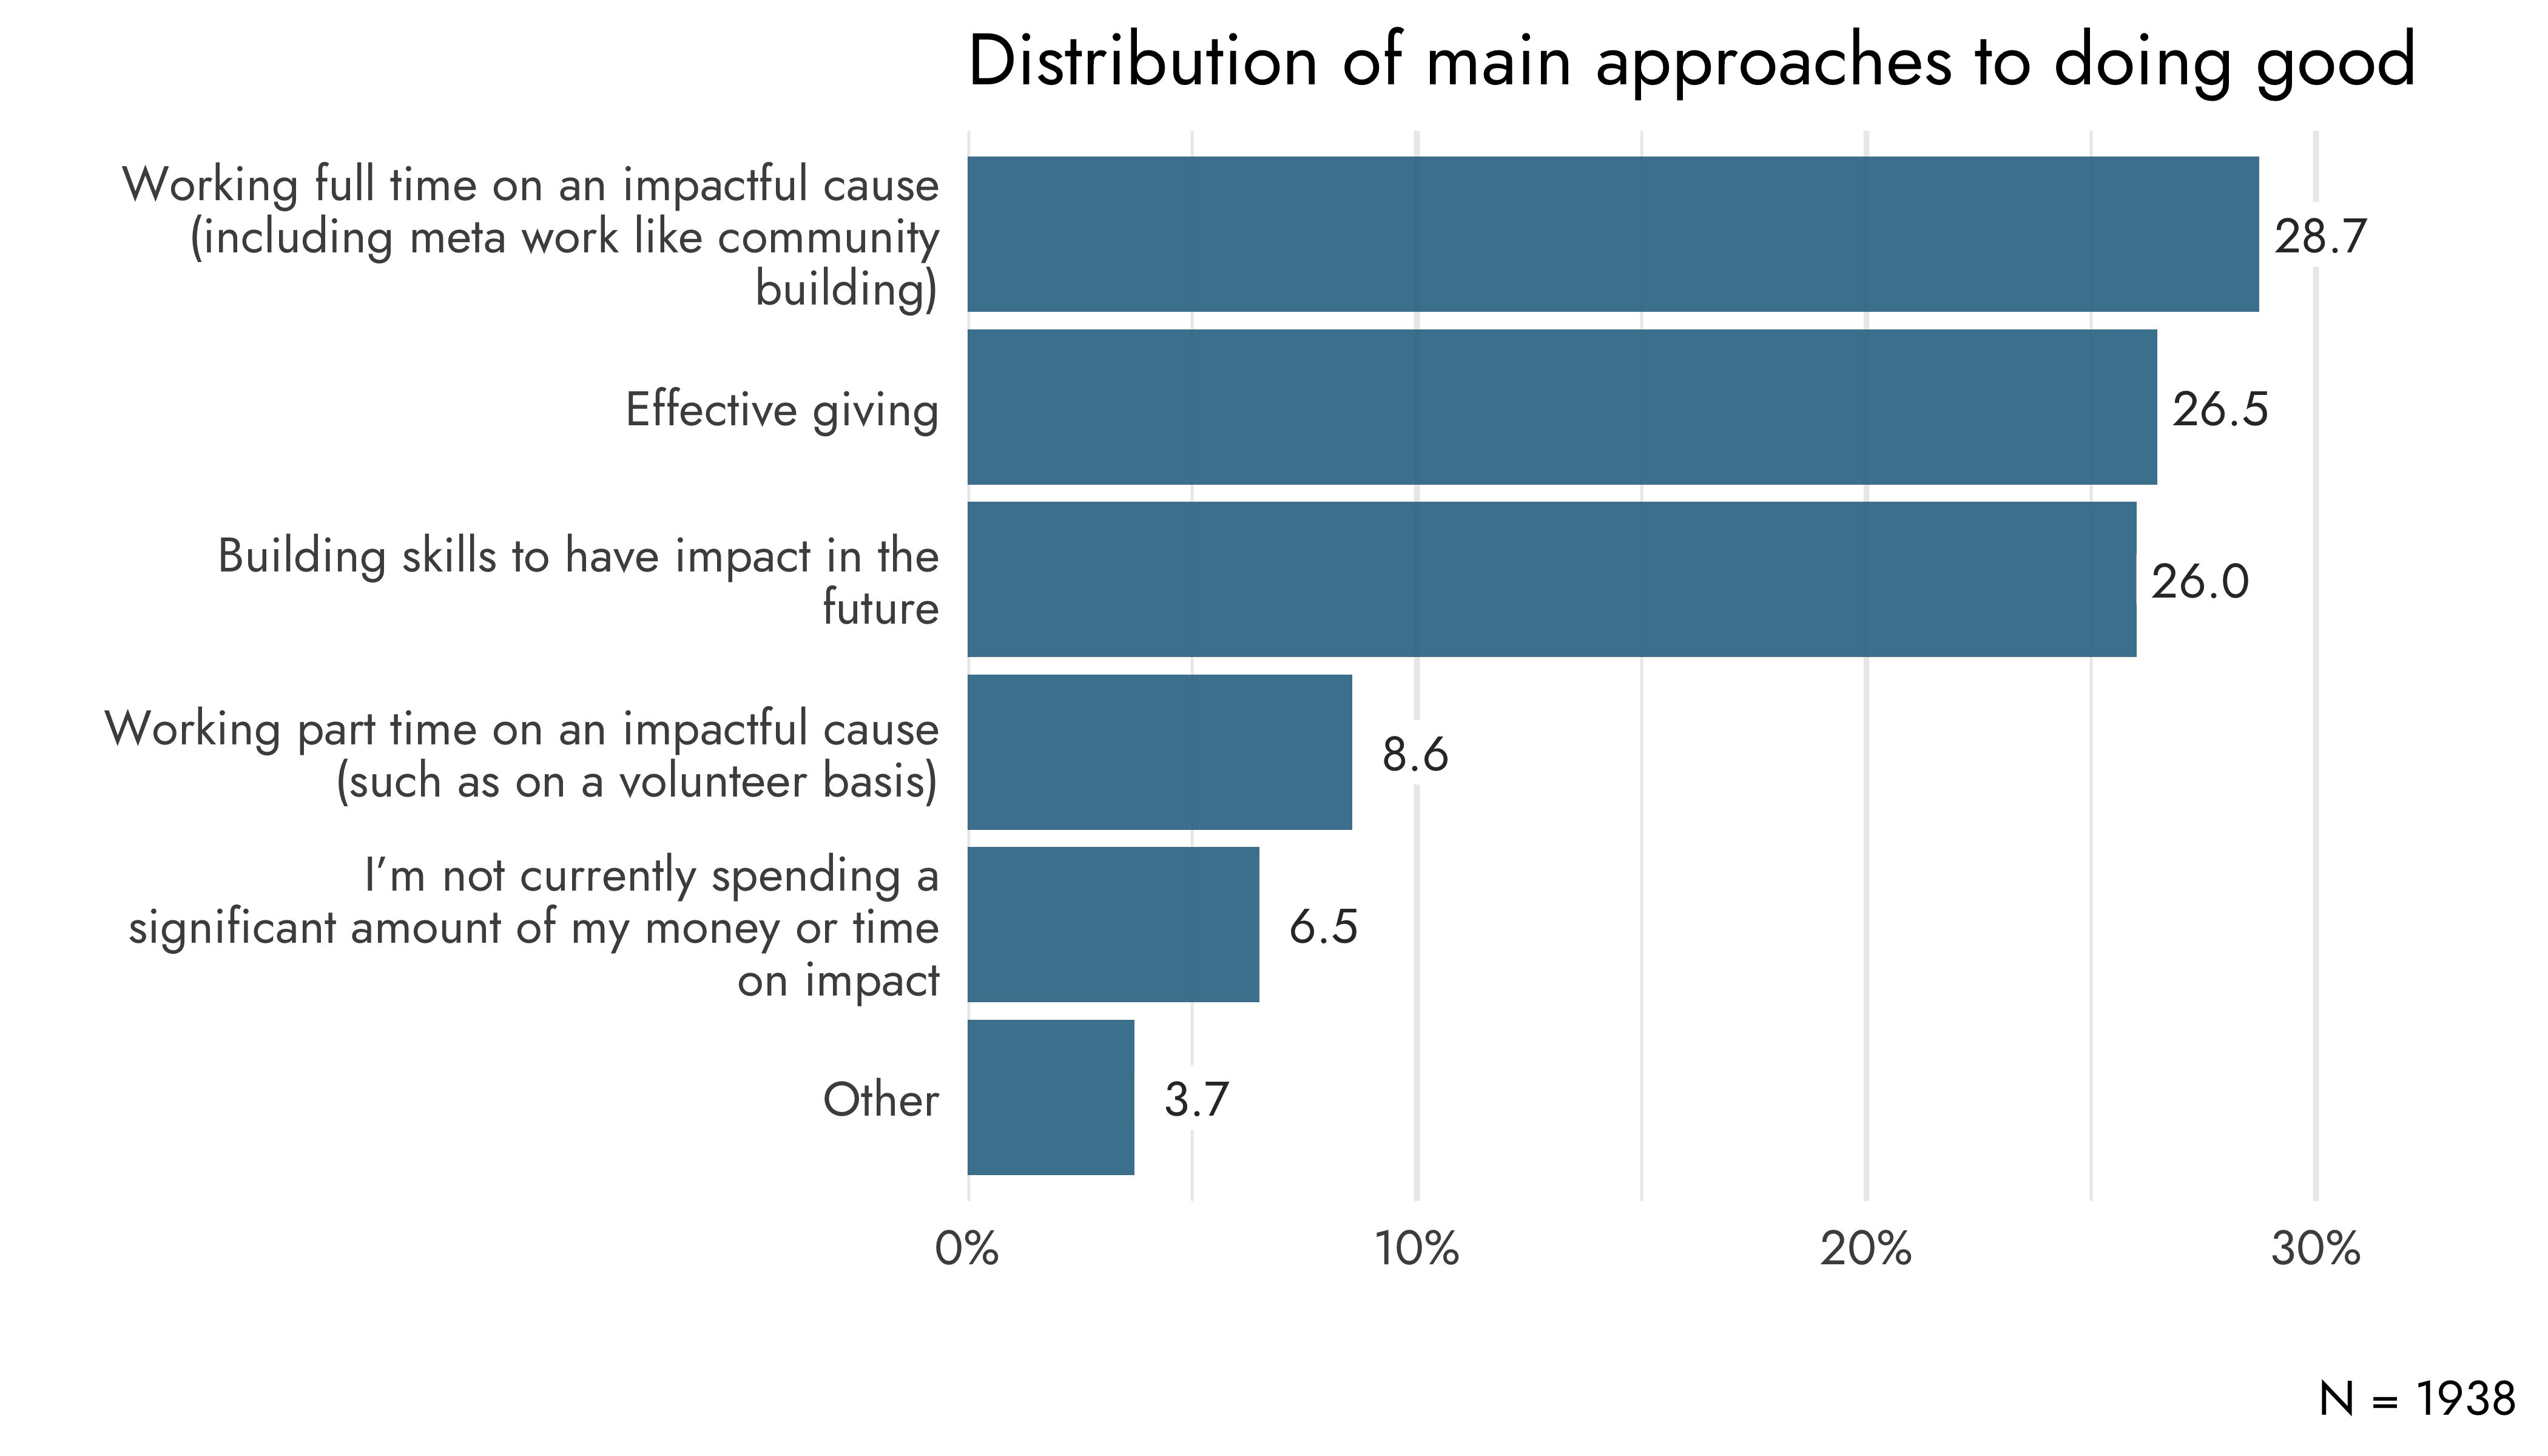
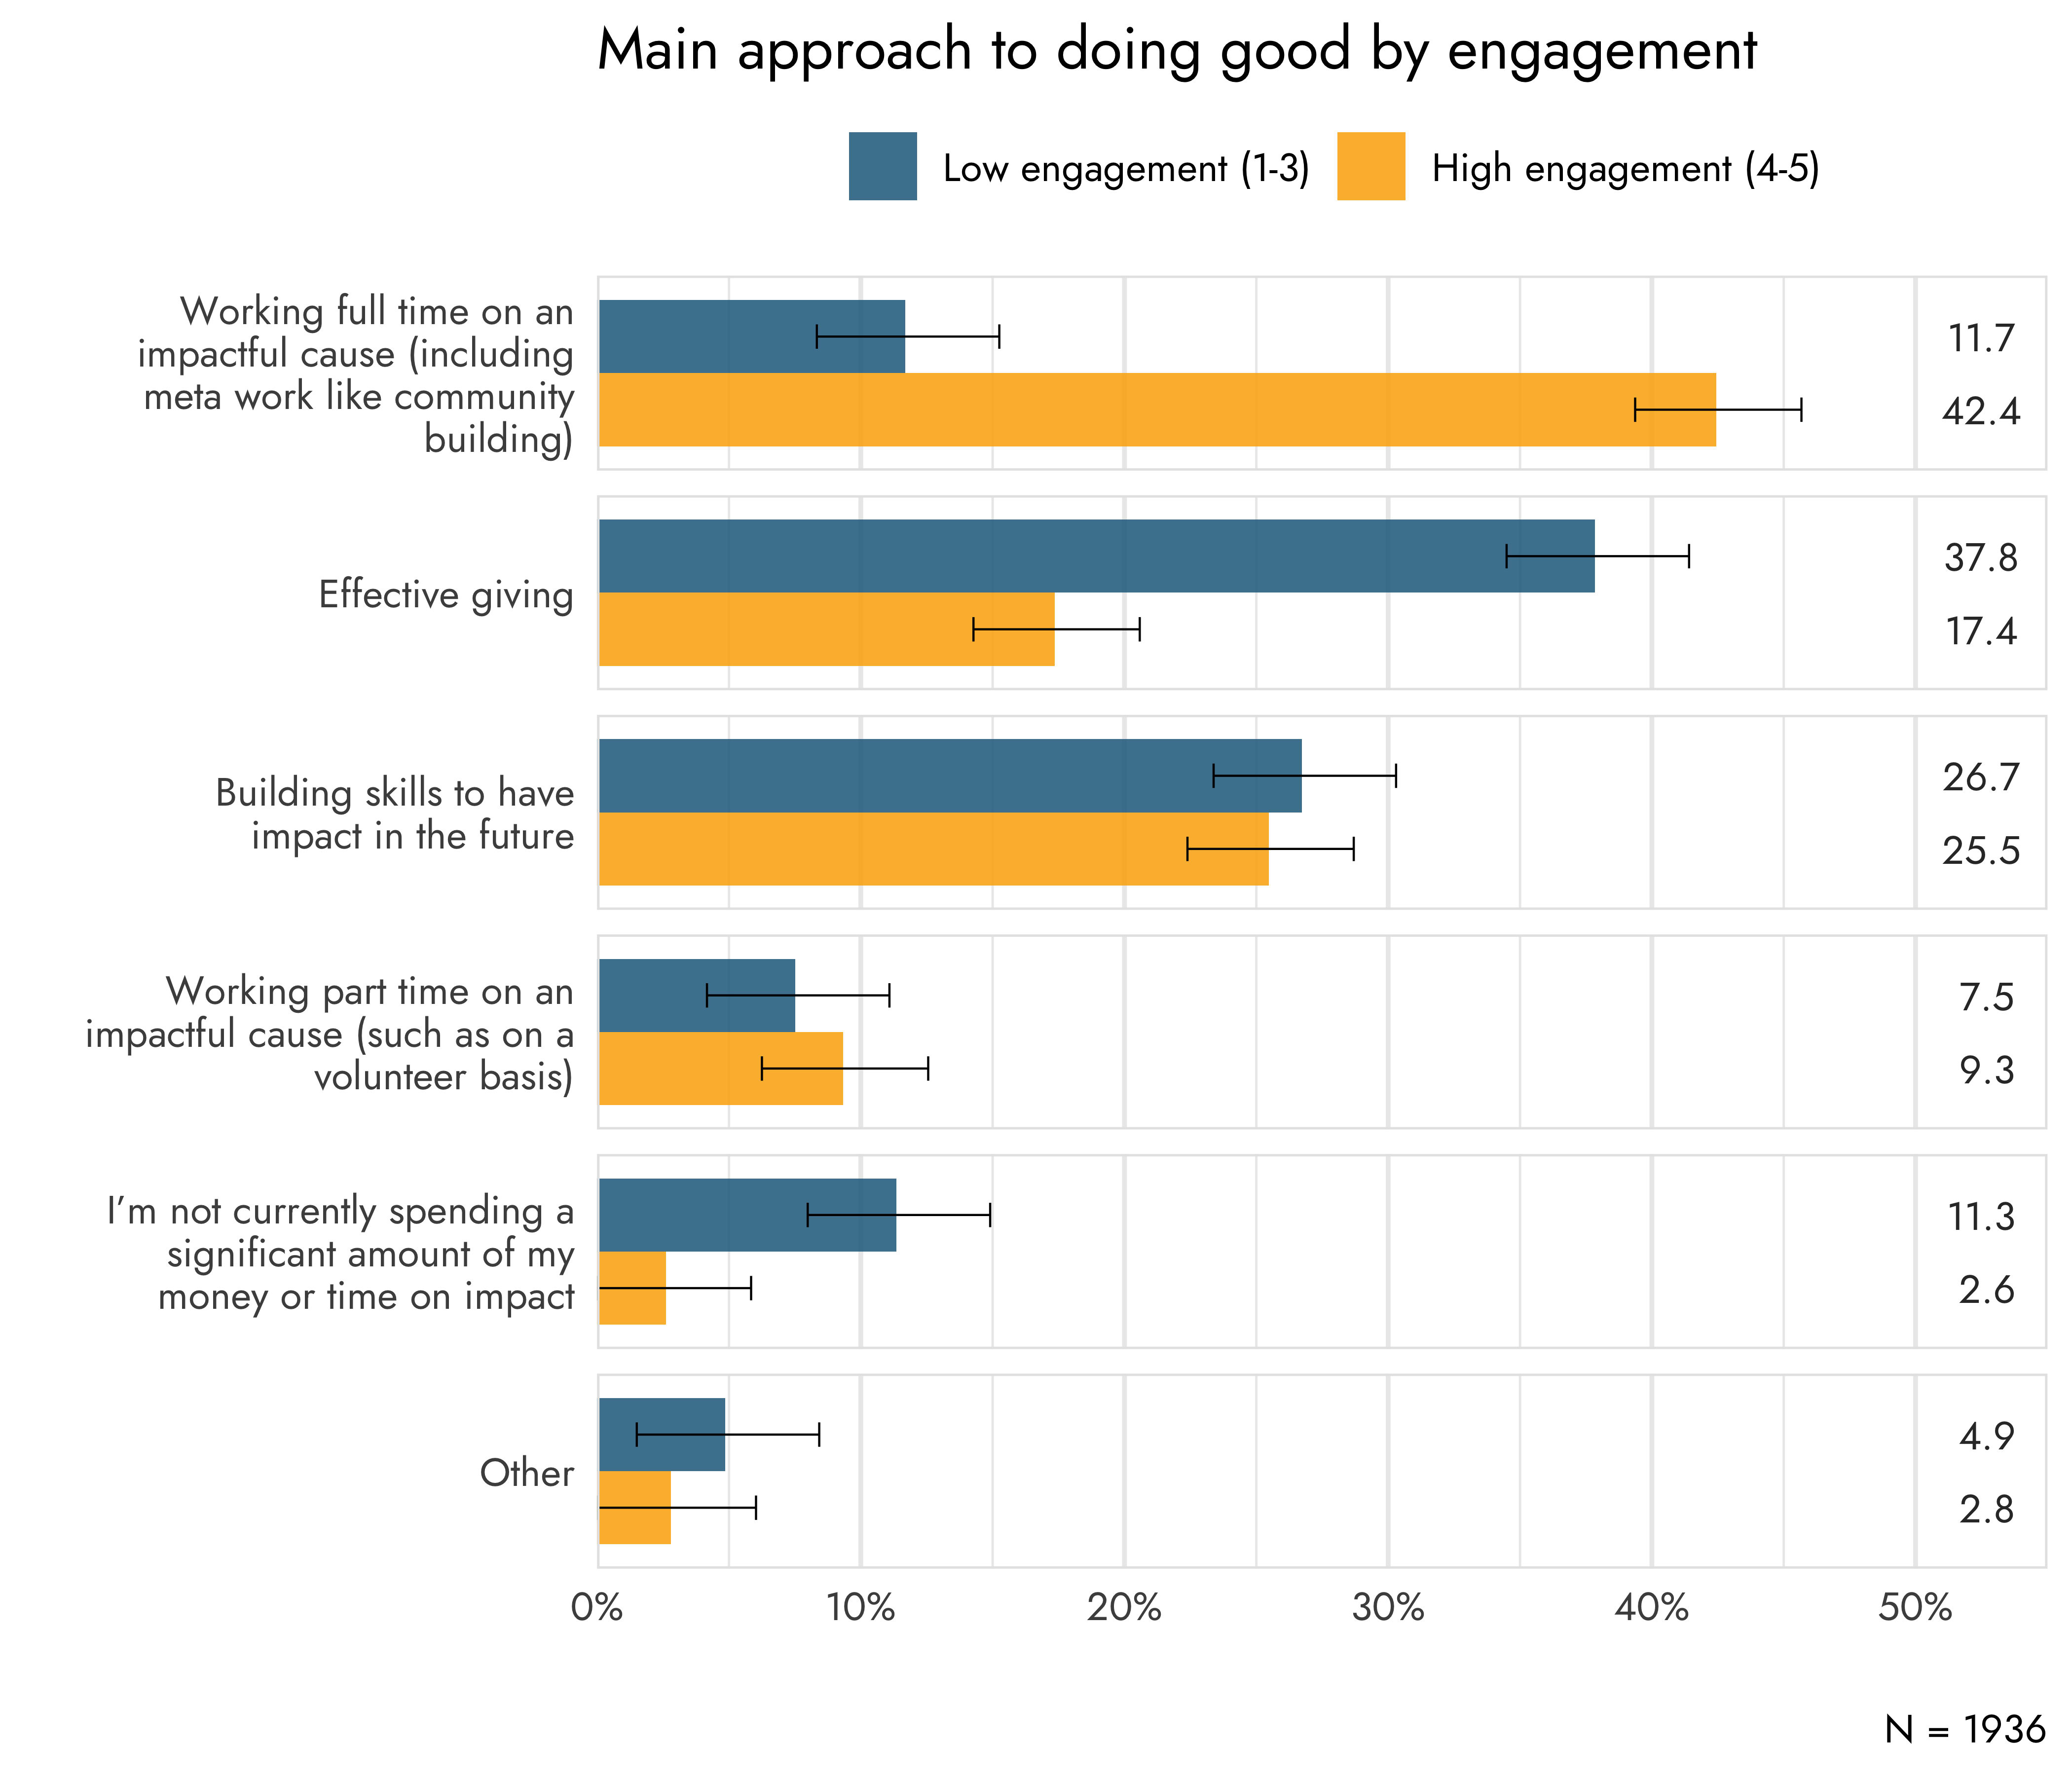
- The majority of respondents reported that their main approach to doing good consists of working full time on an impactful cause (28.7%), effective giving (26.5%), and building skills to have impact in the future (26%)
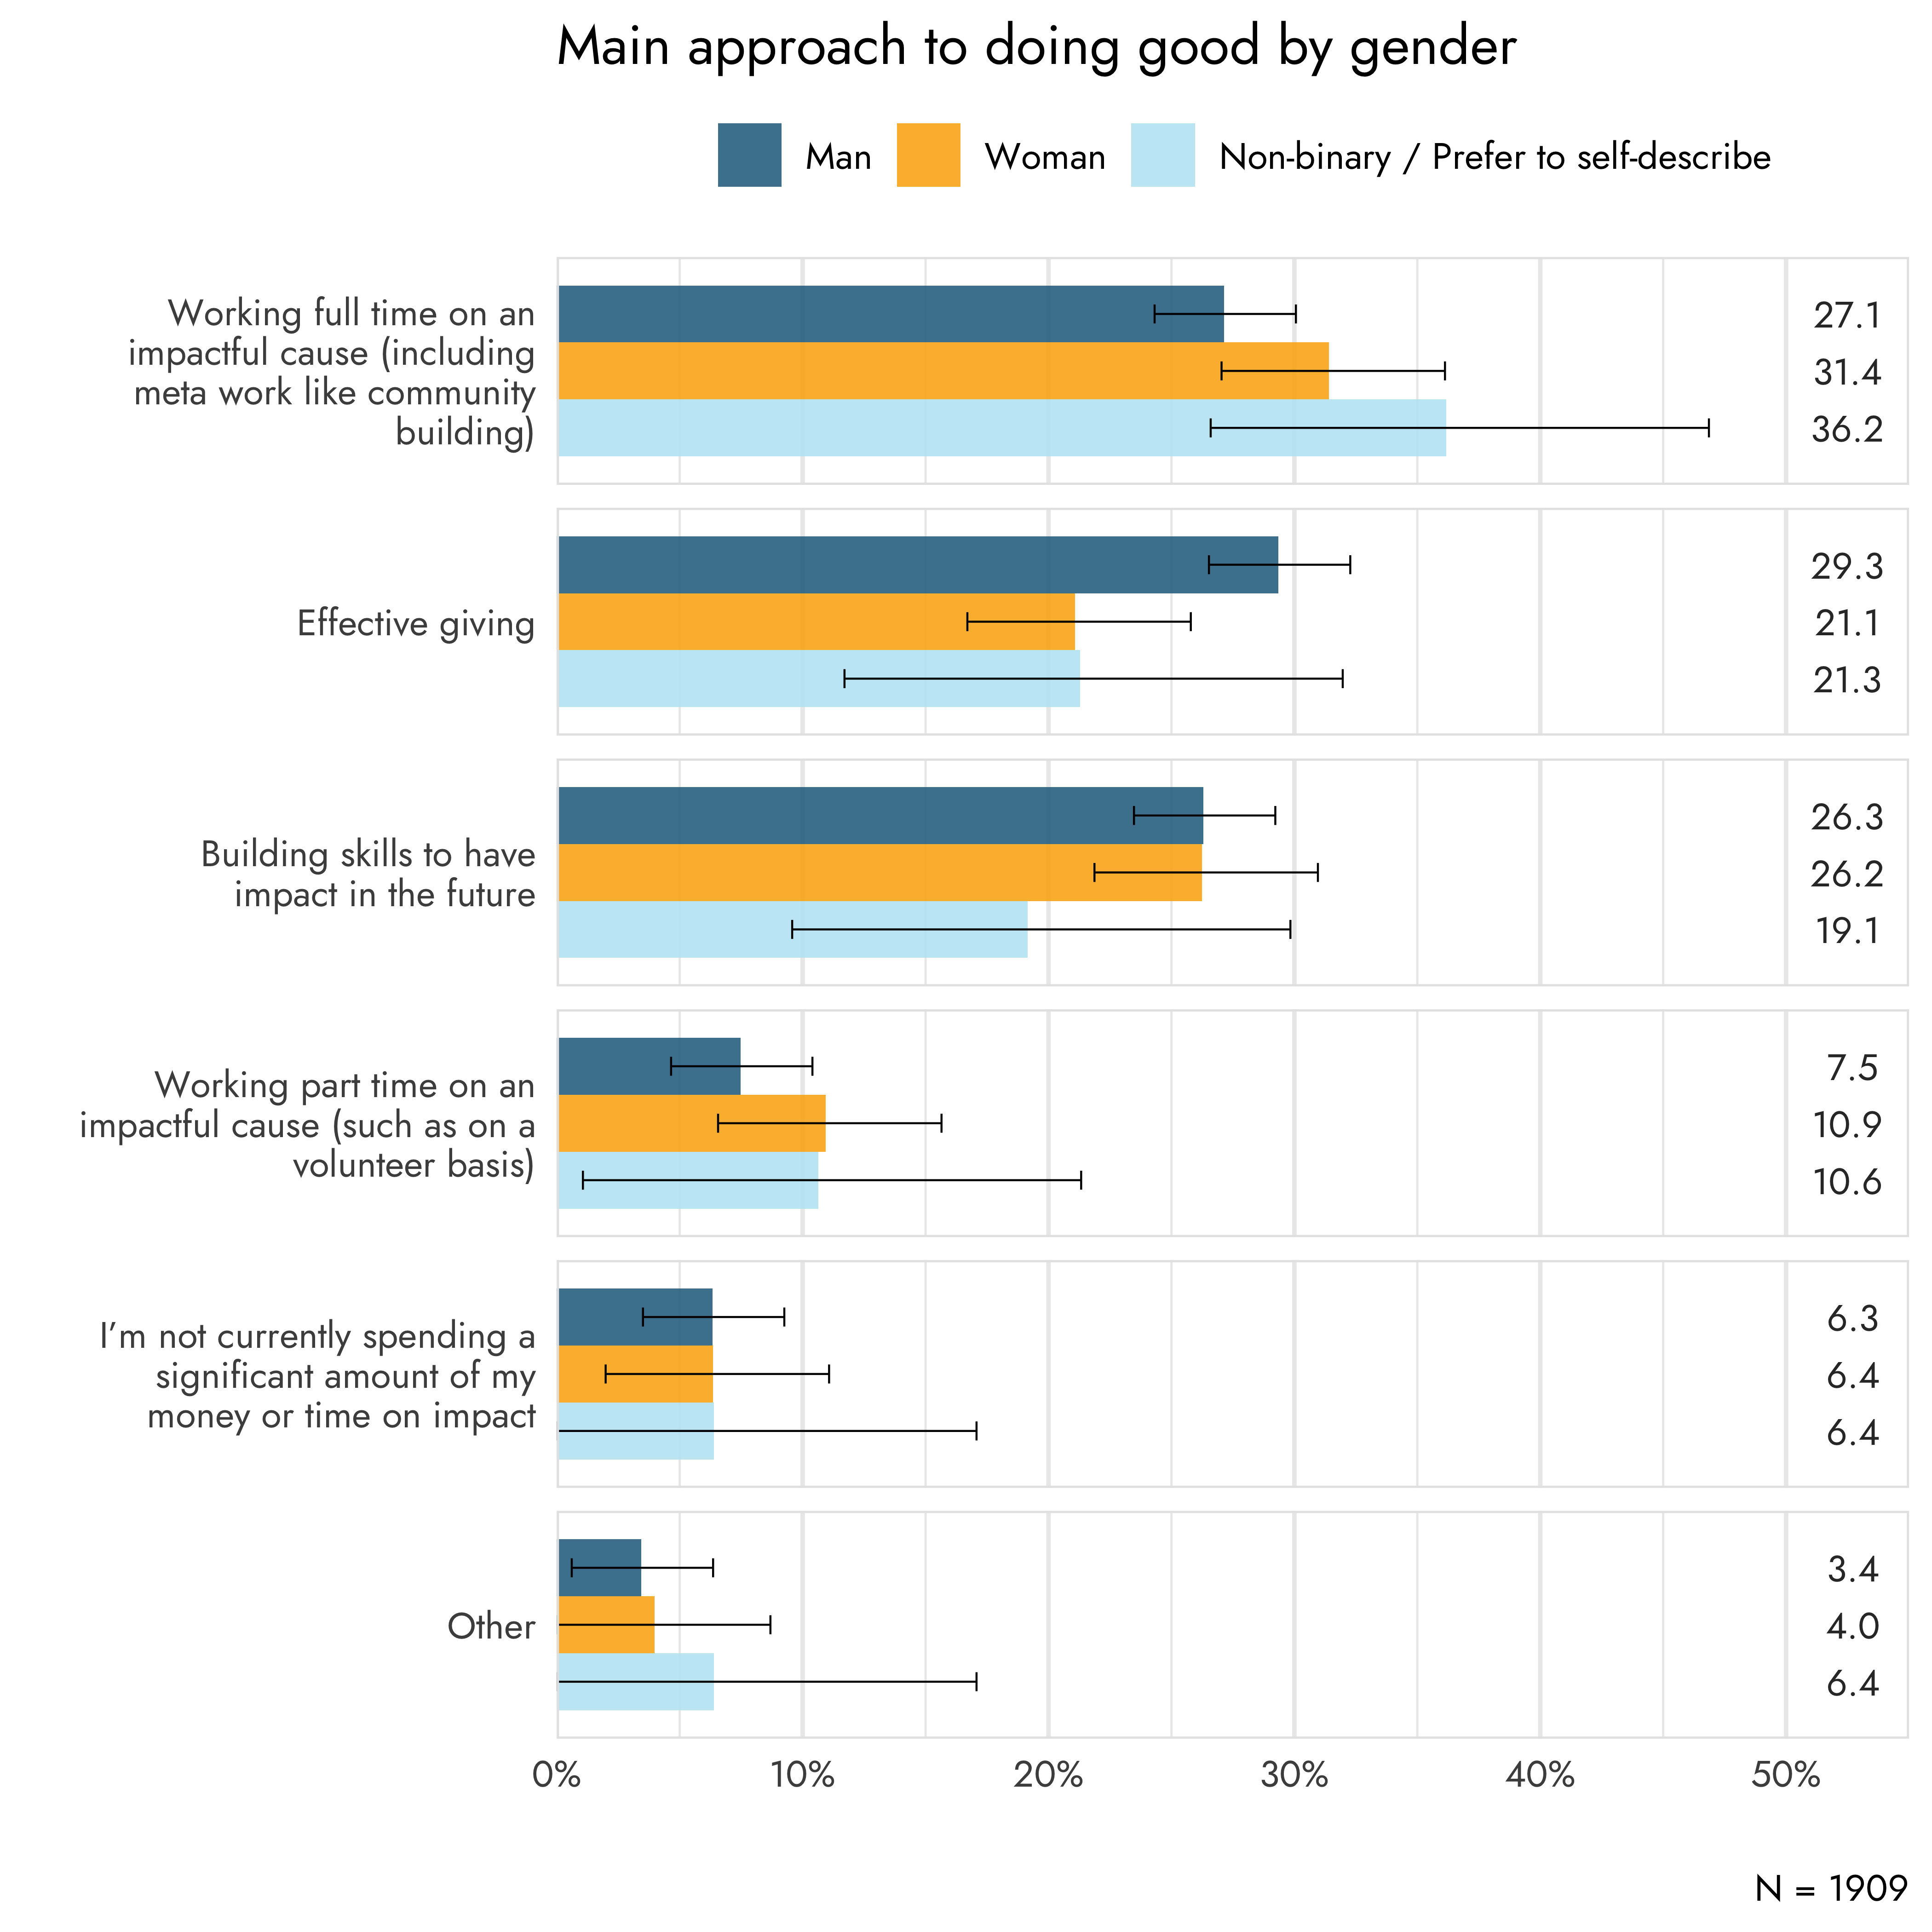
- There were relatively few large differences between men and women in terms of their approaches to doing good, except that more men focus on effective giving (29.3%) compared to women (21.1%)
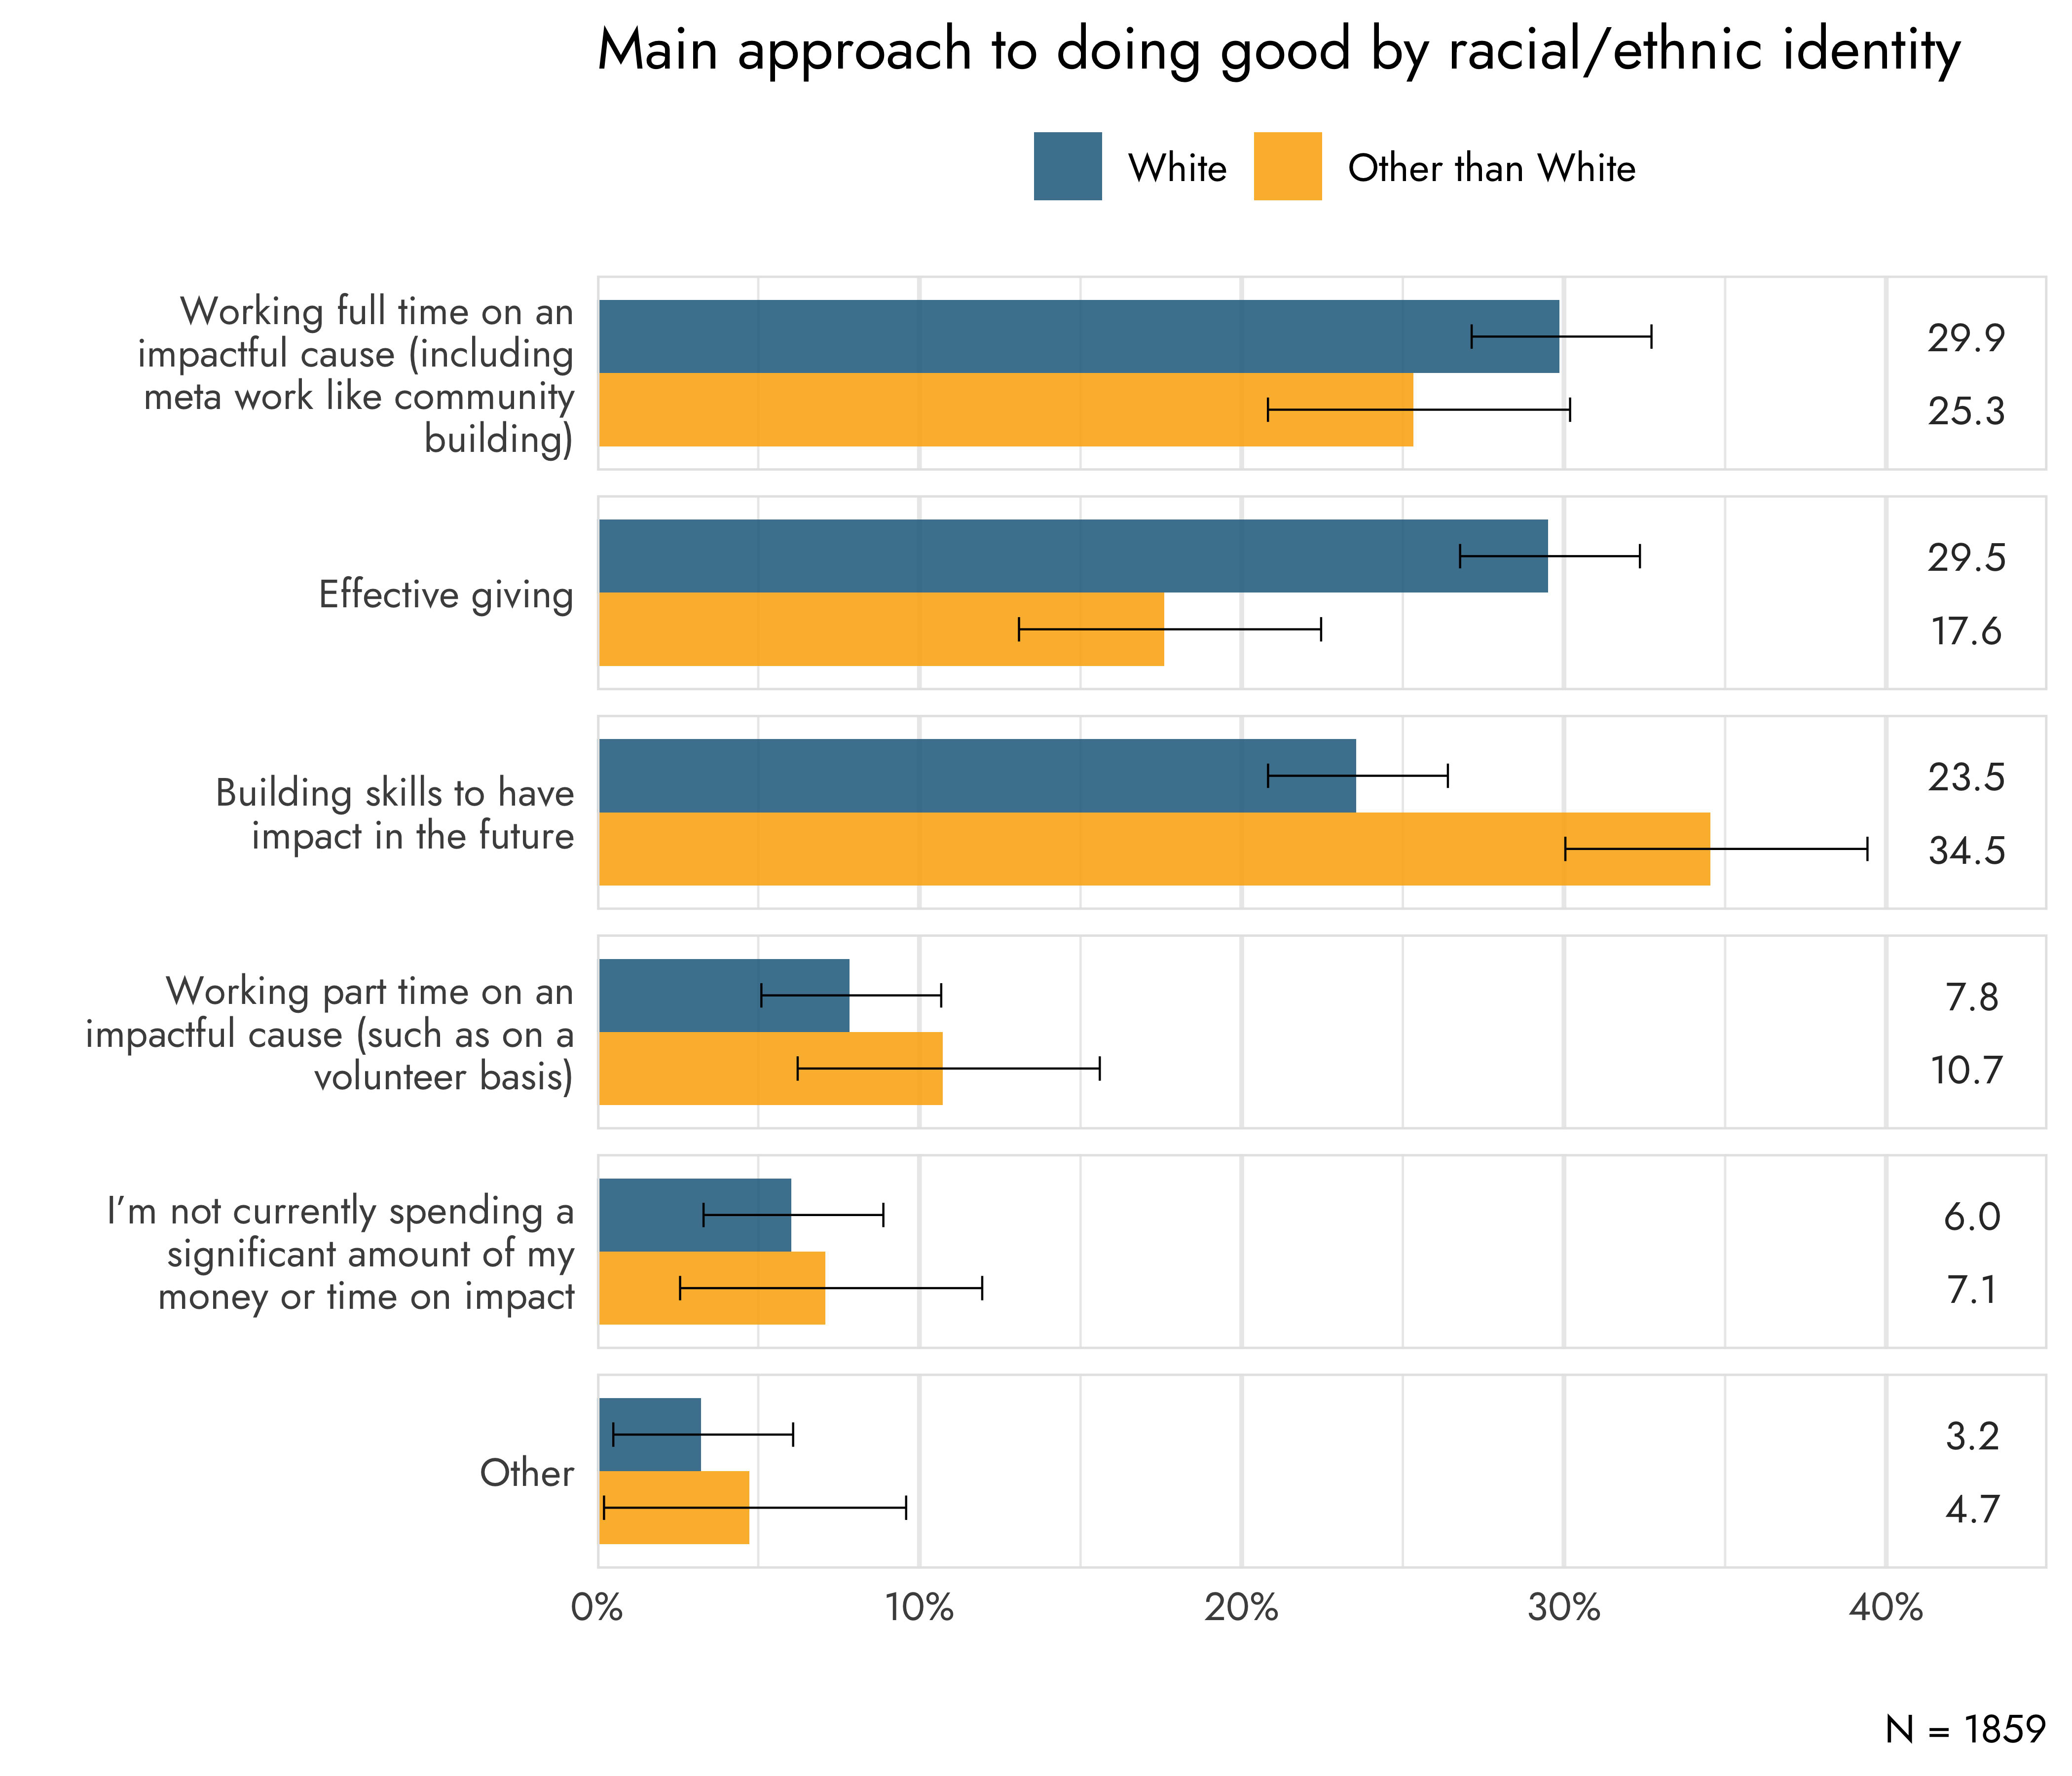
- More sizable differences were found regarding racial/ethnic identity. White respondents reported being more likely to rely on effective giving as their main approach to doing good compared to non-White respondents(29.5% vs. 17.6%) and less likely to use building skills to have impact in the future (23.5% vs. 34.5%).
- The largest differences were found between respondents who are highly engaged in EA and those who are less engaged. Highly engaged EAs are more likely to work full time on an impactful cause (42.4%) compared to less engaged EAs (11.7%), who are in turn more likely to rely on effective giving (37.8%) compared to highly engaged EAs (17.4%). Less engaged EAs are also more likely to not be spending a significant amount of their money or time on impact (11.3%) compared to highly engaged EAs (2.6%).
- Politics
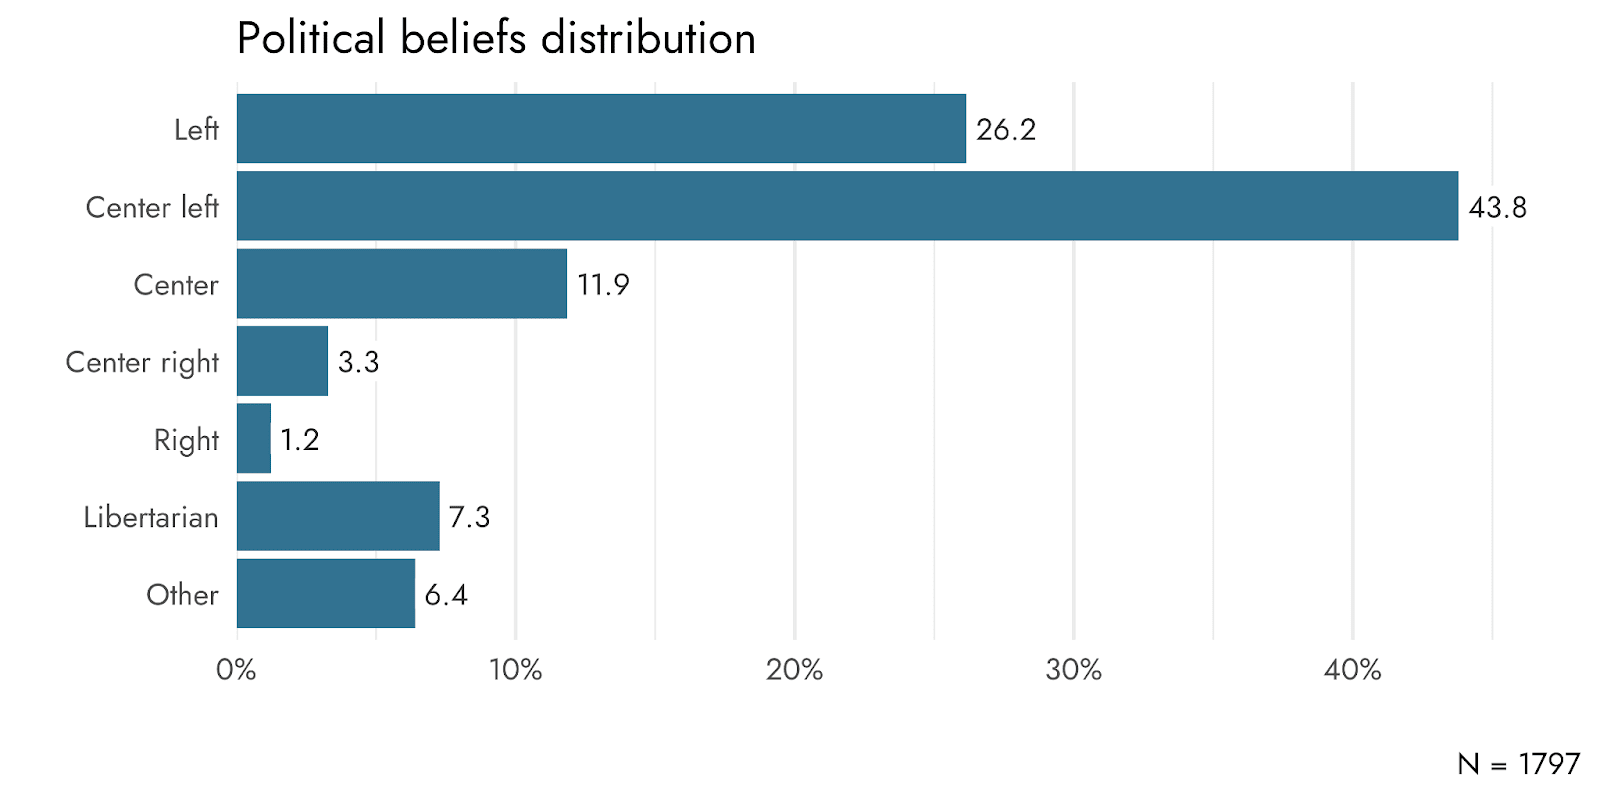
- The EA community is largely left-leaning (70%), with a very small number of respondents identifying as right-leaning (4.5%). A larger proportion of respondents reported being Libertarian (7.3%) or in the center (11.9%).
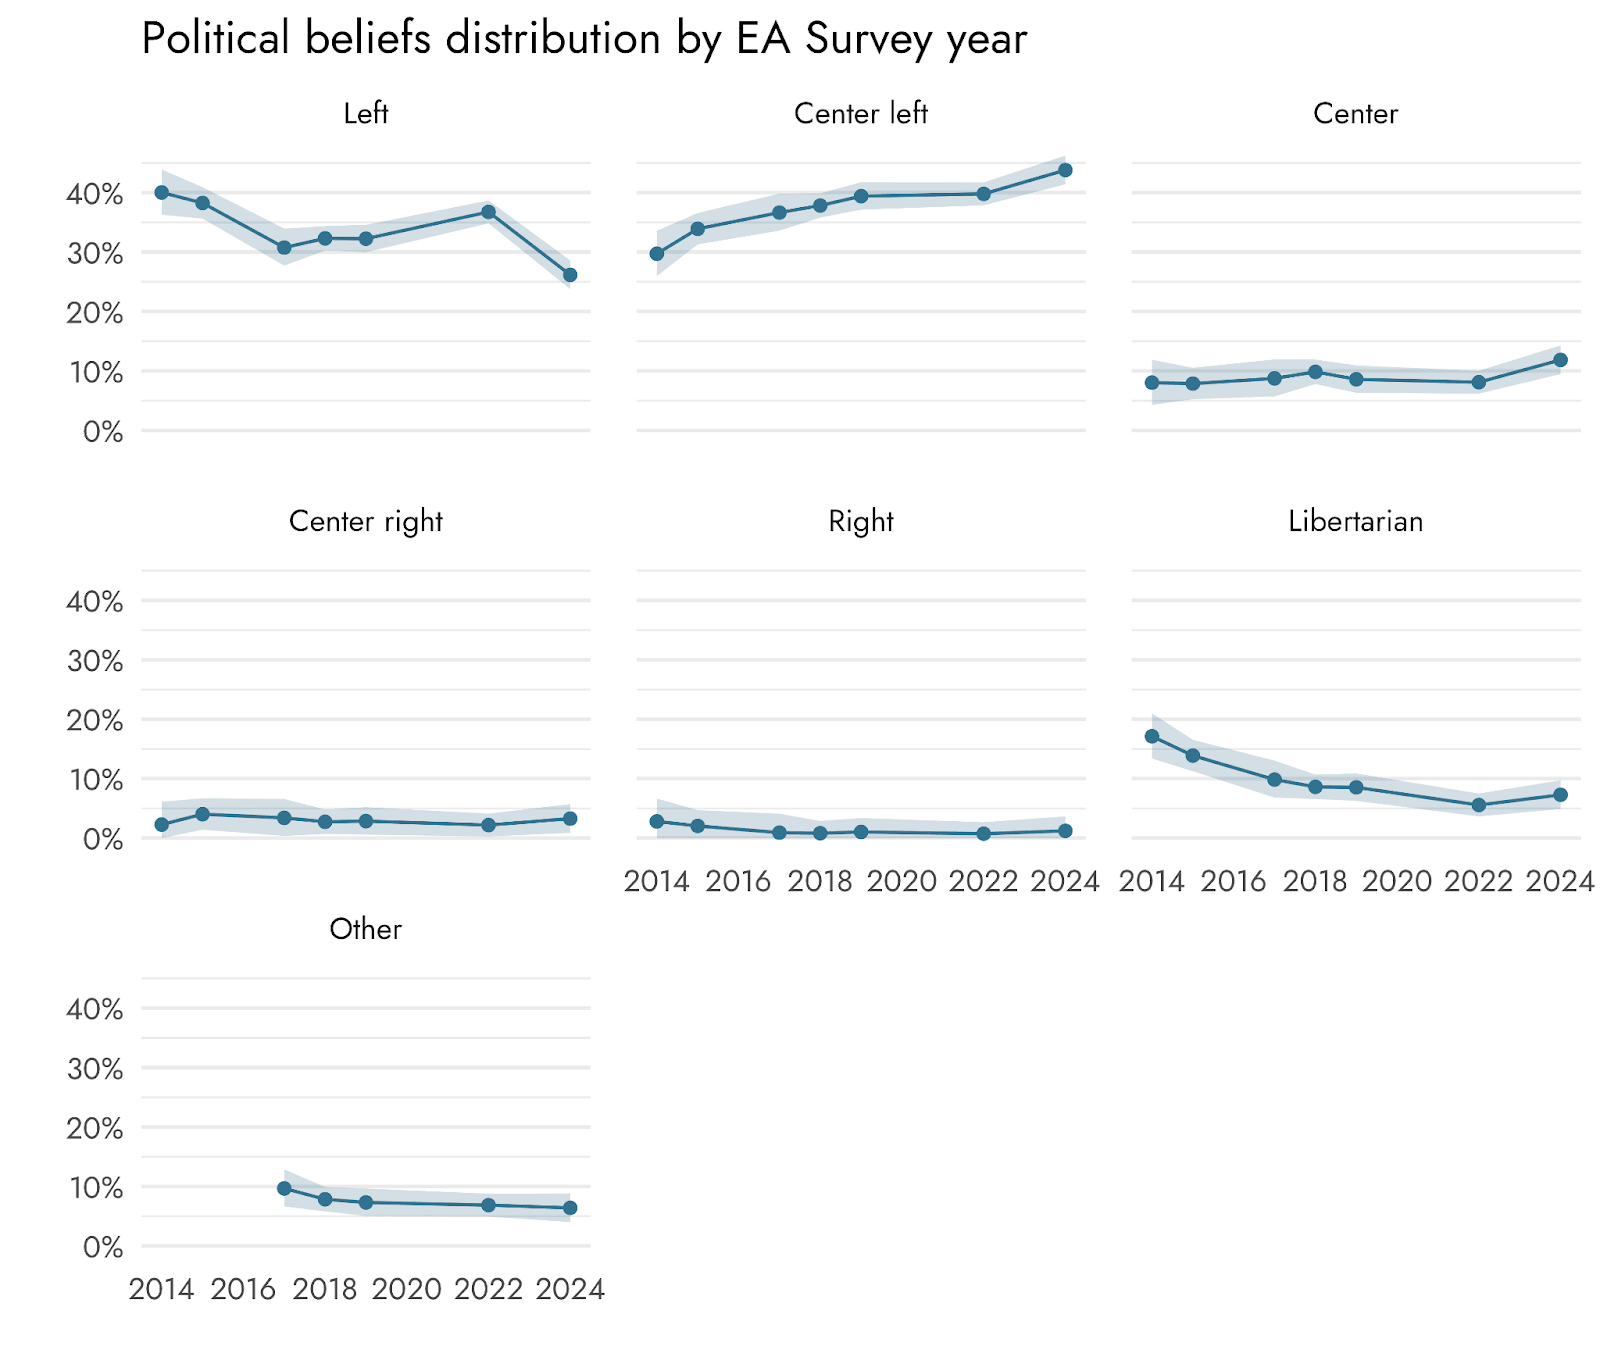
- There is a decrease in the percentage of (fully) left-leaning respondents, and an increase in the percentage of respondents who identify as center and center-left compared to previous years
- Diet
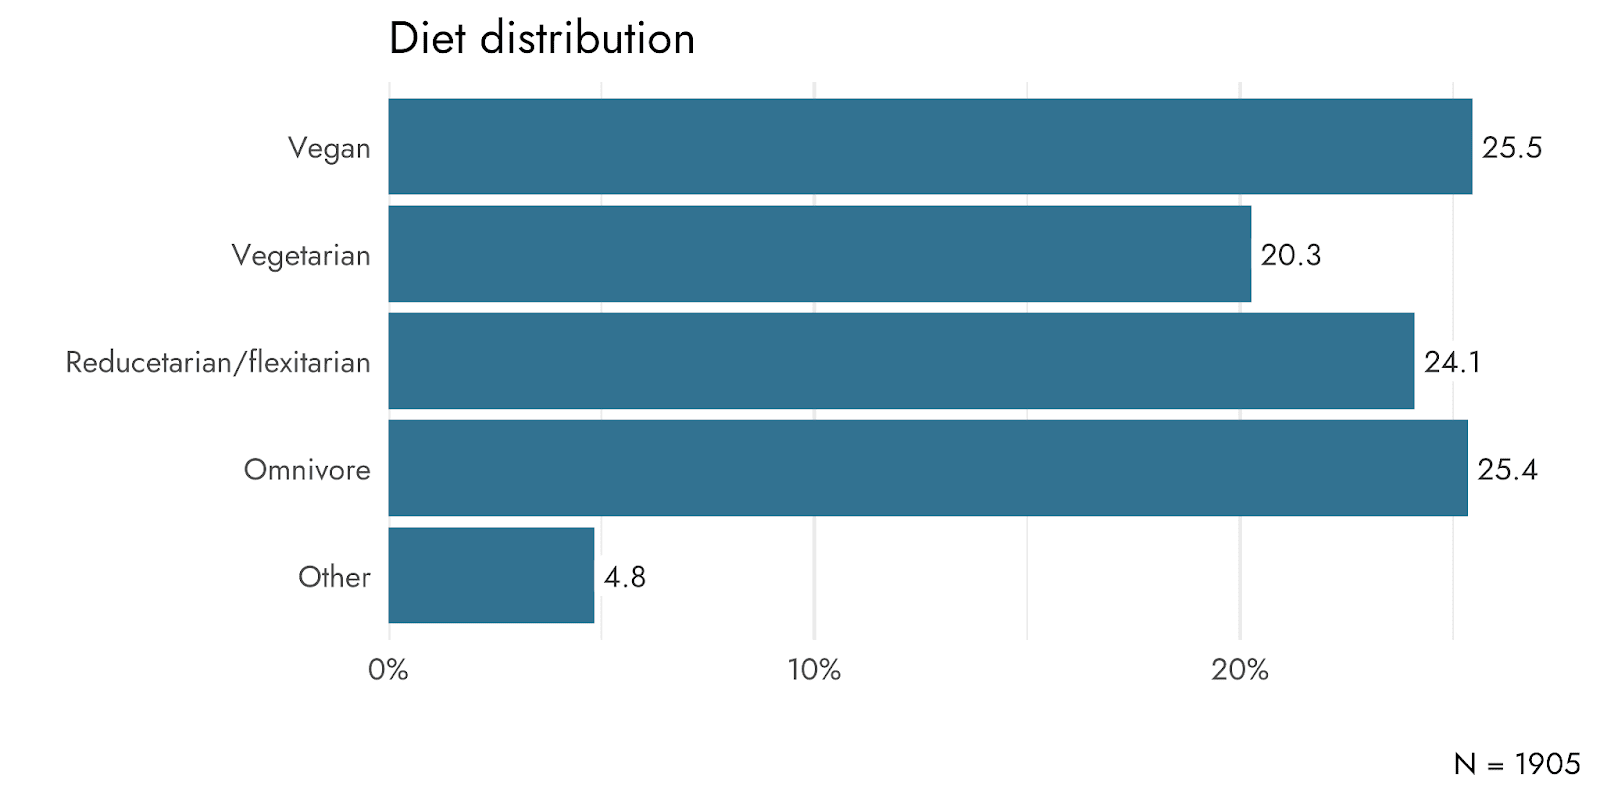
- Respondents are generally evenly split across dietary categories, with vegans at 25.5%, omnivores at 25.4%, reducetarians/flexitarians at 24.1%, and vegetarians at 20.3%
Introduction
In this post we report on the results from the 2024 EA Survey pertaining to the demographic measures that were included in the survey. A recurring observation in previous surveys is that the community is relatively lacking in demographic diversity on the dimensions of gender, age, racial/ethnic identity, and nationality. In this report, we continue our examination of the demographic composition of the community[1], how it has changed over time, and how this is related to different outcomes. In future posts in this series we will examine other topics covered in the EA Survey, such as how EAs get involved in EA, their cause prioritization, and community satisfaction.
The following results are based on data from 2,078 respondents who participated in the 2024 EA Survey, as well as data from previous EA surveys. It bears repeating that we do not know the degree to which the EA Survey samples are representative of the broader EA population. This is because no one knows what the true composition of the EA community is, so it is not possible for us to reliably assess to what degree the EA Survey is representative, as we’ve noted before. In particular, we suspect that it’s likely that respondents who are less engaged in EA are less likely to have participated in the survey, which means results may be particularly less representative of this group. However, we can conduct further analyses to assess the sensitivity of results to different factors on request. Despite this uncertainty regarding representativeness, however, the results are likely to contribute to and potentially spark new discussions about the EA community. The results may also be particularly relevant for movement builders and decision makers who work on efforts to change the demographic composition of the EA community.
Below we report results that we believe to be of general interest. Please note that you can also reach out to us directly and request particular results when they are relevant to your work.
Finally, we mainly report percentages and total sample sizes in the text and graphs below. Some of the graphs also contain 95% confidence intervals to help assess the robustness of differences between groups or changes over time (in particular to show the degree to which small sample sizes could be affecting the results). Exact hypothesis tests (e.g., comparing specific groups) can be requested.
Basic Demographics
Gender
As in previous years, our survey results show the EA community largely consists of men (68.8%), with fewer women (26.3%), non-binary respondents (4%), and respondents who preferred to self-describe (0.9%).
Last time we noted a small decrease in the percentage of men between 2022 and 2020 (from 70.5% to 66.2%). This time we see a small increase in the percentage of men compared to 2022 (from 66.2% to 68.8%) and a decrease in the percentage of women (from 29.3% to 26.3%). The percentage of non-binary and respondents who preferred to self-describe their gender stayed mostly the same (from 4.5% to 4.9%, see the group ‘Other’ in the graph below).
Overall, the longer-term trend for the proportion of men in the community has remained roughly flat since around 2018, at a slightly lower level than the earliest years of the EA Survey (for a table, see Appendix 1).
Looking across cohorts (the year the respondent first got involved in EA), we see that more recent cohorts contain fewer men and more women than earlier cohorts, just like we observed last time in 2022. This pattern is compatible with an increased recruitment of women[2] (and/or decreased recruitment of men) or disproportionate attrition of women over time, which we will assess in a future post.
Racial/ethnic identity
We again find that most respondents identify themselves as White (75%), followed by Asian (10.3%) and two or more racial/ethnic identities (4.9%).
Looking across cohorts, we see a smaller percentage of White respondents in earlier cohorts compared to older cohorts, similar to the cohort pattern we observed for gender.
Age
Regarding age, we again found that respondents were relatively young compared to general populations in Western countries, with an average age of 32.4 and a median age of 31.
While the community remains relatively young, there has been an increase since 2014, when the average age was 27.4 and the median age was 25 (also see Appendix 3).
The average age of respondents when they first got involved in EA was (naturally) lower, with an average age of 26.7 and a median age of 24.
Last time we noted that the age at which people first got involved in EA has continued to increase. We again find this to be the case. As the graph below shows, we observe a relatively steady increase from an average age of around 25 in older cohorts to an average age around 28 in more recent cohorts. It seems worth noting again that this is older than the age of the typical undergraduate, despite EA outreach commonly being associated with students and student groups.
Careers and Education
Over half of the respondents are in full-time employment (56.7%), followed by being self-employed (11.7%) and part-time employment (11.4%). Almost a quarter of the respondents (23.3%) reported (also) being a student.
Employment/student status
Compared to 2022, we see that the percentage of employed respondents has increased and the percentage of students has decreased, which we also observed last time (from 2020 to 2022). The response categories were changed from 2020 onwards, but the EA Survey from 2018 and 2019 also included a question about employment status. Employment percentages in those years were roughly similar to those of 2020 (49.7% in 2019 and 47.1% in 2018).
University
Respondents were asked about which universities they have attended (if applicable). A total of 1652 respondents reported one or more universities, with a maximum of 5 and an average of 1.57 universities per respondent (and an average of 1.32 among all respondents).
The University of Oxford was the most commonly reported university (4.7%), followed by the University of Cambridge (3.5%) and Harvard University (2.4%). All three are highly ranked universities, as are many of the other reported universities. This is likely at least partly due to higher outreach at these universities (see e.g., here, here, and here), as well as these universities being located in English-speaking countries.
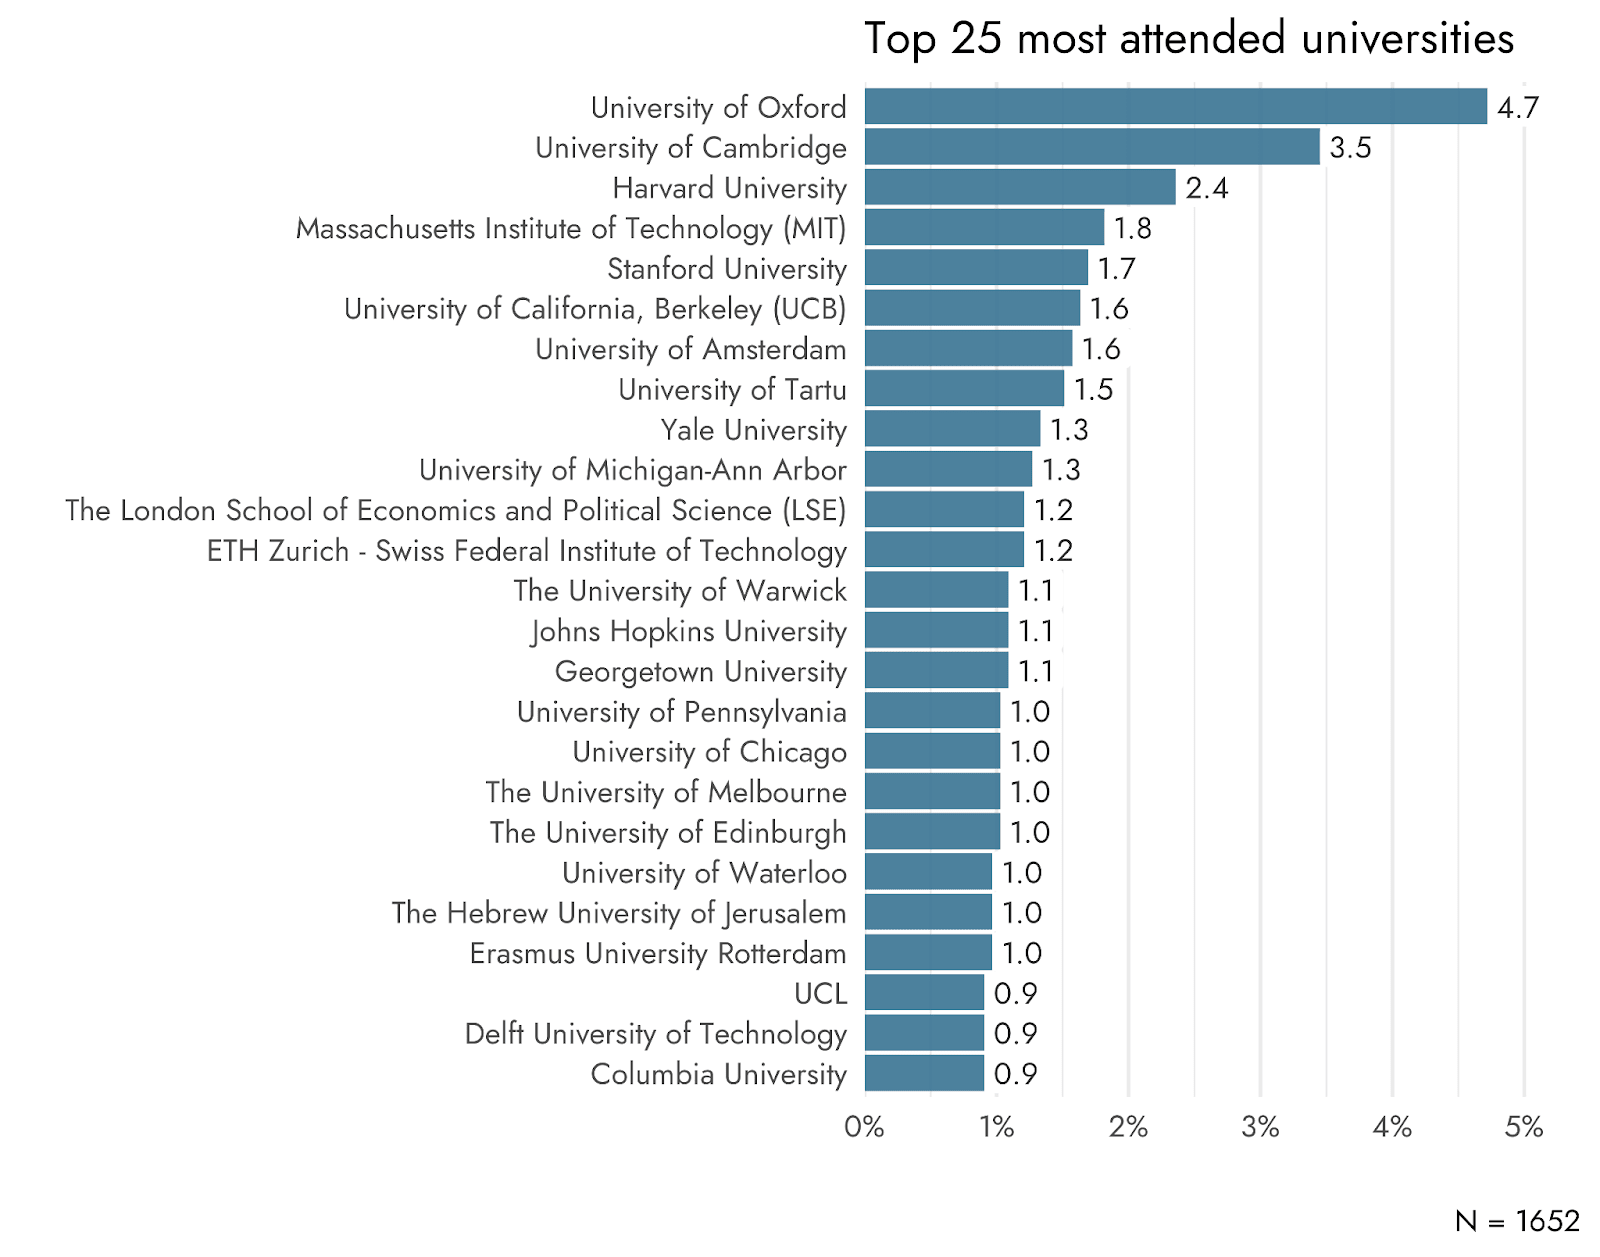
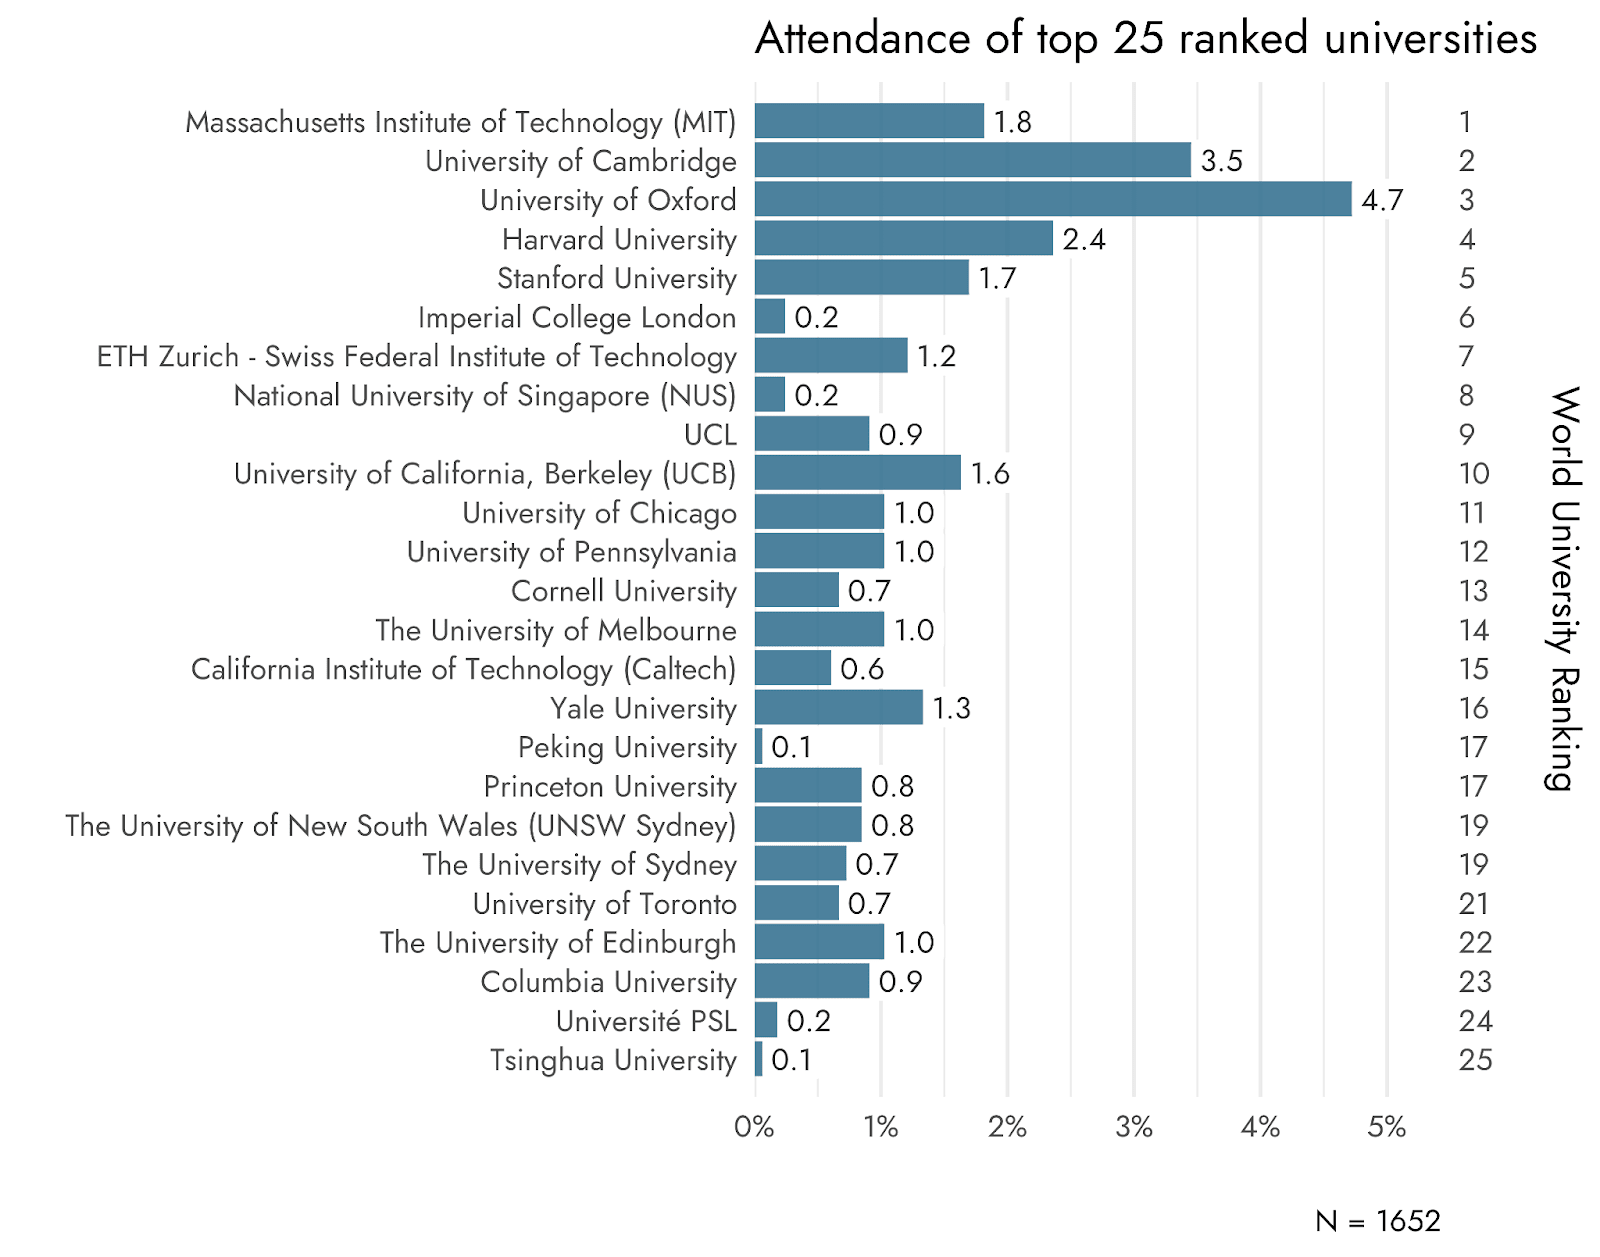
The graph below shows the percentages of the top 25 ranked universities. This similarly shows that a sizable number of attended universities are highly ranked. Highly ranked universities in non-English speaking countries appear to have somewhat lower numbers, relative to their rank.
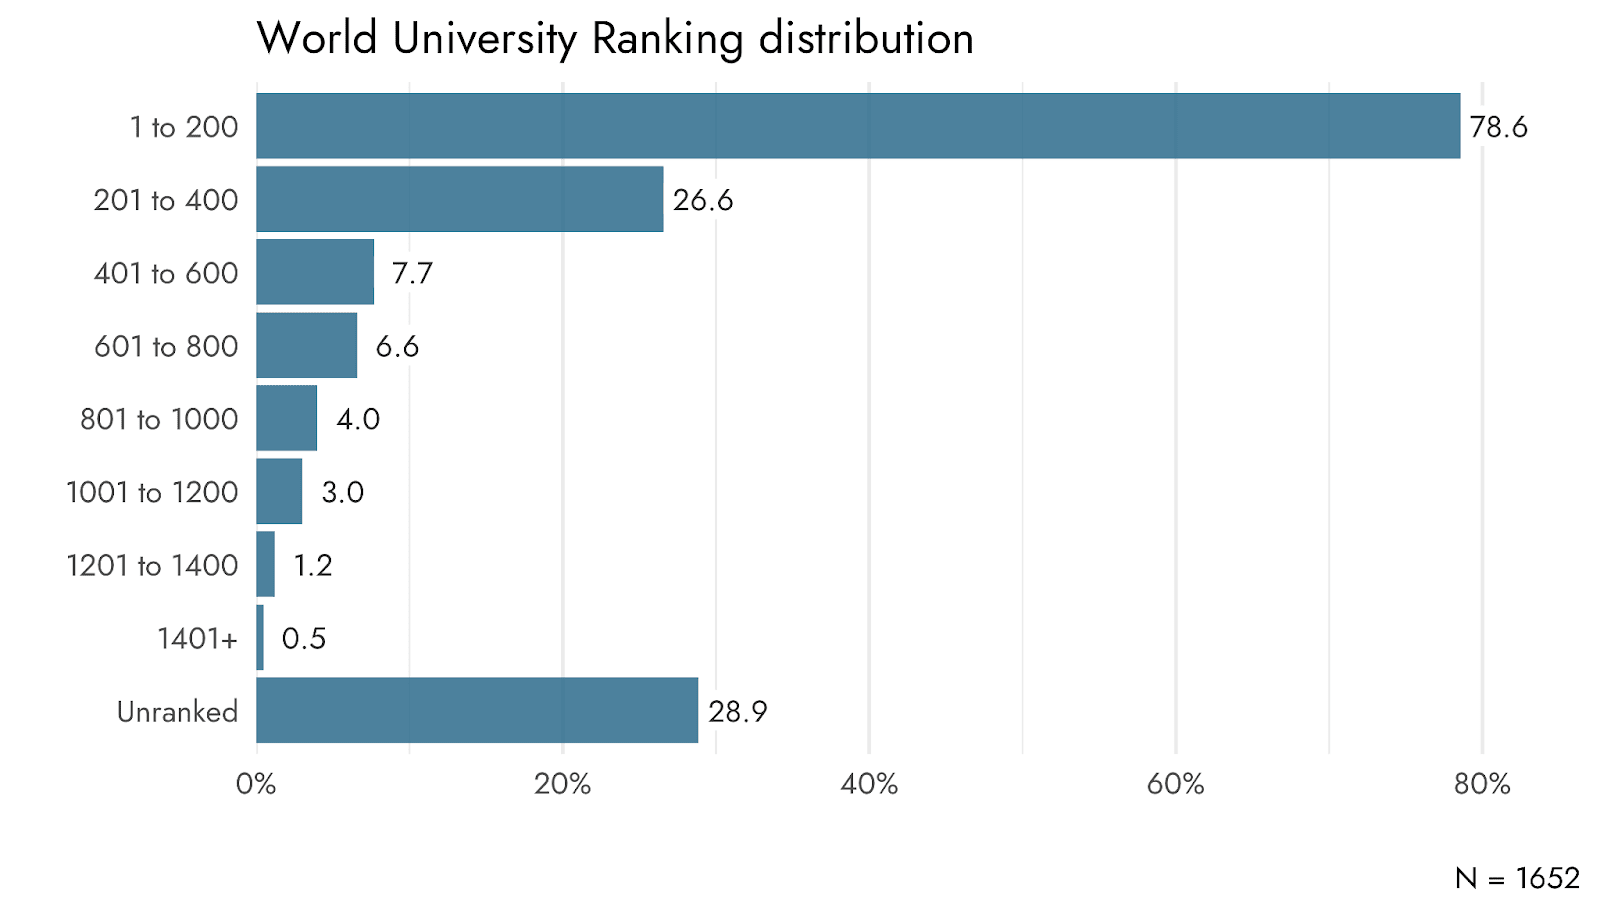
The high number of highly ranked universities is particularly visible when inspecting the proportion of universities by ranking category. The graph below shows that almost 80% of the respondents who reported a university report a university that is in the top 200.
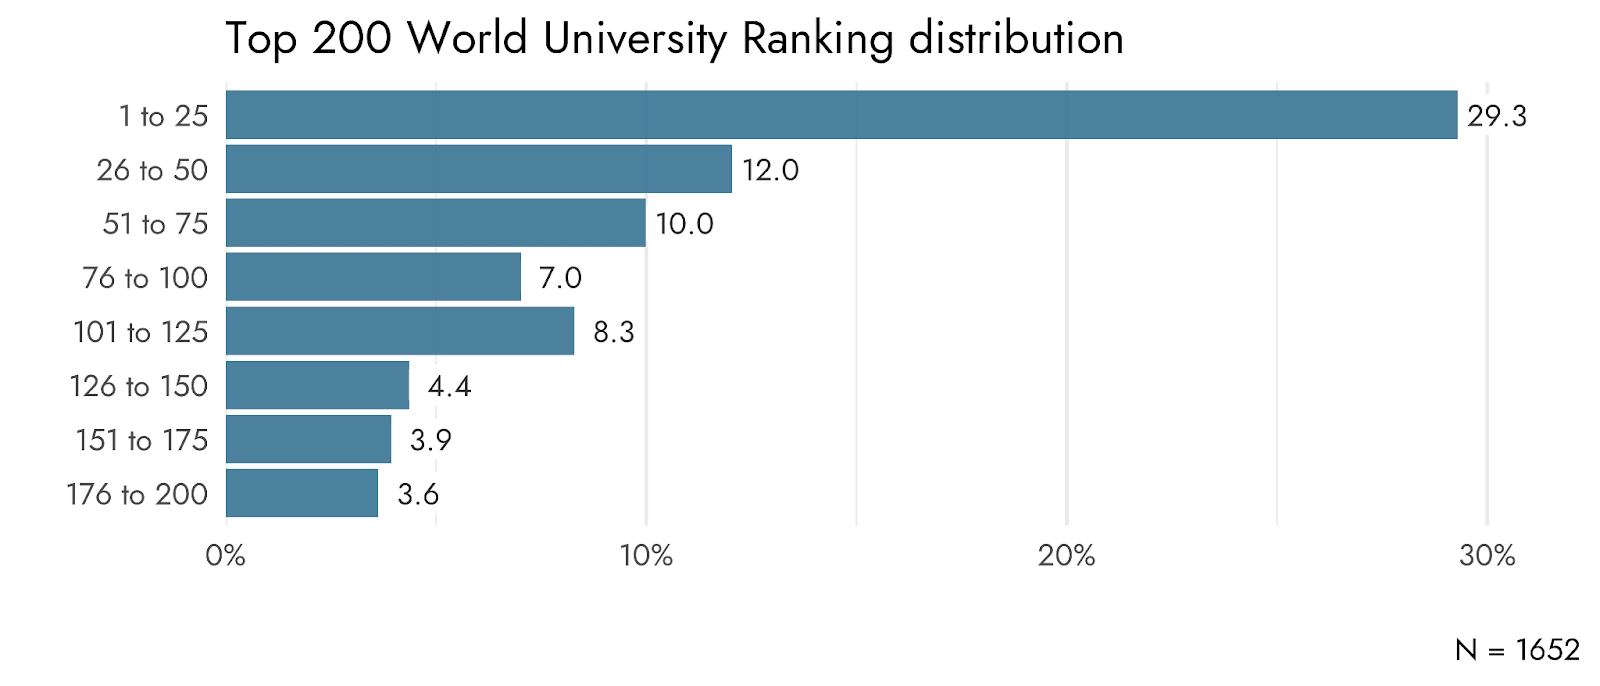
In this more fine-grained plot, we see that almost 30% of the respondents report having attended a university that is ranked in the top 25.
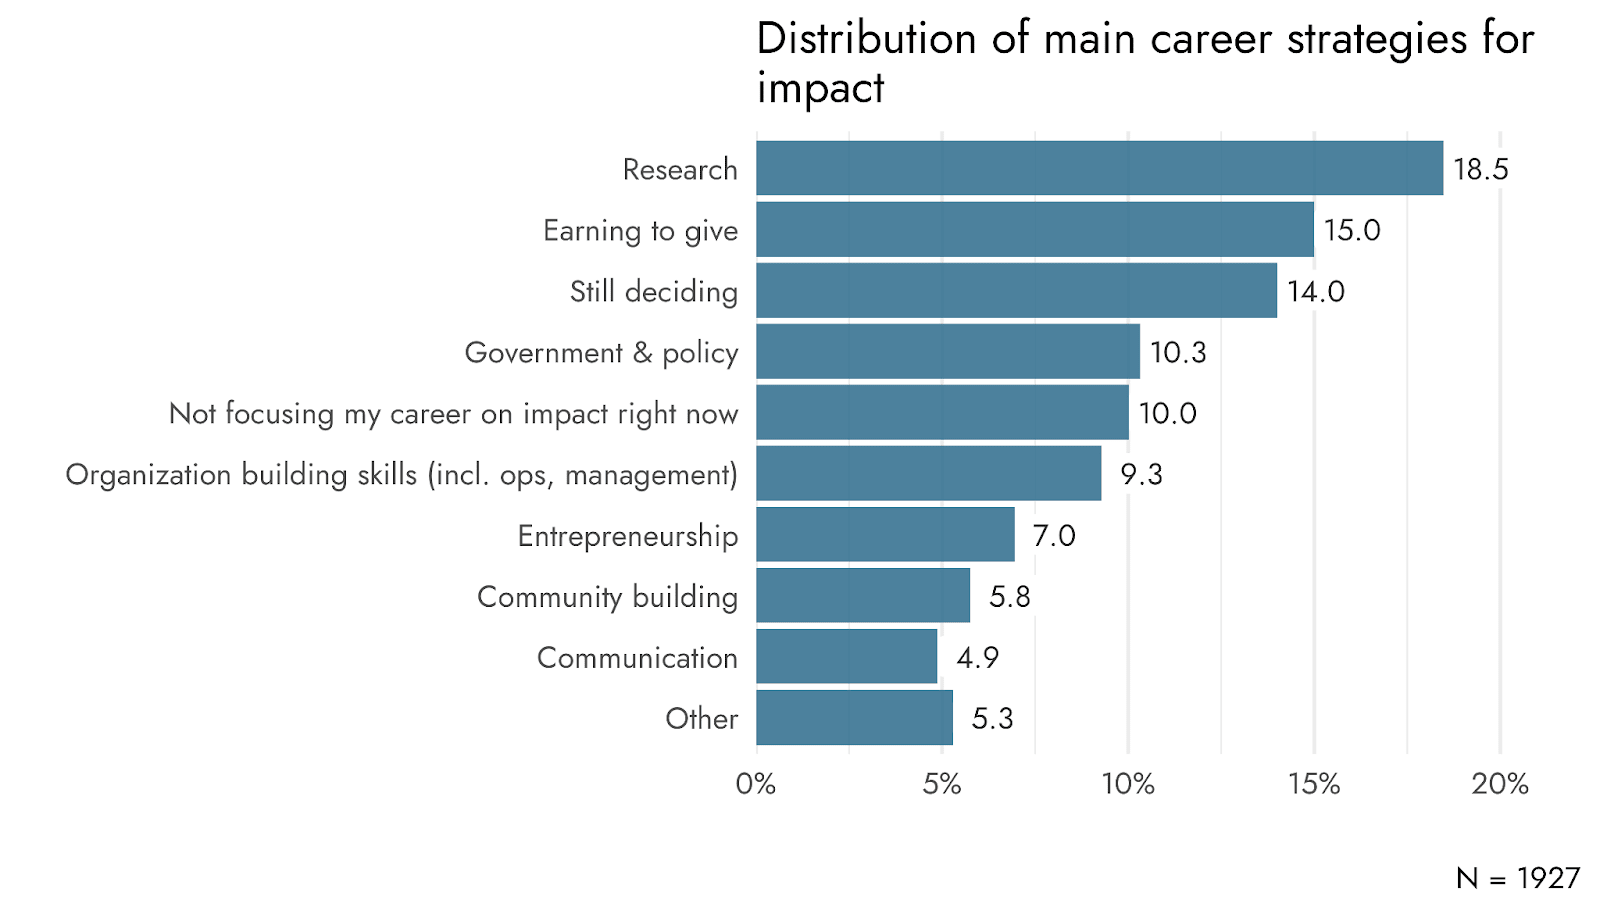
Career strategy
Respondents were asked what they consider to be their main strategy for impact in their career, allowing them to select from categories such as research, earning to give, and various other options. The most common main strategies for impact were research (18.5%) and earning to give (15%). A third large group of respondents reported that they were still deciding (14%).
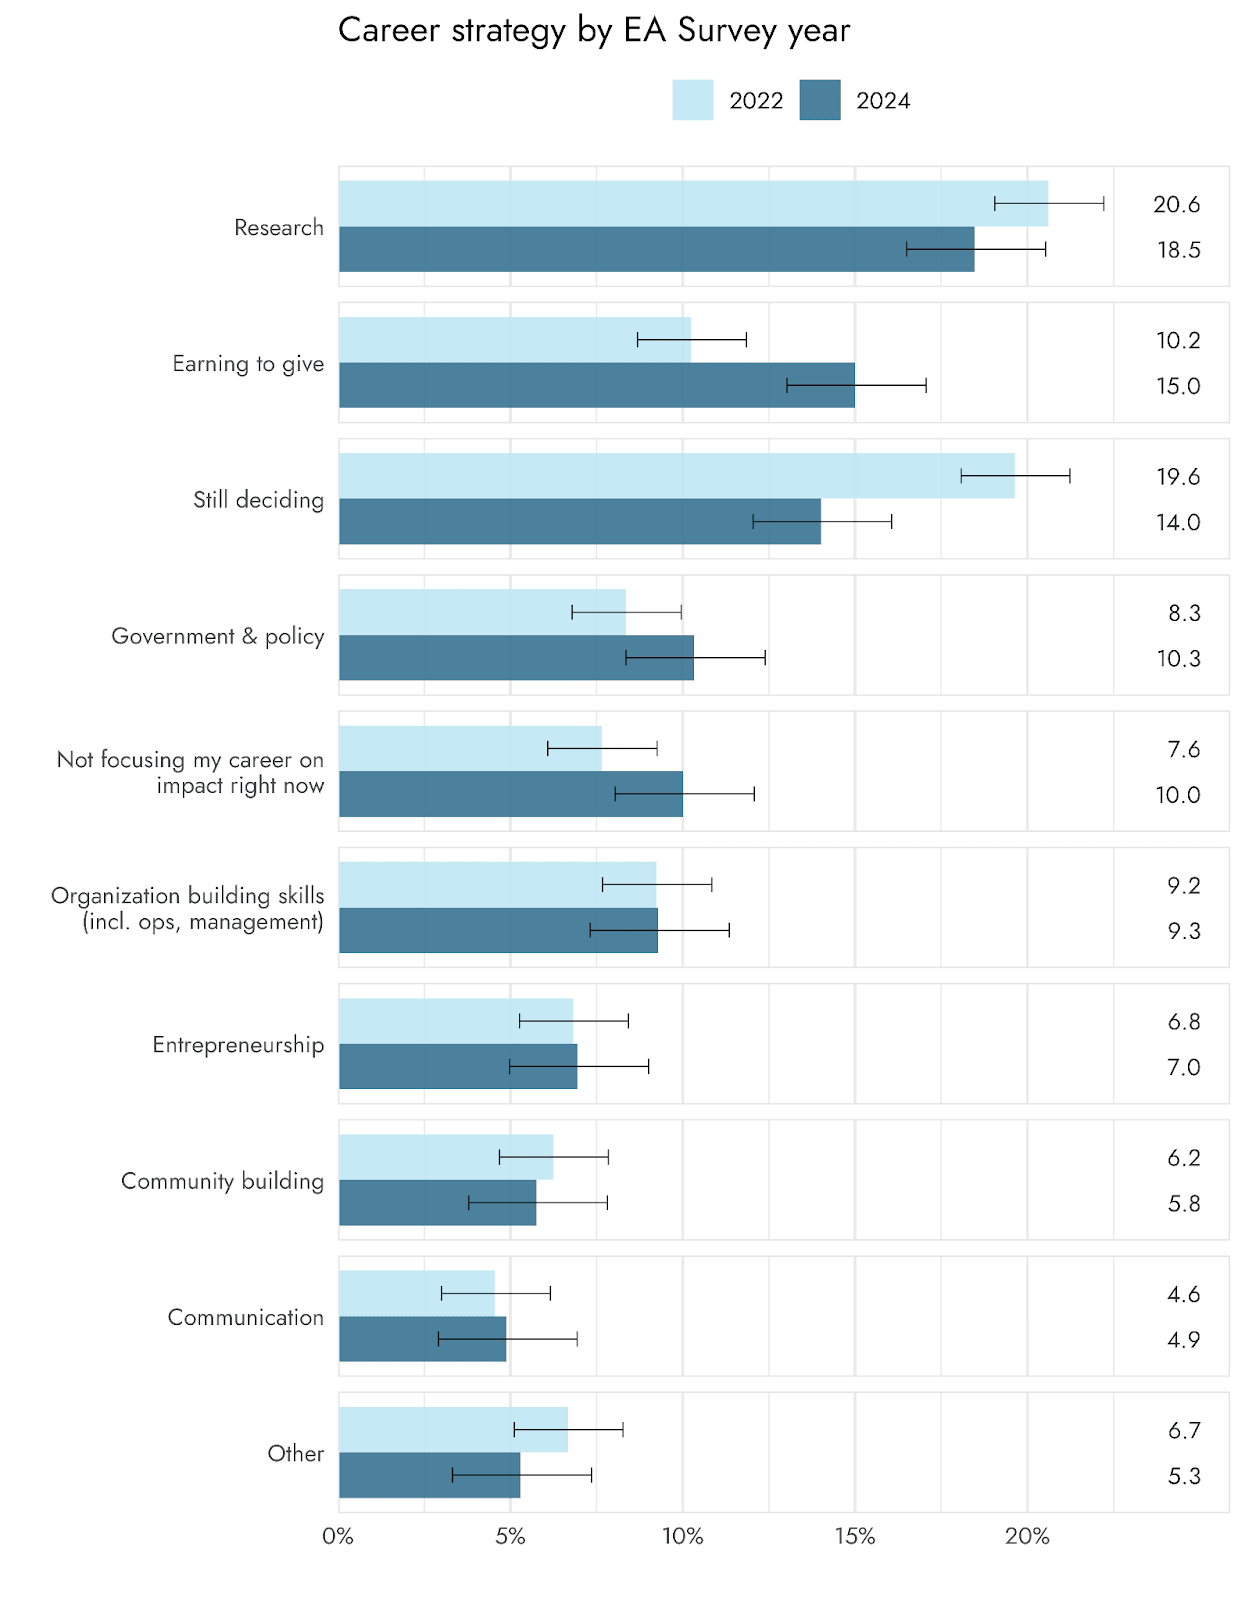
The career strategy question was also included in the previous EA Survey, allowing us to compare the results between the two surveys. Compared to 2022, we see an increase in the percentage of respondents who use earning to give as their main strategy for impact (from 10.2% to 15%). We also see a decrease in the percentage of respondents who are still deciding (from 19.6% to 14%), which may be explained by the respondents consisting of fewer students and/or being relatively older.
Below we observe several differences in career strategies of different genders. Notably we see more men following a career in research and using earning to give as their main strategy for impact. In contrast, we see that more women pursue organization building skills, community building, and communication. Women also appear to be more likely to pursue a career in government & policy, although this difference is not statistically significant.
Last time we did not observe any statistically significant differences between respondents identifying as White compared to other respondents. This time we observe a slightly higher percentage of White respondents pursuing earning to give compared to non-White respondents. No other statistically significant differences were found.
We again observed several large career strategy differences between low and high engagement EAs[3]. Highly engaged respondents were more likely to pursue a strategy in research, government & policy, organization building skills, entrepreneurship, and community building. Less engaged respondents were more likely to rely on earning to give and they were also more likely to not focus their career on impact at this time.
Approach to doing good
In addition to having asked the respondents about their career strategy, we also, for the first time, asked about their main approach to doing good. The majority of respondents reported that their main approach consists of working full time on an impactful cause (28.7%), effective giving (26.5%), and building skills to have impact in the future (26%). A minority of respondents mentioned working part time on an impactful cause (8.6%), not currently spending a significant amount of money or time on impact (6.5%), or ‘Other’ (3.7%).
We do not observe large differences in terms of gender regarding their main approach to doing good. We do see that more men focus on effective giving (29.3%) compared to women (21.1%) and there is also a small, but statistically significant difference, in working part time on an impactful cause between men (7.5%) and women (10.9%).
We observe more sizable differences regarding racial/ethnic identity. White respondents are less likely to have building skills to have impact in the future as their main approach to doing good compared to non-White respondents (23.5% vs. 34.5%), but are more likely to rely on effective giving (29.5% vs. 17.6%).
The largest differences are found between respondents who are highly engaged in EA and those who are less engaged. Highly engaged EAs are more likely to work full time on an impactful cause (42.4%) compared to less engaged EAs (11.7%), who are in turn more likely to rely on effective giving (37.8%) compared to highly engaged EAs (17.4%). Less engaged EAs are also more likely to not be spending a significant amount of their money or time on impact (11.3%) compared to highly engaged EAs (2.6%).
Beliefs
Politics
The EA community is largely left-leaning (70%), with a very small number of respondents identifying as right-leaning (4.5%). A larger portion of respondents, compared to right-leaning respondents, reported being Libertarian (7.3%) or in the center (11.9%).
The political orientation question was included in the EA Survey since 2014 (but omitted in the 2020 survey), allowing us to see how the distribution has changed over the last decade. Notably, we see a reduction in the percentage of (fully) left-leaning respondents from 2022 to 2024. We also see that the percentage of center-left leaning respondents has steadily increased over the years, while the percentage of libertarian respondents has decreased compared to the earlier years (and has remained fairly constant over the last several years).
Diet
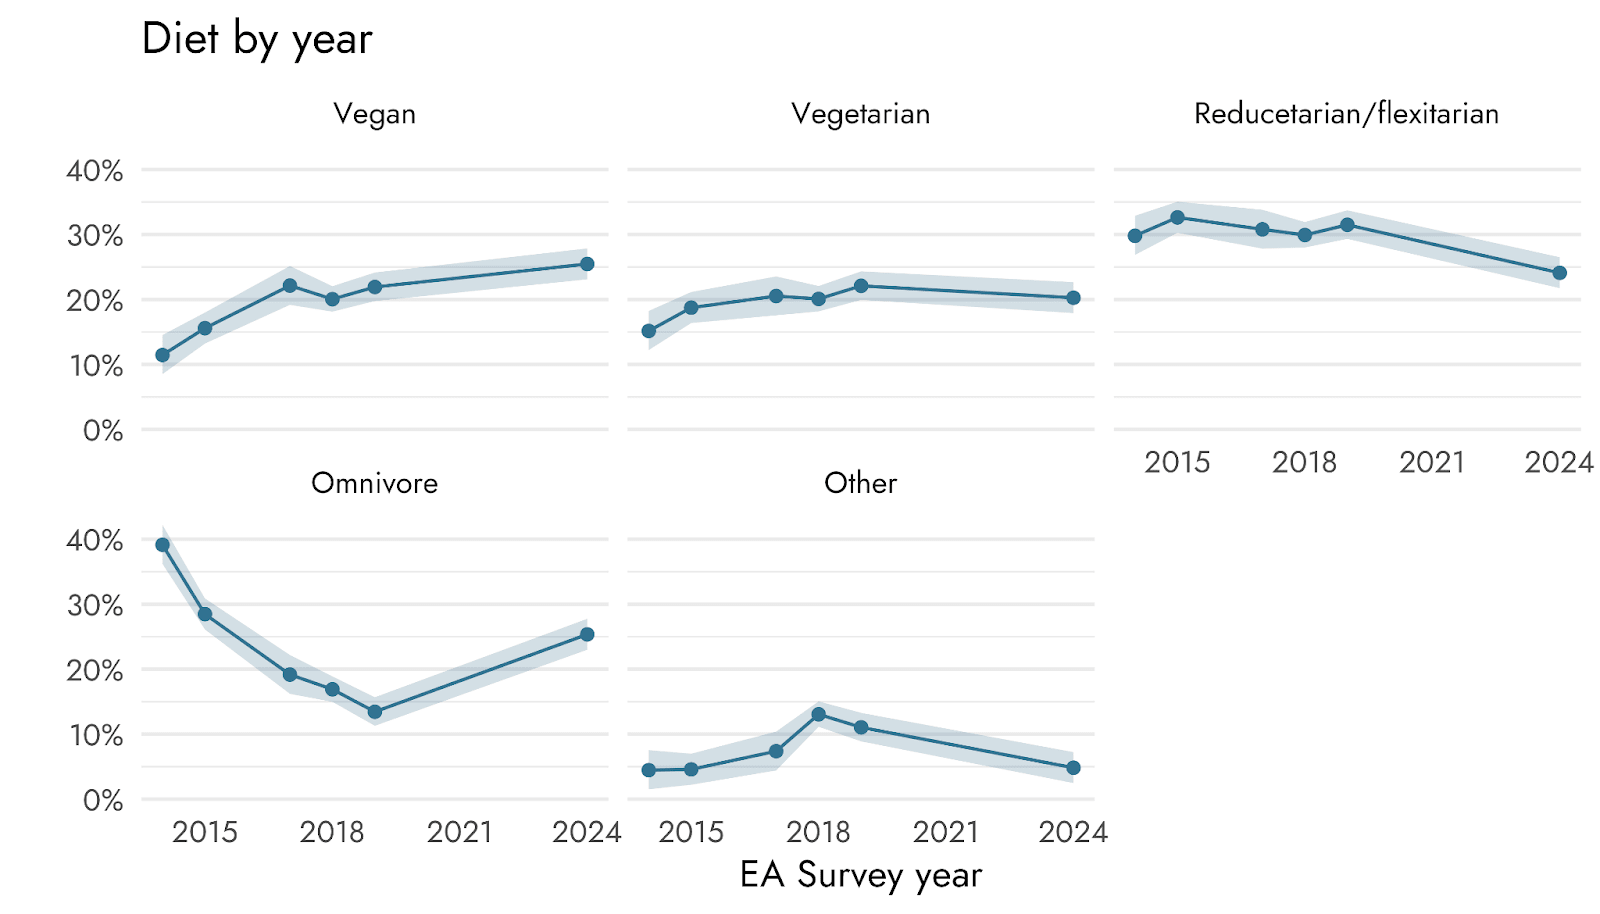
This year we again included a question about diet, which was last included in the 2019 EA Survey. In contrast to general population patterns, the EA community shows notably high rates of vegan (25.5%) and vegetarian (20.3%) diets. The remainder of respondents were roughly equally distributed between reducetarian/flexitarian approaches (24.1%) and omnivorous diets (25.4%).
Previous versions of the EA Survey used different categories for dietary preferences, such as 'Meat eater' rather than 'Omnivore’. We can analyze trends in dietary choices over time by standardizing these categories to match the most recent survey's categories[4]. After doing this, we see that there has been an increase in the percentage of respondents with vegan diets and a smaller increase, but recently stagnant, in the percentage of vegetarian diets. Surprisingly, there has been both a decrease in reducetarian/flexitarian diets and an increase in an omnivore diet, at least between 2019 and 2024. However, this may be due the different categories being used in different EA Surveys (e.g., labelling yourself as trying to reduce meat may sound less demanding than labelling oneself a reducetarian).
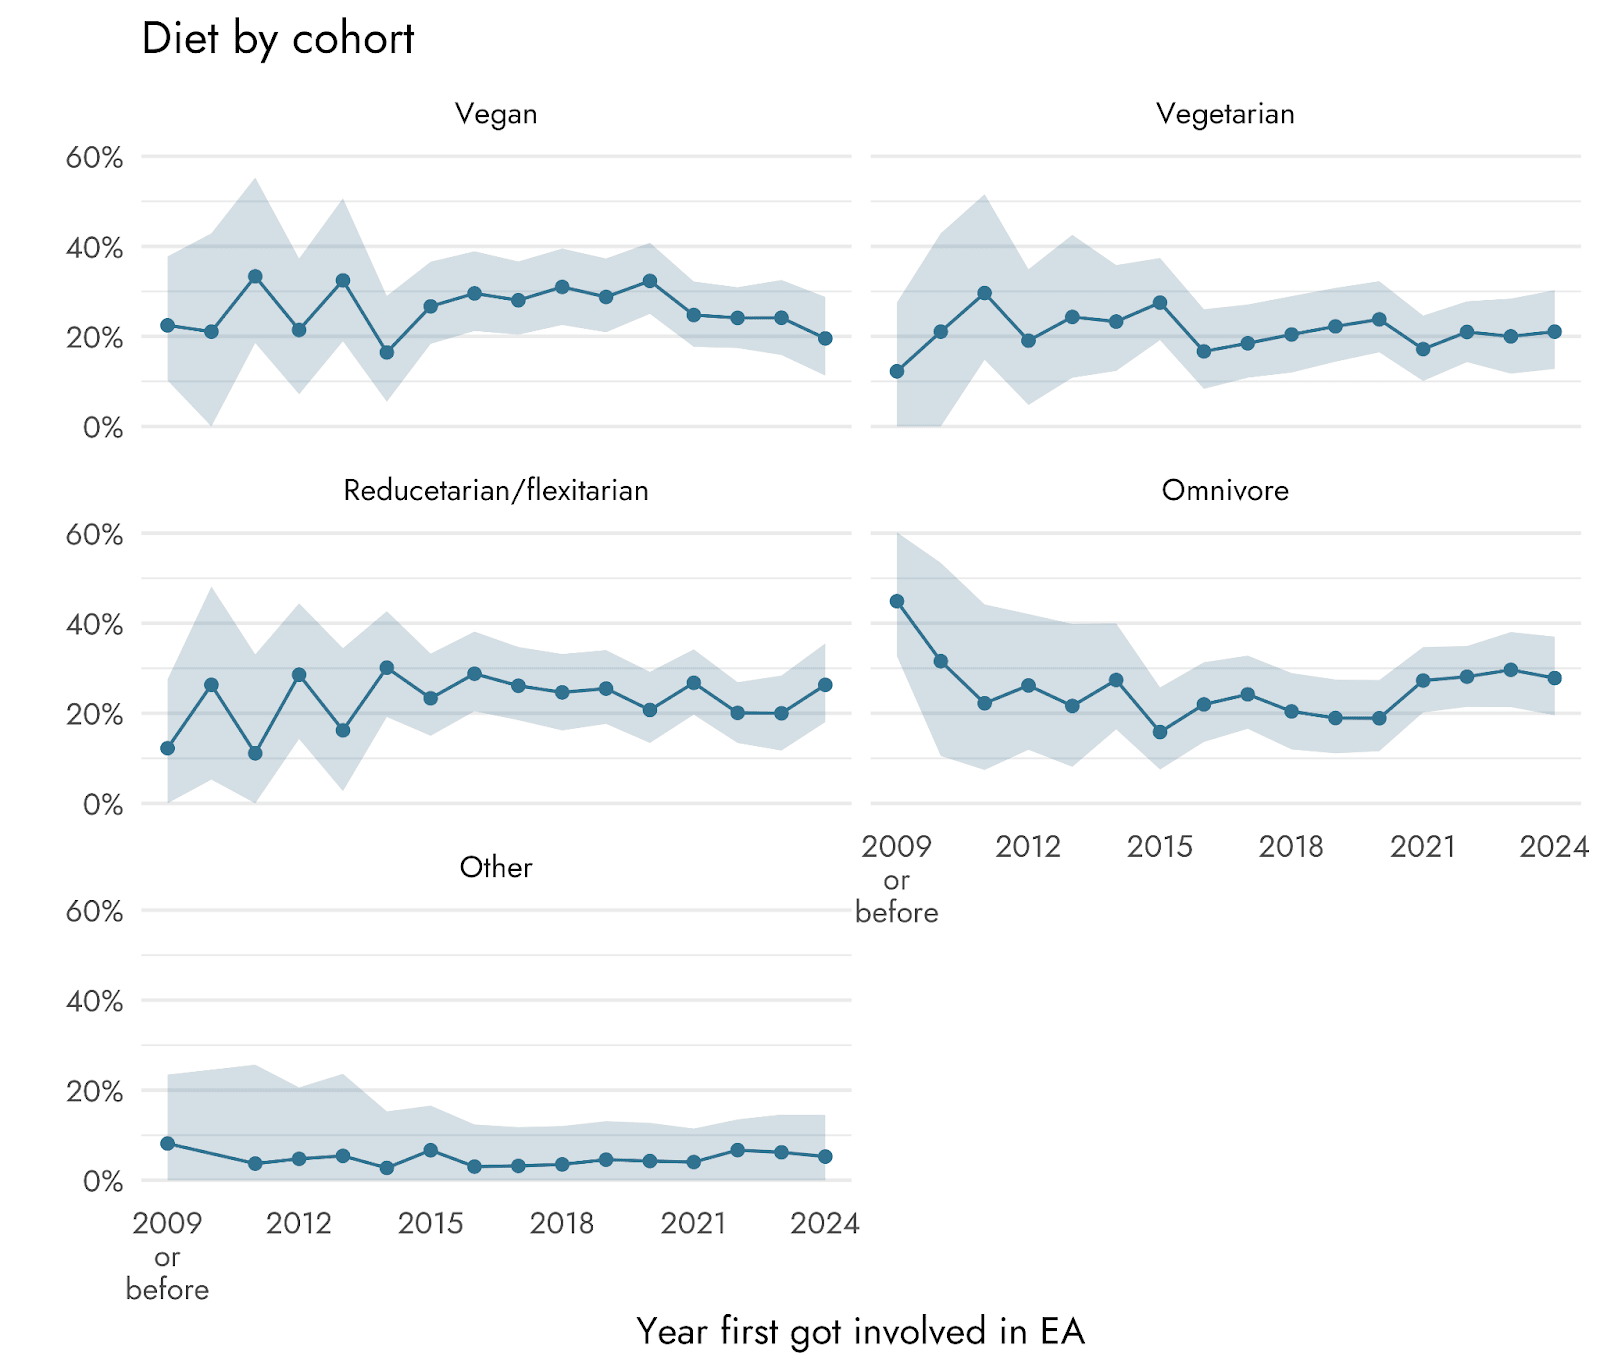
We do not find any patterns that jump out when looking at the percentage of diets by cohort.

This post was written by David Moss and Willem Sleegers. We thank all of the survey respondents for taking the time to complete the survey, as well as Laura Duffy, Ula Zarosa, and Oscar Delaney for their feedback on this post.
Rethink Priorities is a think-and-do tank dedicated to informing decisions made by high-impact organizations and funders across various cause areas. We invite you to explore our research database and stay updated on new work by subscribing to our newsletter.
Appendix
Appendix 1: Gender distribution table
| Gender | n | % | 95% CI |
| 2024 | |||
| Man | 1318 | 68.8% | [66.7%, 70.9%] |
| Woman | 504 | 26.3% | [24.2%, 28.4%] |
| Other | 94 | 4.9% | [2.8%, 7.0%] |
| 2022 | |||
| Man | 2149 | 66.2% | [64.6%, 67.9%] |
| Woman | 950 | 29.3% | [27.6%, 31.0%] |
| Other | 146 | 4.5% | [2.8%, 6.2%] |
| 2020 | |||
| Man | 1143 | 70.5% | [68.3%, 72.8%] |
| Woman | 429 | 26.5% | [24.2%, 28.8%] |
| Other | 49 | 3.0% | [0.8%, 5.3%] |
| 2019 | |||
| Man | 1482 | 70.2% | [68.2%, 72.2%] |
| Woman | 580 | 27.5% | [25.5%, 29.5%] |
| Other | 49 | 2.3% | [0.3%, 4.3%] |
| 2018 | |||
| Man | 1799 | 67.9% | [66.1%, 69.7%] |
| Woman | 789 | 29.8% | [28.0%, 31.6%] |
| Other | 63 | 2.4% | [0.6%, 4.2%] |
| 2017 | |||
| Man | 833 | 71.8% | [69.2%, 74.5%] |
| Woman | 303 | 26.1% | [23.5%, 28.8%] |
| Other | 24 | 2.1% | [0.0%, 4.7%] |
| 2015 | |||
| Man | 1411 | 73.8% | [71.8%, 75.8%] |
| Woman | 462 | 24.2% | [22.2%, 26.2%] |
| Other | 38 | 2.0% | [0.0%, 4.0%] |
| 2014 | |||
| Man | 655 | 75.9% | [73.1%, 78.8%] |
| Woman | 194 | 22.5% | [19.7%, 25.4%] |
| Other | 14 | 1.6% | [0.0%, 4.5%] |
Appendix 2: Racial/ethnic identity distribution table
| Racial/ethnic identity | n | % | 95% CI |
| 2024 | |||
| White | 1399 | 75.0% | [73.0%, 77.0%] |
| Other than White | 467 | 25.0% | [23.0%, 27.0%] |
| 2022 | |||
| White | 2464 | 78.0% | [76.6%, 79.5%] |
| Other than White | 694 | 22.0% | [20.6%, 23.5%] |
| 2020 | |||
| White | 1278 | 81.5% | [79.6%, 83.4%] |
| Other than White | 291 | 18.5% | [16.7%, 20.5%] |
| 2019 | |||
| White | 1691 | 80.5% | [78.9%, 82.2%] |
| Other than White | 409 | 19.5% | [17.8%, 21.2%] |
| 2018 | |||
| White | 2179 | 83.4% | [81.9%, 84.8%] |
| Other than White | 435 | 16.6% | [15.2%, 18.1%] |
| 2017 | |||
| White | 997 | 88.5% | [86.7%, 90.3%] |
Appendix 3: Age distribution table
| Year | Mean age | Median age |
| 2014 | 27.36 | 25 |
| 2015 | 28.36 | 26 |
| 2017 | 29.68 | 27 |
| 2018 | 30.95 | 28 |
| 2019 | 30.67 | 28 |
| 2020 | 29.66 | 27 |
| 2022 | 30.64 | 29 |
| 2024 | 32.44 | 31 |
- ^
We plan to address findings on nationality in a dedicated follow-up post (e.g., see EA Survey 2022: Geography)
- ^
For example, CEA formalized the Community Health team as one of their main projects, and published their stance on diversity and inclusion in 2018.
- ^
We categorized as “high” engagement those who were 4-5/5 on this scale and “low” engagement, anyone who selected 1-3/5 on that scale.
- ^
We standardized the responses as follows:
- “Meat-eating” into “Omnivore”
- “Near vegetarian” into “Reducetarian/flexitarian”
- "Reducing the amount of meat I eat" into "Reducetarian/flexitarian"
- "Eat meat, but try to reduce the amount I eat" into "Reducetarian/flexitarian"
- "Eat meat, but try to reduce the amount i eat" into “Reducetarian/flexitarian"
- "Meat eater" into "Omnivore"
- "Pescetarian" into "Other"
- "Eat meat" into "Omnivore"
titotal @ 2025-02-28T13:54 (+15)
If I'm reading this right, there was a ~40% drop in the number of respondents in 2024 compared to 2022?
I think this gives cause to be careful when interpreting the results: for example, from the graphs it might look like EA has succesfully recruited a few more centre-left people to the movement: but in absolute terms the number of centre leftists responding to the survey has decreased by about 300 people.
I think the decline in left identifying people is unlikely to be a case of mass political conversion: I think it's more likely that a large number of leftists have left the movement due to it's various recent scandals.
David_Moss @ 2025-03-03T14:45 (+17)
We can assess this empirically, to some extent, by looking at changes in respondents who we can track over time (i.e. those who logged in to their EA account to pull their previous responses or provided their email). This allows us both to compare both how many individuals with different political views in 2022 changed to different views in 2024 and how many people with different views in 2022 may have dropped out (because we can't track them in 2024[1]).
TLDR:
- Left respondents switch in quite large numbers to the Center-left, Center leftists show a smaller switch to the center, while Centrists showed no major shift.
- We see no signs of Leftists or Center leftists being more likely to dropout, but some weak evidence of Right and Center rightists being more likely to dropout.
You can see the total flows between categories on this Sankey diagram.[2]
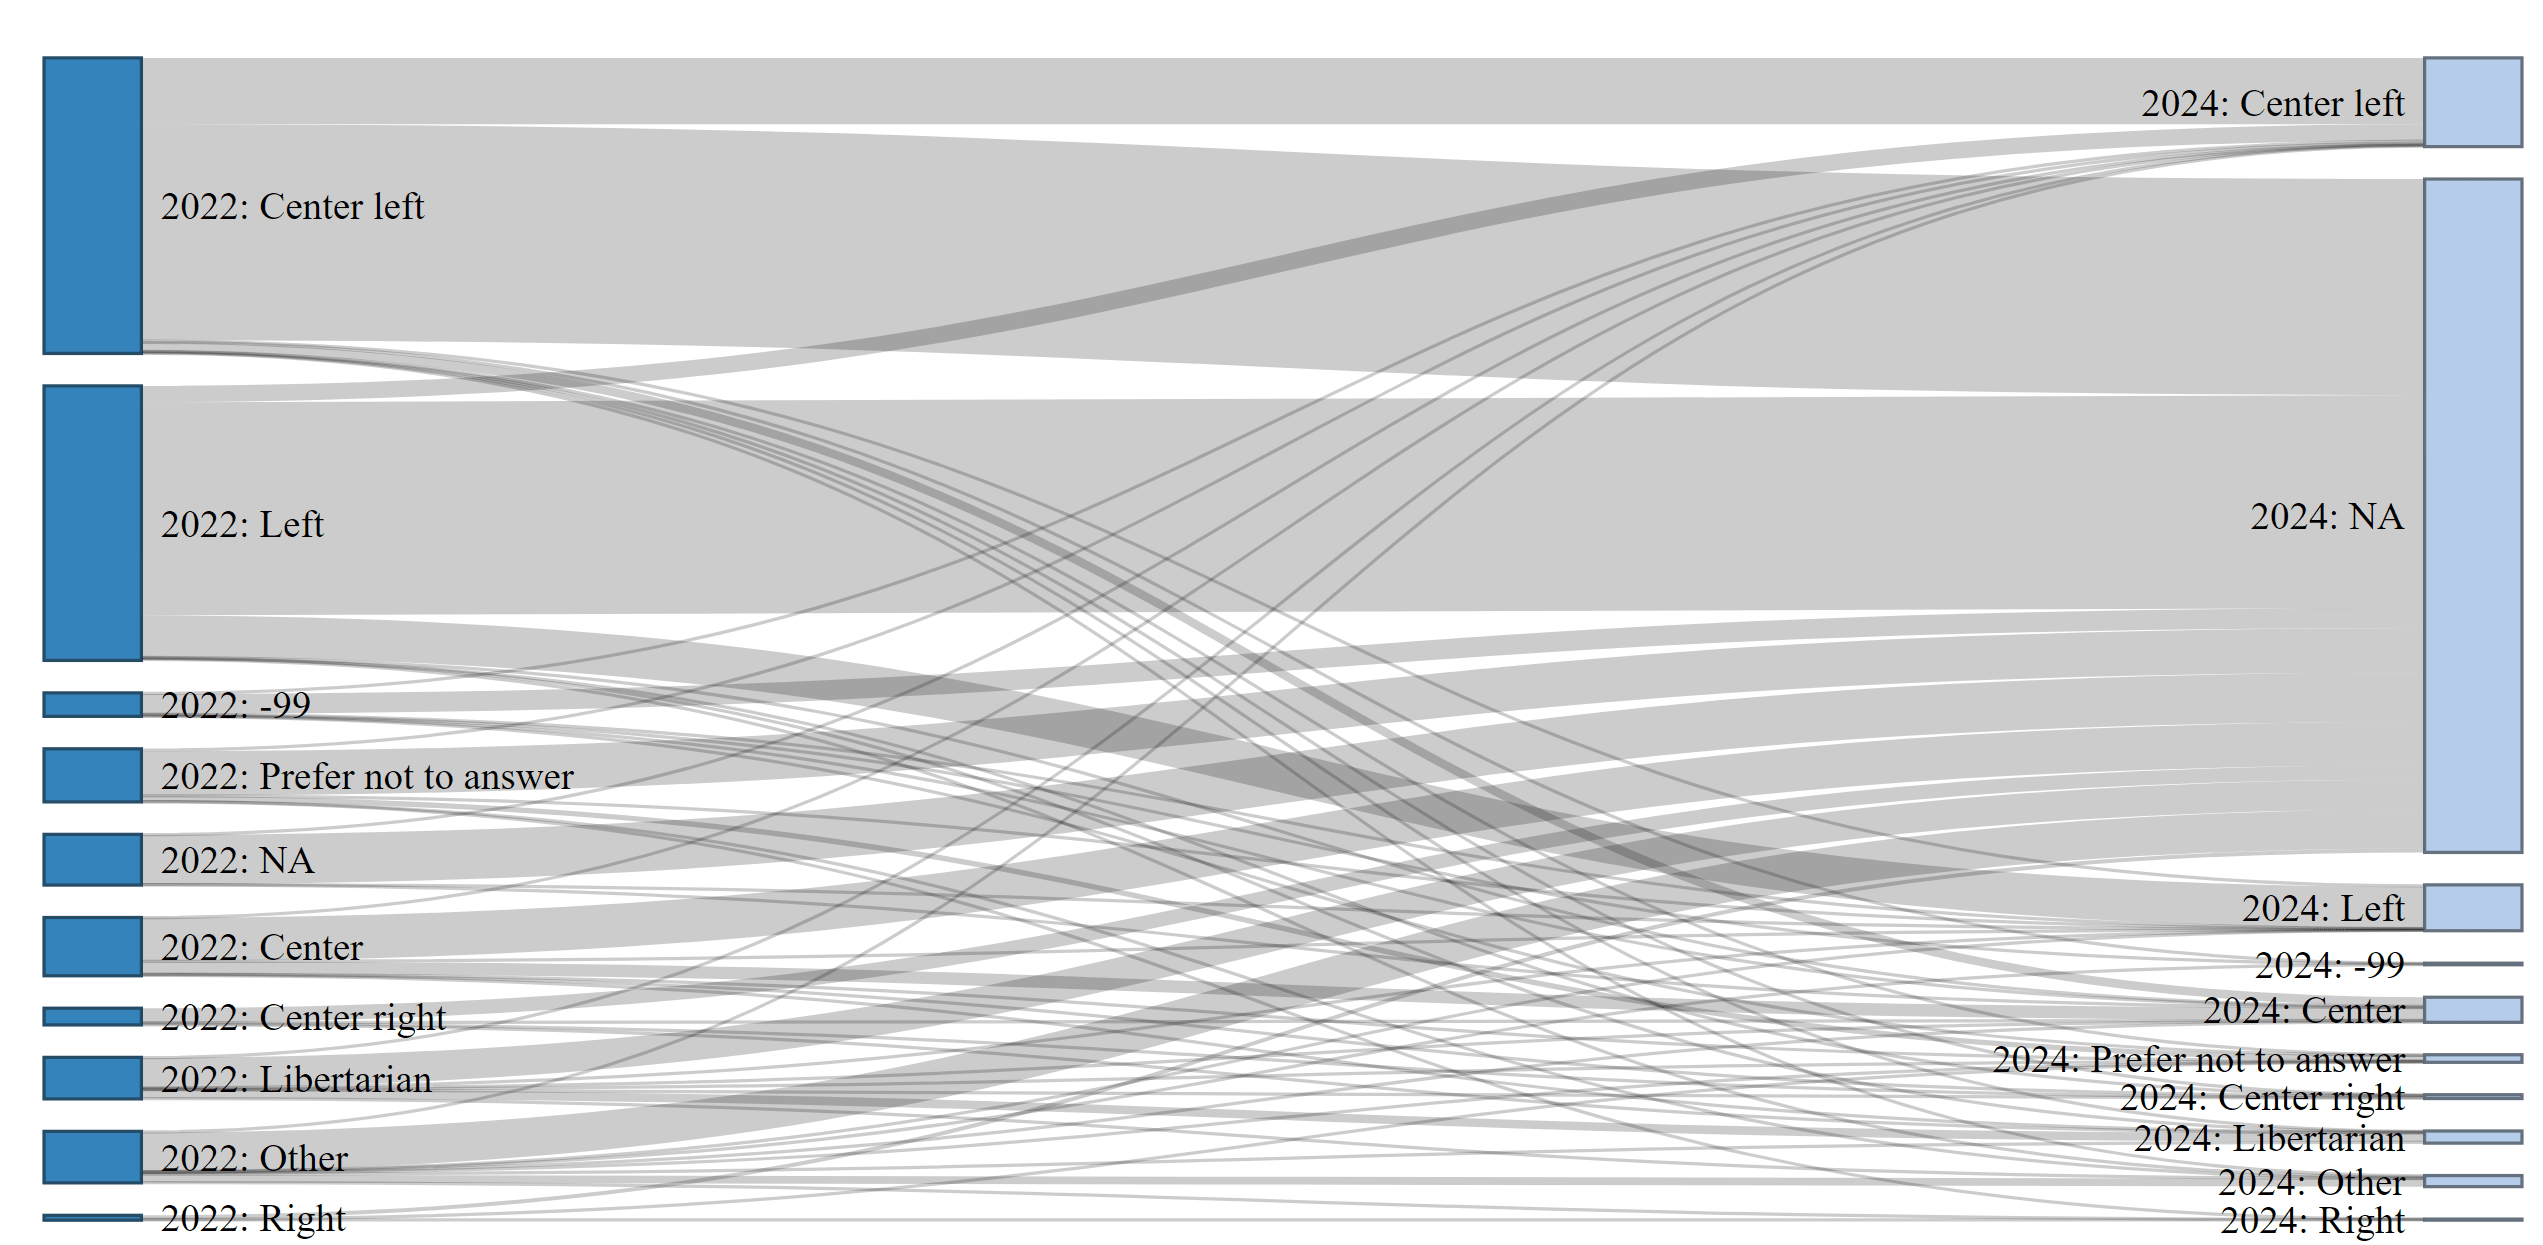
Due to the low numbers, it can be hard to compare the results for different categories though.
First, we can compare how many people switched to NA (i.e. were not tracked in 2024 who were in 2022).
We can see that there's very little difference between the Left (77%), Center Left (73%) and Center (74%). We do, however, see that Center right (85%) and Right (83%) respondents seem more likely to not appear in the 2024 dataset, though these are small groups due to the very low number of right-of-center respondents.[3]
| Switch to NA | |||
| Left | NA | 785 | 77.49% |
| Center left | NA | 788 | 72.76% |
| Center | NA | 155 | 73.81% |
| Center right | NA | 52 | 85.25% |
| Right | NA | 15 | 83.33% |
| Libertarian | NA | 109 | 71.71% |
| Other | NA | 144 | 75.39% |
| Prefer not to answer | NA | 165 | 83.76% |
| Did not answer | NA | 74 | 85.06% |
| Did not view | NA | 182 | 97.33% |
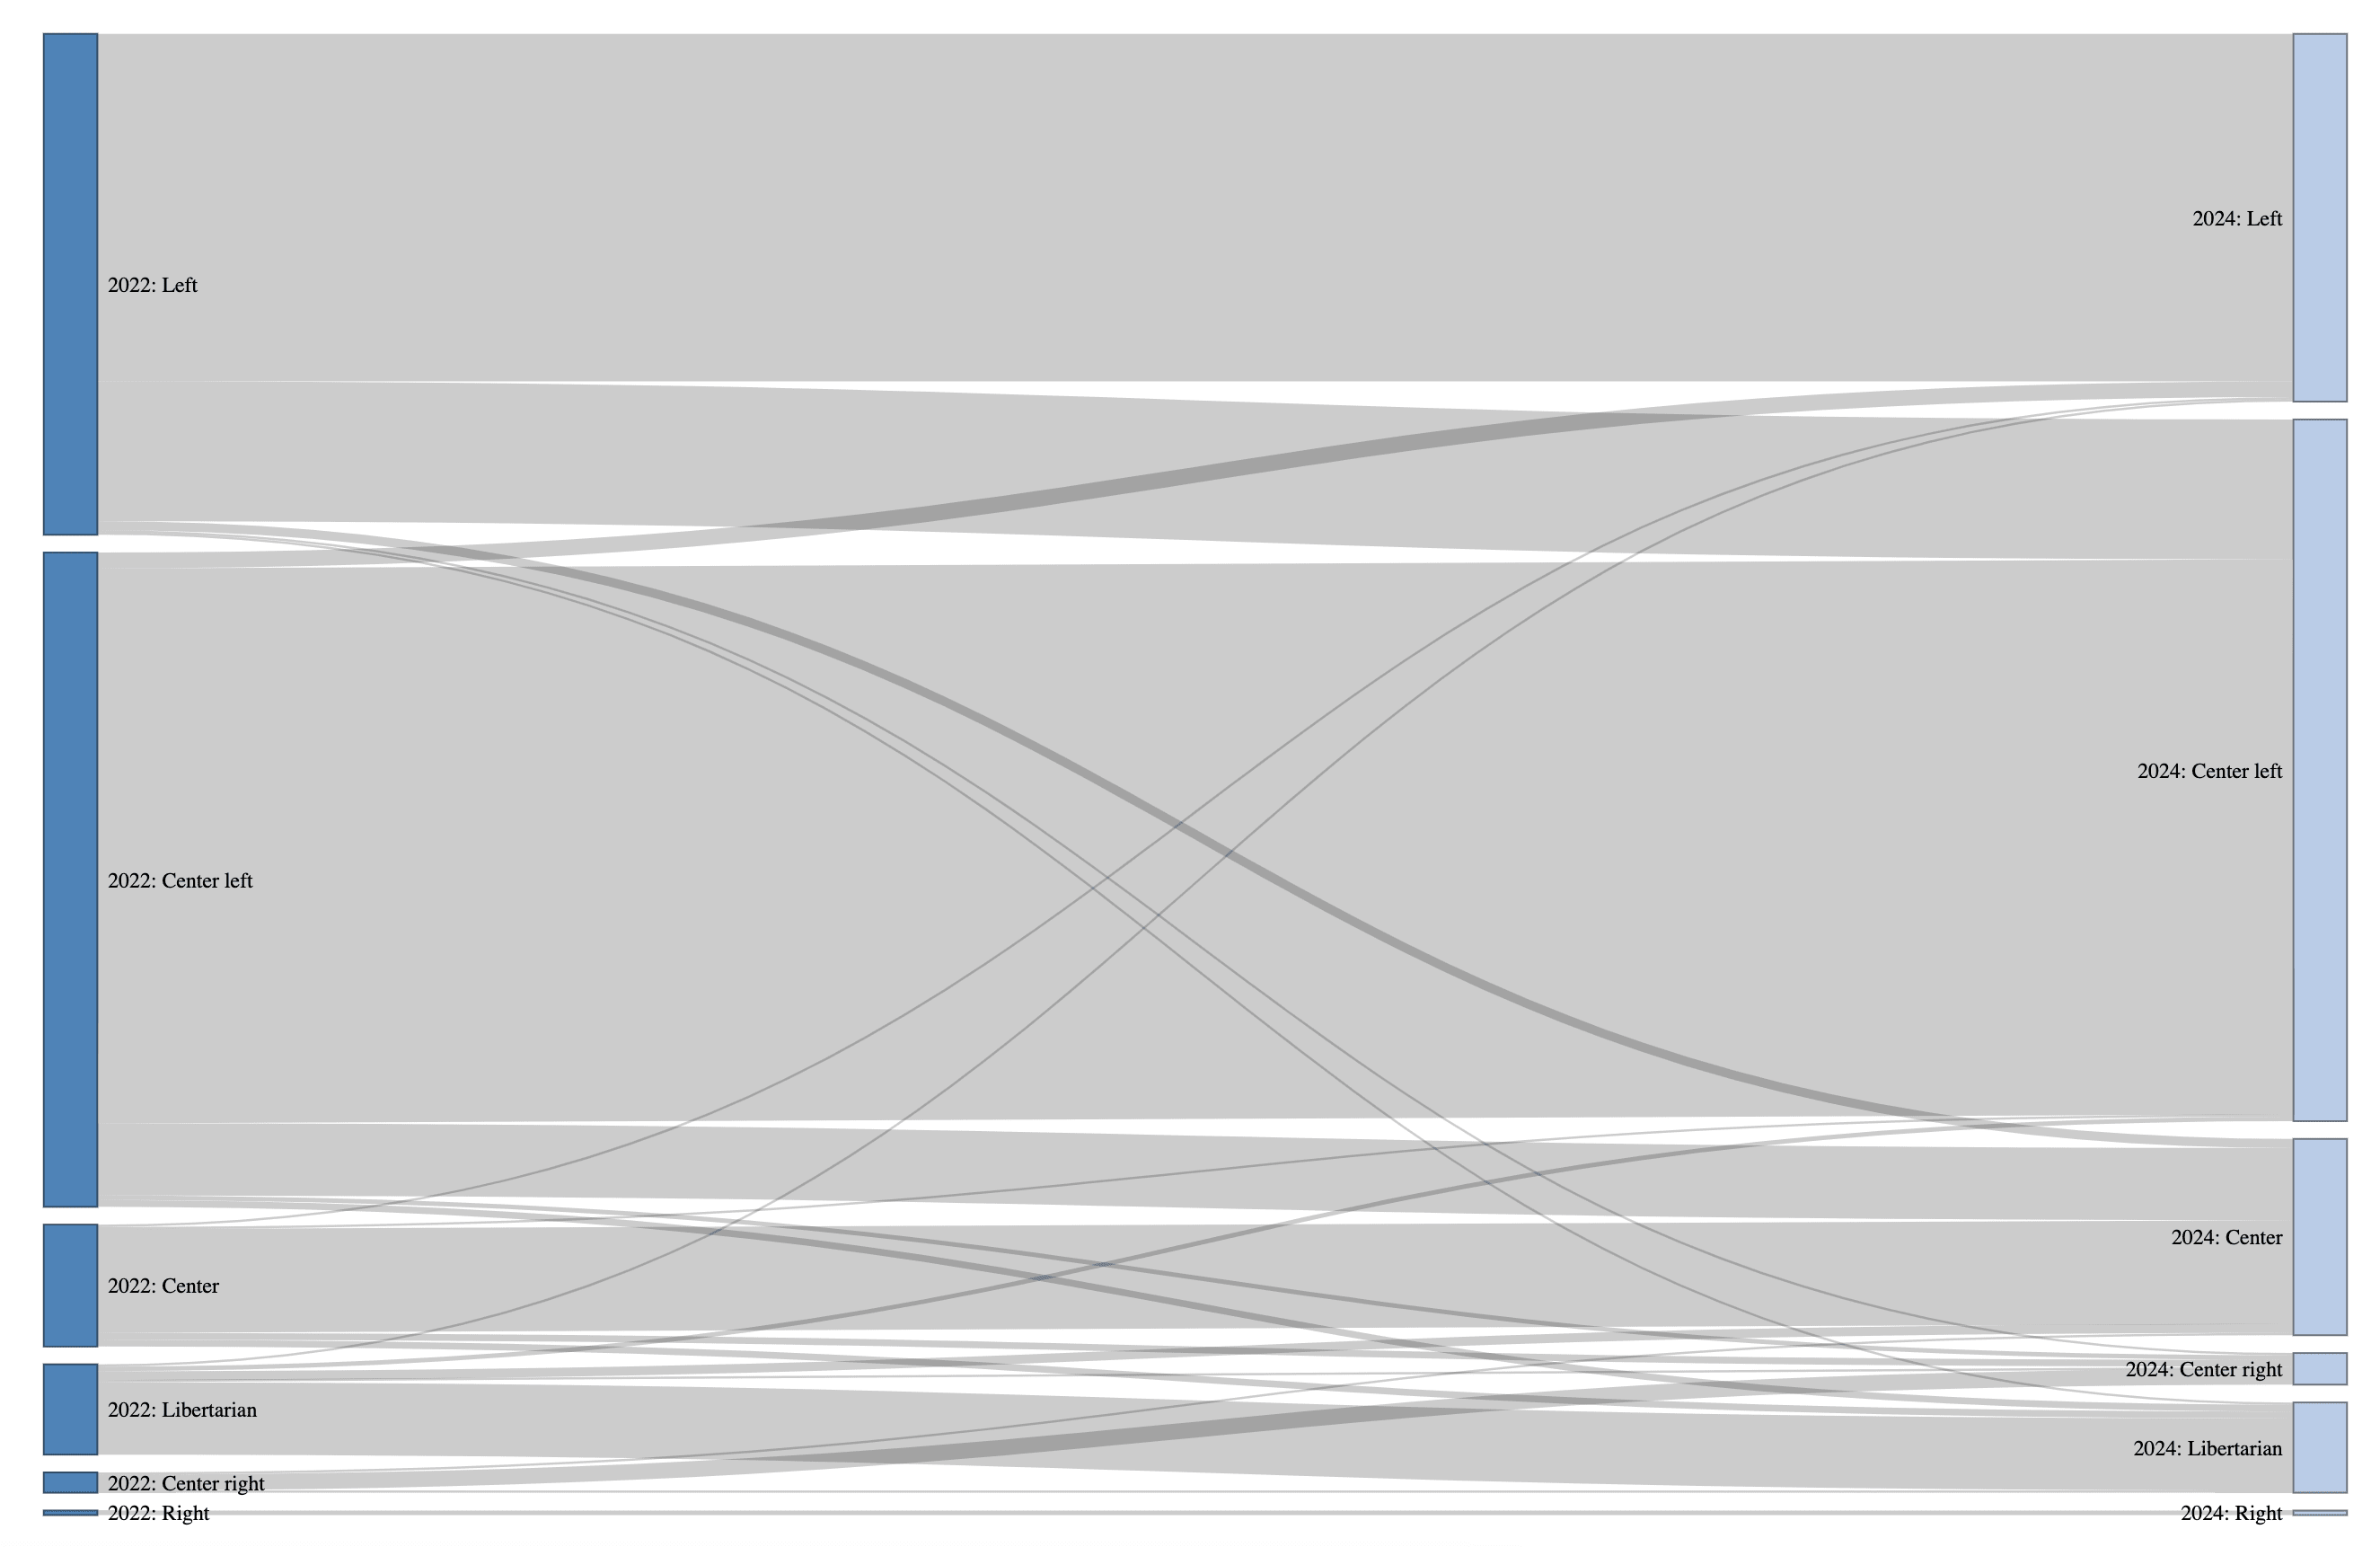
Then, we can compare changes in political views, setting aside the large number of NA-in-2024 responses, to see the changes more clearly. We can see quite a strong shift (27%) among Left (in 2022) respondents to the Center left (this compares to the total drop in Left respondents being 28.8%). Among the center left, we see a smaller but still noticeable switch to the Center, and for the Center, we see most respondents staying the same.[4]
| Non-NA switches | |||
| Left | Left | 154 | 67.54% |
| Left | Center left | 61 | 26.75% |
| Left | Center | 4 | 1.75% |
| Left | Center right | 1 | 0.44% |
| Left | Right | 0 | 0.00% |
| Left | Libertarian | 1 | 0.44% |
| Left | Other | 7 | 3.07% |
| 228 | |||
| Center left | Left | 7 | 2.40% |
| Center left | Center left | 246 | 84.25% |
| Center left | Center | 32 | 10.96% |
| Center left | Center right | 2 | 0.68% |
| Center left | Right | 0 | 0.00% |
| Center left | Libertarian | 3 | 1.03% |
| Center left | Other | 2 | 0.68% |
| 292 | |||
| Center | Left | 1 | 1.85% |
| Center | Center left | 1 | 1.85% |
| Center | Center | 46 | 85.19% |
| Center | Center right | 3 | 5.56% |
| Center | Right | 0 | 0.00% |
| Center | Libertarian | 3 | 5.56% |
| Center | Other | 0 | 0.00% |
| 54 |
These results aren't suggestive of leftists being particularly likely to drop out. But there is some evidence of Left respondents in 2022 switching in quite large numbers (similar to the total change in % Left) to the Center left in 2024.
- ^
Caveat: a respondent might not appear in 2024 because they dropped out of EA or they didn't take the survey or because they took the survey but didn't log in or provide the same email address as last time. Differential disappearance across groups might still be suggestive, however, since seem to be few innocent explanations for why leftists/rightists would systematically become less likely to take the survey or provide their email address across time.
It's also important to bear in mind that the sub-sample of respondents who logged in or provided their email address might differ from the total sample (e.g. they might be more engaged or more satisfied). But just over 90% of respondents in both 2022 and 2024 fit into this category, so it does not seem a very selective sub-sample.
- ^
NAs in 2022 include only people who did not reach the politics question of the survey, because this sub-sample includes only people who were tracked in the 2022 survey.
- ^
It makes sense that the various other categories for not answering the question would also show high rates of not answering the email question or not logging in.
- ^
Center right and Right not shown because, excluding NAs in 2024, this was only 9 and 3 respondents respectively (though most stayed in the their prior category).
Jason @ 2025-03-02T16:08 (+2)
Certainly plausible, but I'd note that the left percentage in 2022 was elevated from the trend line established by the three prior results. So the 2022 result could be largely noise. That still does leave a perceptible drop from the trendline vs. 2024, just not as pronounced.
Sarah Cheng @ 2025-02-28T18:41 (+8)
I'm excited to see an increase in the percentage of respondents doing earning to give! :) A lot of important work still needs funding, and I think effective giving is the most impactful option for many people.
Aaron Bergman @ 2025-03-01T20:33 (+7)
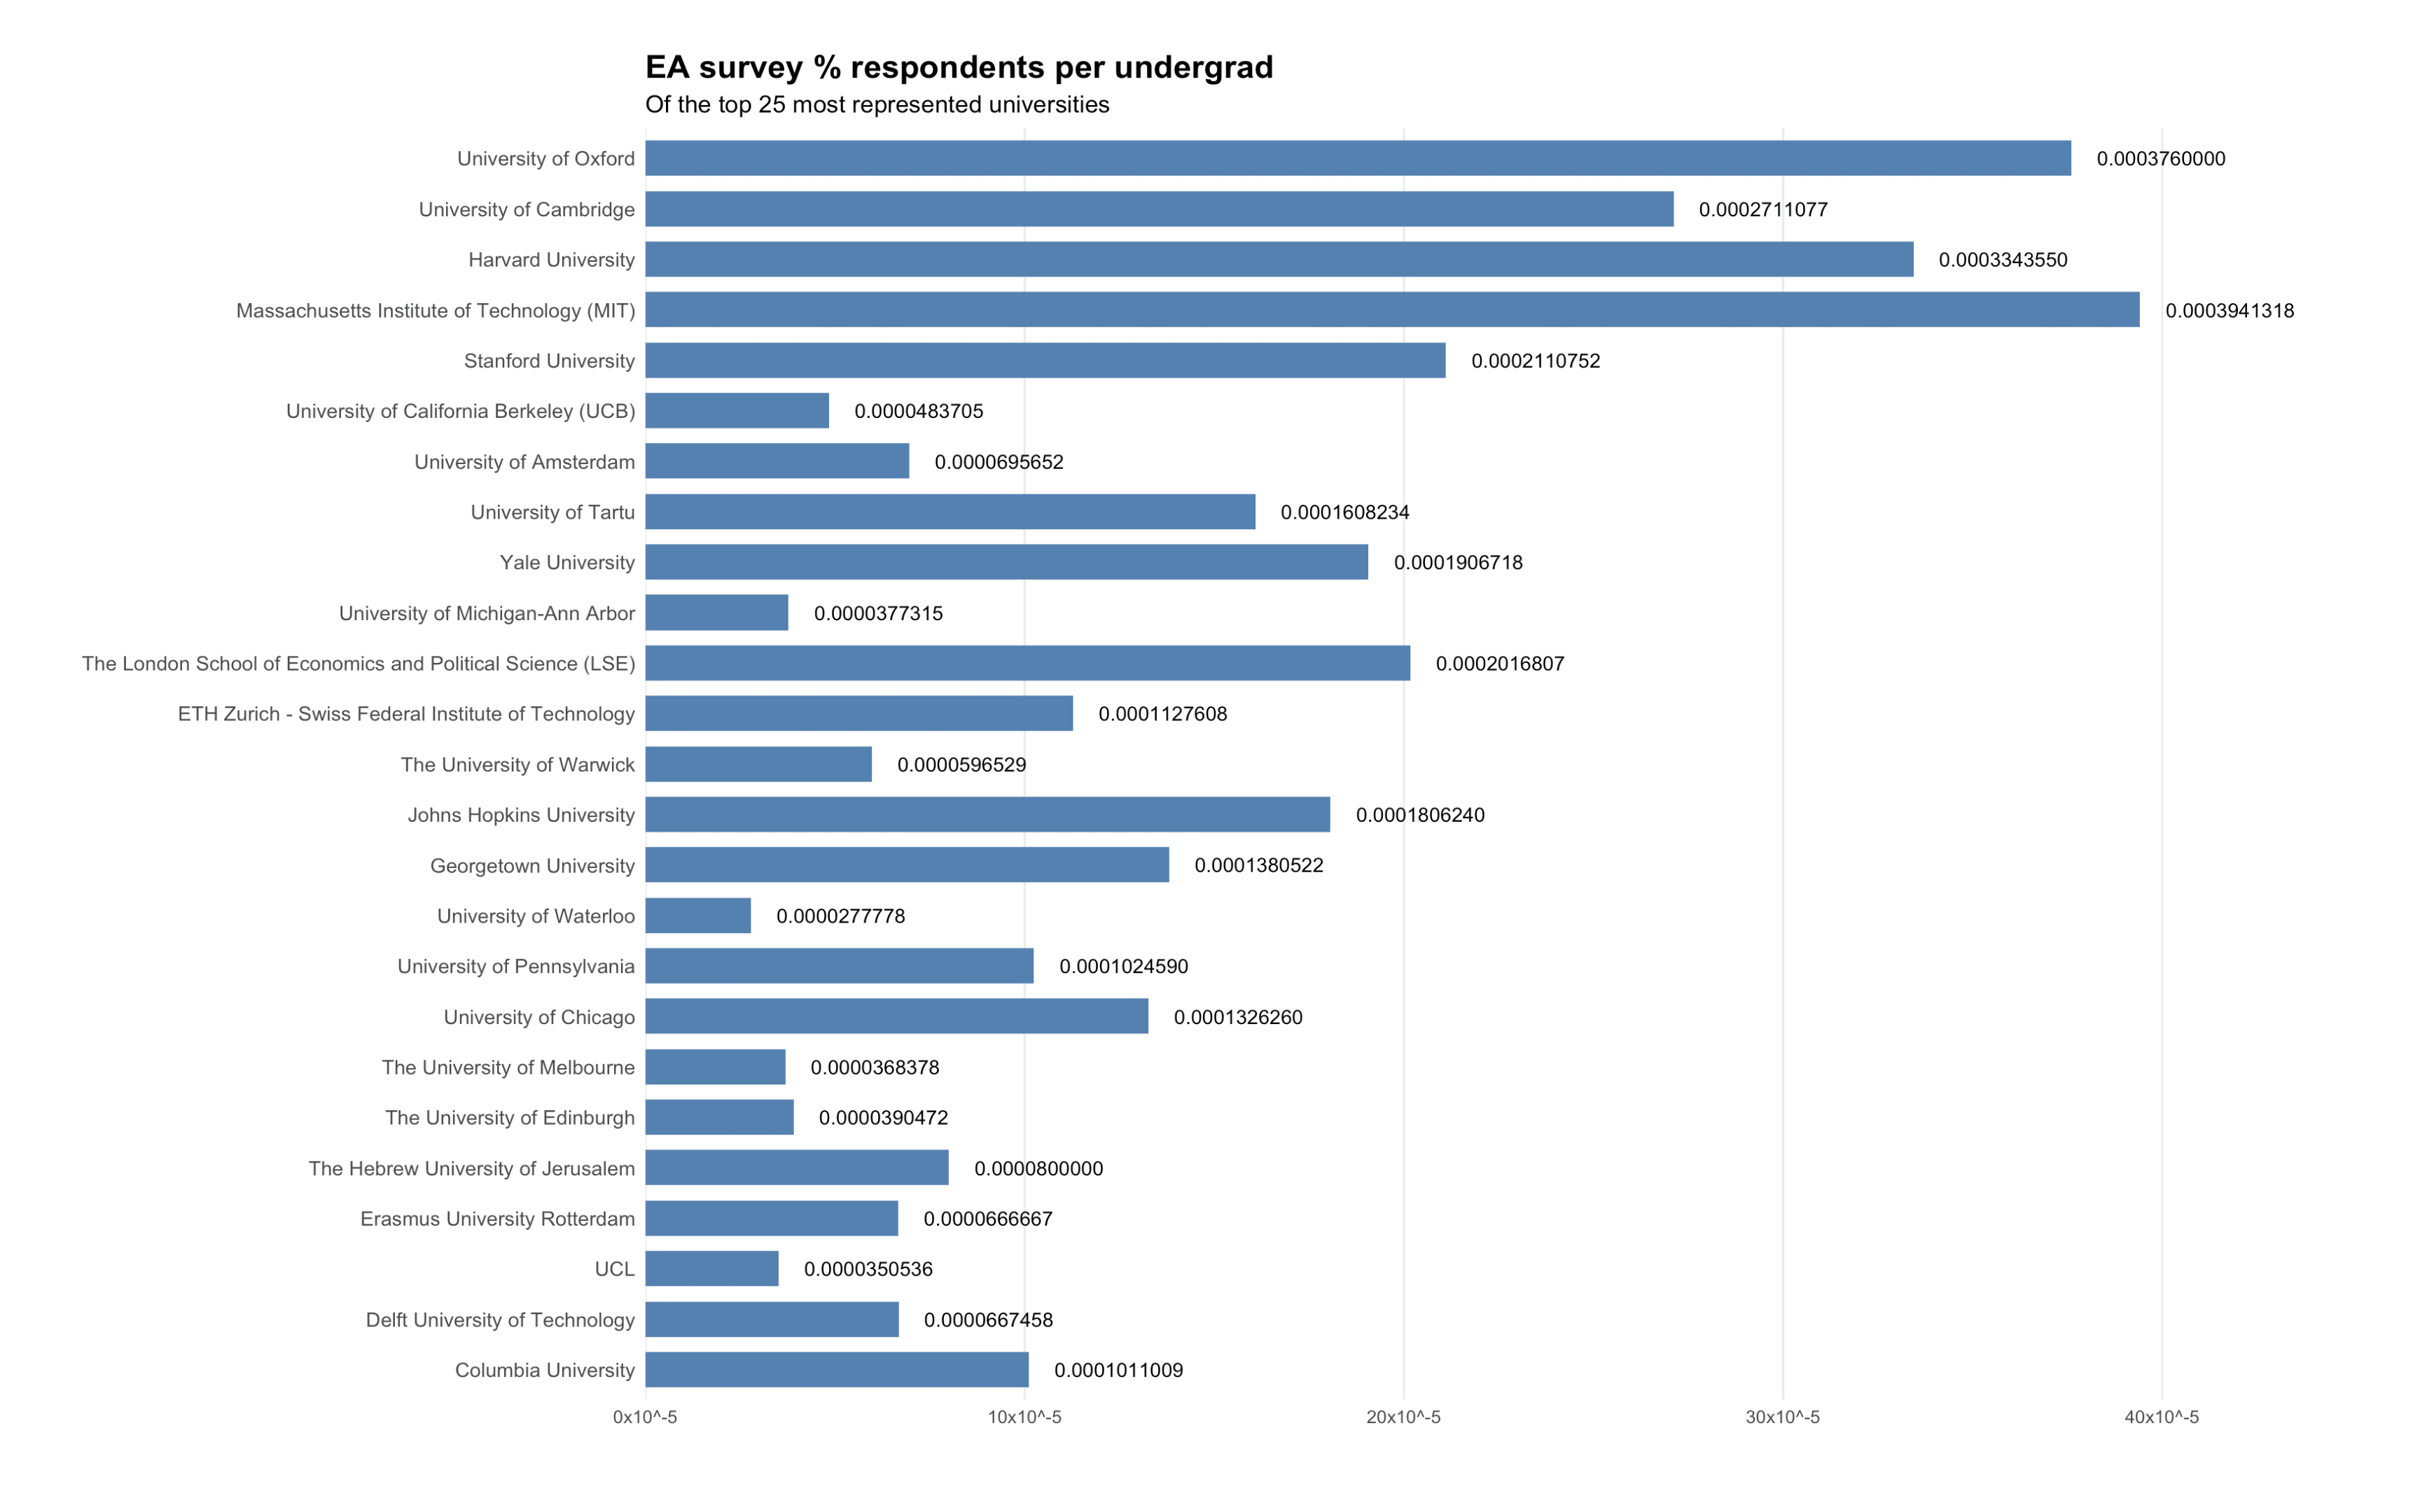
Reranking universities by representation in EA survey per undergraduate student, which seems relevant to figuring out what CB strategies are working (obviously plenty of confounders). Data from 1 minute of googling + LLMs so grain of salt
There does seem to be a moderate positive correlation here so nothing shocking IMO.

Same chart as above but by original order
David_Moss @ 2025-03-02T17:54 (+4)
Thanks for putting this together! It's good to confirm the overall pattern.
I would note that (as we observed in the case of per capita figures for small countries), per capita figures for small colleges risk being very noisy (e.g. a very small number of respondents can make a very big difference), so I would be very cautious drawing inferences about any individual college.
JDBauman @ 2025-03-02T02:49 (+4)
What is the breakdown by religion?
David_Moss @ 2025-03-02T17:46 (+3)
We rotate religion, politics and diet across different years due to space limitations, so religion wasn't included this year. You can see the results for 2019-2022 here, though, which suggest relatively little change across time.
Quinn McHugh (he/him) @ 2025-03-04T20:13 (+3)
Thanks for taking the time to run and analysis this survey.
Are there plans to include questions about income and/or financial stability in next year’s survey?
Rationale: I believe this data would be valuable in providing individuals with a clearer understanding of the financial security of others in the EA community and could help newcomers assess whether the advice they receive is relevant to their own financial situation. Many recommendations and norms within EA - such as unconventional career choices, significant donation pledges, or risk-taking in pursuit of impact - can have vastly different implications depending on who's making the recommendation or reinforcing the norms.
If a significant portion of the community has financial security, it’s possible that commonly shared advice assumes a level of stability that not all newcomers have. Understanding the financial realities of EA members could help provide more contextually appropriate guidance and ensure that discussions around impact, risk, and career planning are inclusive of people from diverse economic backgrounds.
Would love to hear your thoughts on this!
David_Moss @ 2025-03-04T20:39 (+2)
Thanks for the comment!
I agree these would be interesting things to include.
- We used to ask about income as part of our donation data section. But we've not included the donation questions since EAS 2020. If you like, I can provide further analyses of the income data from prior surveys. On the face of it, EA income and donations have been surprisingly low historically. But this is likely explained by the high percentage of student/very early career people in the community.
- Also in 2020, we were asked to include a question about experiences of financial or employment instability as a child, which found relatively low levels. As noted in that post, we would generally recommend using a different measure if you want a proxy for SES, but this is the one we were asked to include. I do think that SES is a relatively neglected demographic (EA seems to be strikingly high SES background).
SiebeRozendal @ 2025-02-28T11:28 (+3)
I still think using a single dimension for political beliefs is losing out on a lot of relevant information - I think our community is more diverse than implied by these results.
SiebeRozendal @ 2025-02-28T11:31 (+4)
Perhaps it would be interesting to run a one-time survey on the political beliefs in our community? (and how they compare to the general population)
(I think this should be done on the level of semi-abstract questions and not hot topic political issues)
David_Moss @ 2025-02-28T11:57 (+5)
I agree that getting more fine-grained information about political views (as well as moral views, and bunch of other things) would be very interesting.
We could potentially include it in the interim Extra EA Survey we plan to run later this year, before running the next full survey next year, depending on space. As noted above, we've had to run the Politics and Diet questions on alternating years due to space constraints, and keeping the same question as previous years is a priority so we can see the broad changes over time.
SummaryBot @ 2025-02-28T15:58 (+1)
Executive summary: The 2024 EA Survey highlights demographic trends in the Effective Altruism (EA) community, showing a continued gender and racial imbalance, an aging participant base, and shifts in career strategies and approaches to doing good.
Key points:
- Gender Composition: The EA community remains predominantly male (68.8%), with a slight increase in male respondents since 2022. However, more recent cohorts show a higher proportion of women.
- Racial/Ethnic Identity: White respondents continue to be the majority (75%), though their proportion has slightly declined over time.
- Age Trends: The average age of respondents is increasing, with the median rising from 25 in 2014 to 31 in 2024, suggesting an aging EA population.
- Career Strategies: The most common impact strategies are research (18.5%) and earning to give (15%), with the latter seeing a notable increase since 2022. Highly engaged EAs are more likely to focus on direct work, while less engaged EAs favor effective giving.
- Political Leanings and Diet Choices: The EA community is predominantly left-leaning (70%) but has seen a shift toward center-left over time. Vegan (25.5%) and vegetarian (20.3%) diets remain more common than in the general population.
- University Background: Many respondents attended highly ranked universities, with a concentration in English-speaking institutions like Oxford, Cambridge, and Harvard.
This comment was auto-generated by the EA Forum Team. Feel free to point out issues with this summary by replying to the comment, and contact us if you have feedback.