What AI Forecasting Strategy Works Best? (Spring 2026 Survey Analysis)
By Benjamin Wilson 🔸, Metaculus @ 2026-09-09T14:56 (+3)
This is a linkpost to https://www.metaculus.com/notebooks/45382/bot-survey-spring-2026/
Every season Metaculus sends out a survey to bot makers who participated in the FutureEval AI forecasting benchmark. This analysis compares answers to this survey with performance in the Spring 2026 FutureEval Bot Tournament to help surface what works and what doesn’t when forecasting the future. This analysis is complementary to our Spring Pro vs Bots Analysis and Spring Advice from Bot Makers to Bot Makers.
Main takeaways:
- No results were statistically significant: Though 4 individual features of the survey had a p-value less than 0.05, after adjusting for the 33 tests we ran, we cannot conclude that these are not false positives.
- Using a frontier model had notable correlations: Using GPT 5.4 for the final prediction had the highest correlation of any feature measured, with a correlation of 0.42. Using a GPT 5.x model had a correlation of 0.26. Using at least one frontier model for the final forecast had a correlation of 0.20. Using an Opus model had a correlation of essentially 0. Some of these findings may be just noise; however, based on past analyses, we have seen model choice be important, and expect these findings will replicate.
- Focus on research: Given the results of this analysis and leaning on Metaculus’s sense of where things are heading, it's worth adding good web scraping to your bot and focusing more on research features than on reasoning features. Additionally, native web search options like OpenAI web search are probably worth trying.
Methodology
58 bot makers answered the Spring 2026 survey. This report covers the 48 whose bots competed in the scored FutureEval tournament (the other 10 were MiniBench-only participants). It shows, for each structured question, how answers were distributed and how they relate to bot performance.
We show 2 types of graphs. The first is the raw distribution of answers for each option for each question. The second compares the value of some feature of the survey with the performance of the bot in the tournament.
Performance is a bot’s average spot peer score in the Spring 2026 FutureEval tournament. Its spot peer score on a question compares its forecast at scoring time against the geometric mean of its peers. If it is positive, the prediction was (on average) better than others. If it is negative, it was worse than others.
Three groups appear in the distribution charts:
- Non-winners: 18 FutureEval participants who did not perform well enough to win a prize.
- Winners: 30 participants who won prize money in the tournament.
- Top 10 (by spot peer score): 9 participants who filled the survey and whose bot placed in the top 10 of the full 180-bot leaderboard by sum of spot peer score. This group overlaps with winners.
Charts show the share within each group, since the groups differ in size.
Correlations use a stricter set of the 42 bots that forecast at least 100 scored questions, so a bot with only a few questions cannot swing a result due to lucky forecasting. The distributions above still use all 48 participants, and only the performance correlations apply the question floor.
Each feature is correlated with a bot’s average spot peer score using Pearson’s r for yes/no traits and Spearman’s rank correlation for ordered or counted ones. Because many features are tested at once, every p-value also carries a Benjamini-Hochberg q-value (its p adjusted for the false-discovery rate across all tested features), and a result is called “significant” only when q < 0.05.
For the frontier model chart, a bot is called “frontier” if the model it used for its final prediction is a flagship model (not a mini, flash, or fast variant) and was released after 2025-11-01.
How to read the correlations: r runs from -1 to +1. Values near 0 mean no relationship, positive means the trait is associated with a higher average peer score, and negative with a lower one. A low p-value means the pattern is unlikely to be chance, but due to the number of features being tested, lean on the q-value for significance.
10 respondents are excluded from this report since they made no forecasts in the scored FutureEval tournament (MiniBench-only participants).
Caveats
- Self-selection: Only 48 of the 180 scored bots answered the survey, and winners were far likelier to respond since the survey was required to receive prizes. 30 of 48 analyzed respondents won a prize (62%), versus 37 of 133 participating owners (28%). The distributions and correlations describe this self-selected group, so a habit’s popularity here can differ from its popularity among all bots, and correlations can be distorted if the makers who responded differ systematically from those who did not.
- Small samples: At 48 survey responses, this analysis is generally underpowered, so results should be treated as suggestive.
- Self-reported answers: Bot makers can misunderstand questions, accidentally click options, or intentionally skip options.
- Implementation rigor: Just because someone says they did something doesn’t necessitate that they did it well. If something is effective when done well, but is easy to do wrong, it will get a low correlation.
- Correlation is not causation: None of these links prove that a survey feature caused a better score. For instance, if it is only compute on a forecast that matters, teams with more money to spend on compute may also fine-tune an open-source model. This may exaggerate the correlation of fine-tuned models with score.
- Bar chart averages: In the per-question performance charts, each bar is the mean of the individual bots’ averages in that group. Consequently, a bar sits below the strongest bots in the group because it blends strong and weak bots. A bar shows only a group’s average and hides the spread within the group, so a clean-looking staircase of bars can still reflect a weak overall correlation. The r, p, and q values are a better guide.
Evidence summary
Below is a list of every measured survey feature versus performance (average spot peer score), ordered by correlation magnitude.
In the list, r is correlation, p is the uncorrected p-value, and q is the Benjamini-Hochberg p-value adjusted for testing all 33 features. “Significant” means q < 0.05. This analysis aims to be primarily hypothesis-generating. We can’t conclude much with n ≈ 42 bots and 33 features tested. We also expect many of these features to be confounded. However, FutureEval hosts the largest group of publicly competing AI forecasters, and so the results are worth indexing on.
- Used GPT-5.4 for its final model: r = +0.42 · p = 0.007 · q = 0.238 · significant: no
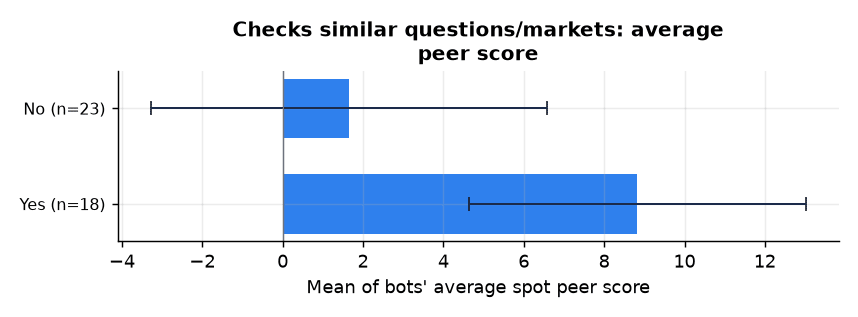
- Checks similar questions/markets: r = +0.34 · p = 0.031 · q = 0.323 · significant: no
- Uses web scraping: r = +0.33 · p = 0.032 · q = 0.323 · significant: no
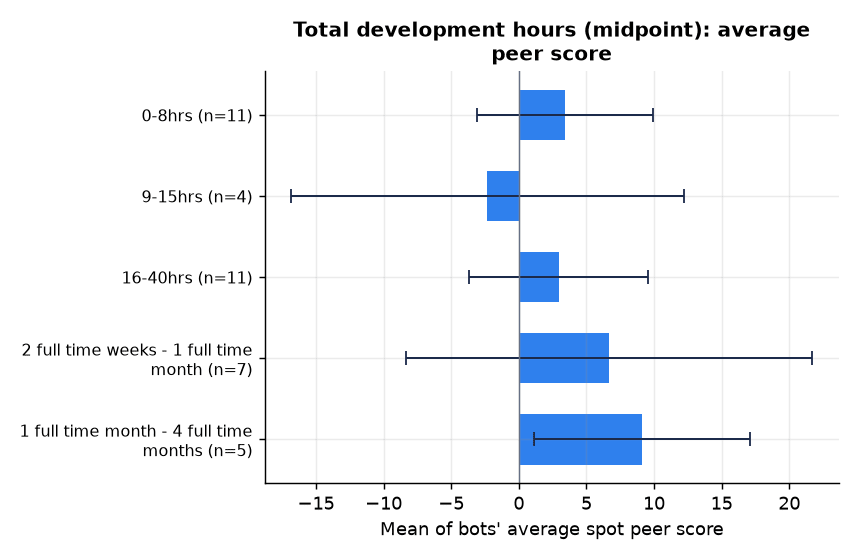
- Total development hours (midpoint): r = +0.32 · p = 0.039 · q = 0.323 · significant: no
- Extremizes predictions: r = -0.30 · p = 0.055 · q = 0.365 · significant: no
- Uses OpenAI web search: r = +0.27 · p = 0.084 · q = 0.422 · significant: no
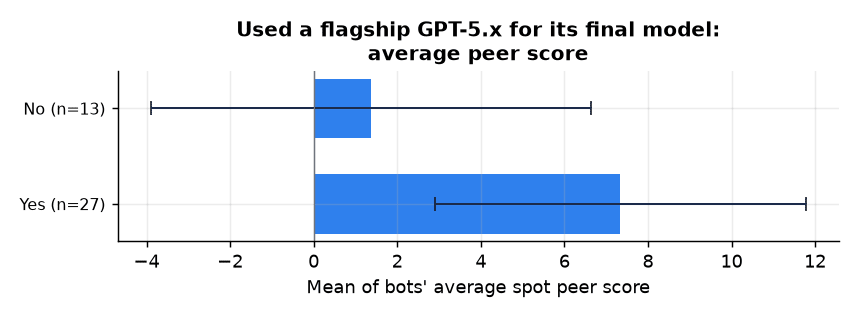
- Used a flagship GPT-5.x for its final model: r = +0.26 · p = 0.100 · q = 0.422 · significant: no
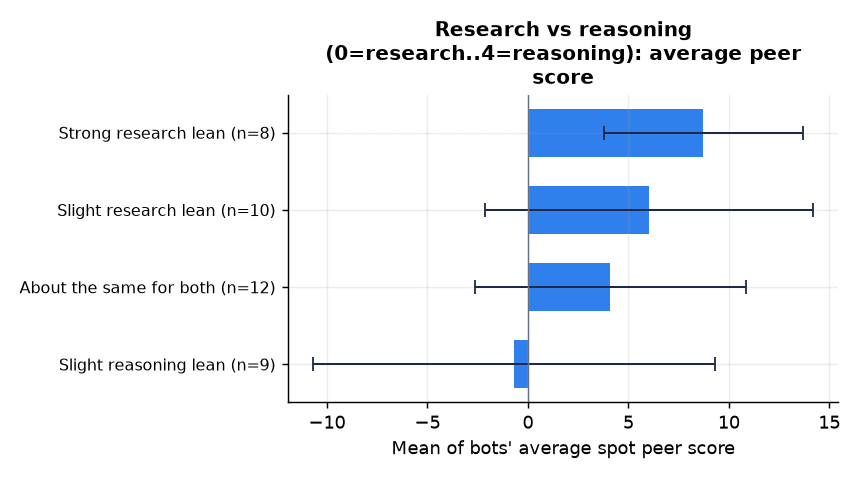
- Research vs reasoning (0=research..4=reasoning): r = -0.26 · p = 0.102 · q = 0.422 · significant: no
- Researches subquestions: r = +0.24 · p = 0.129 · q = 0.475 · significant: no
- Uses Exa: r = -0.20 · p = 0.195 · q = 0.557 · significant: no
- Frontier final model: r = +0.20 · p = 0.210 · q = 0.557 · significant: no
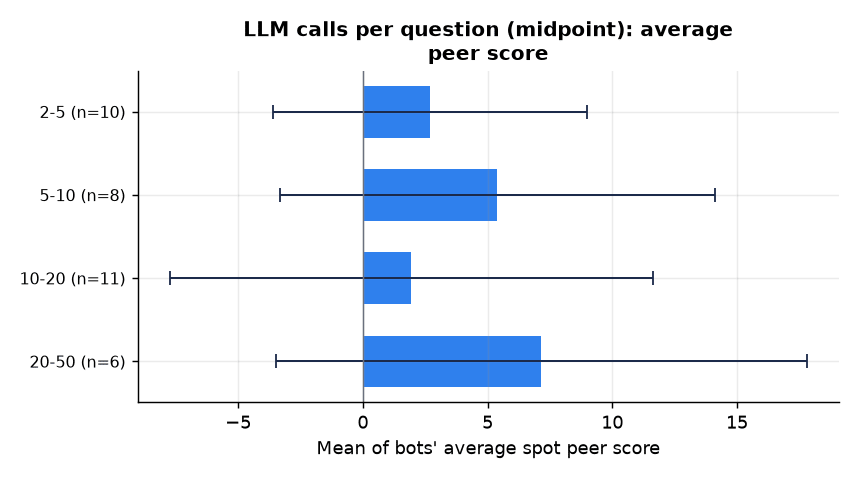
- LLM calls per question (midpoint): r = +0.20 · p = 0.209 · q = 0.557 · significant: no
- Number of research sources: r = +0.19 · p = 0.230 · q = 0.557 · significant: no
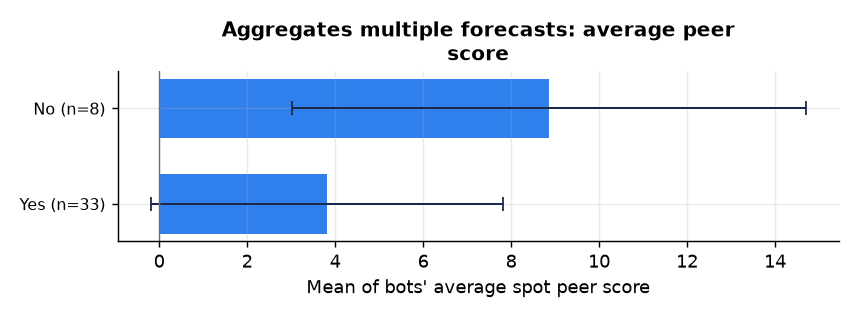
- Aggregates multiple forecasts: r = -0.19 · p = 0.236 · q = 0.557 · significant: no
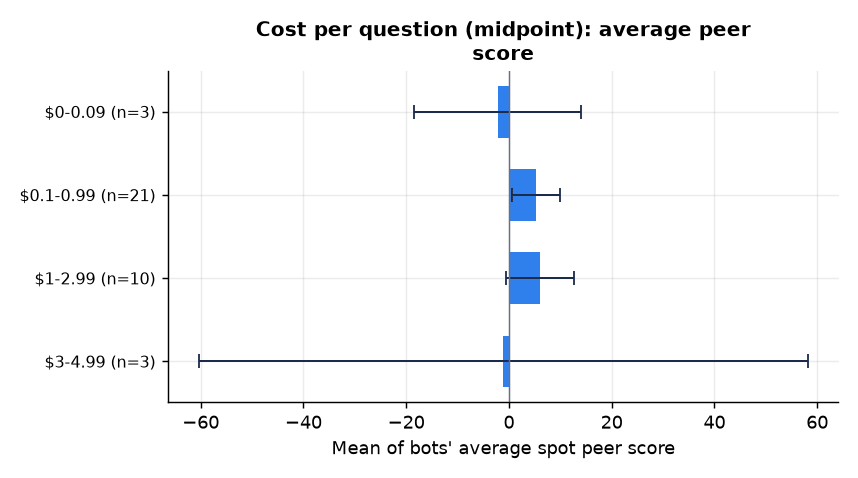
- Cost per question (midpoint): r = +0.17 · p = 0.300 · q = 0.614 · significant: no
- Tests vs community prediction: r = +0.17 · p = 0.318 · q = 0.614 · significant: no
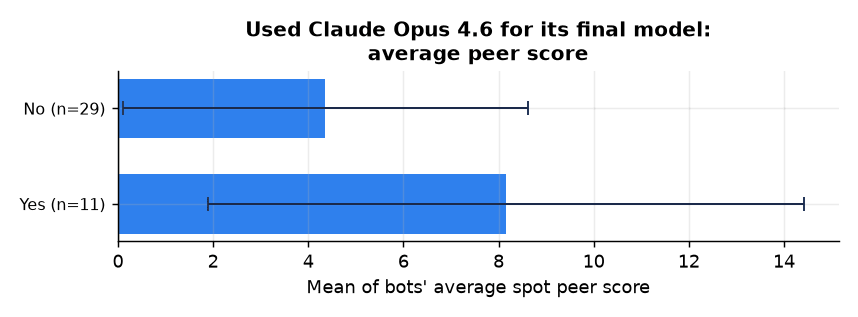
- Used Claude Opus 4.6 for its final model: r = +0.16 · p = 0.322 · q = 0.614 · significant: no
- Frontier supporting-role model: r = +0.16 · p = 0.335 · q = 0.614 · significant: no
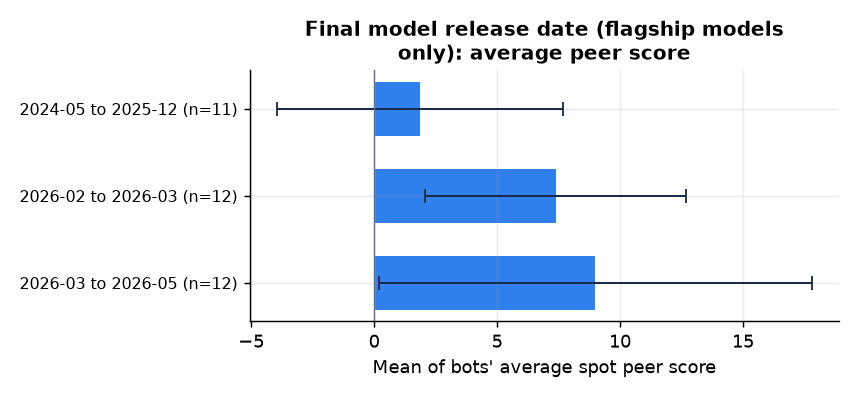
- Final model release date (flagship models only): r = +0.14 · p = 0.421 · q = 0.722 · significant: no
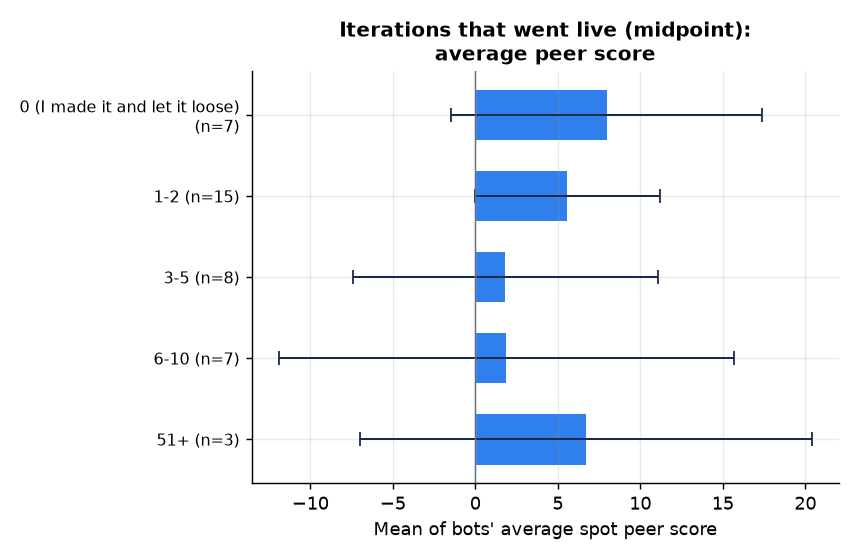
- Iterations that went live (midpoint): r = -0.12 · p = 0.438 · q = 0.722 · significant: no
- Tests via pastcasting: r = +0.11 · p = 0.502 · q = 0.736 · significant: no
- Uses Perplexity: r = -0.11 · p = 0.481 · q = 0.736 · significant: no
- Uses scenario analysis: r = -0.10 · p = 0.518 · q = 0.736 · significant: no
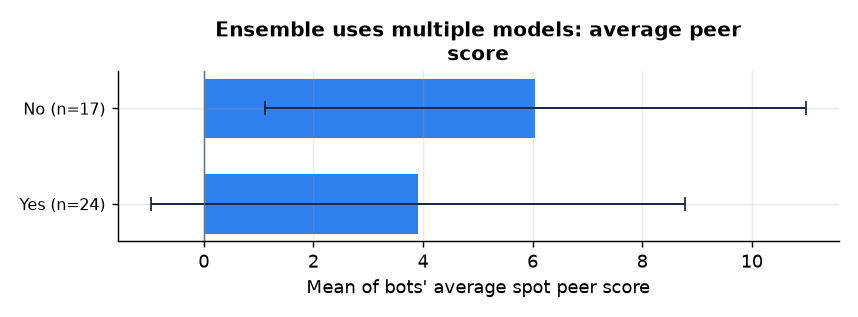
- Ensemble uses multiple models: r = -0.10 · p = 0.535 · q = 0.736 · significant: no
- Uses MiniBench for design: r = -0.07 · p = 0.682 · q = 0.855 · significant: no
- Uses LLM self-critique / red team: r = -0.07 · p = 0.675 · q = 0.855 · significant: no
- Uses AskNews: r = +0.06 · p = 0.700 · q = 0.855 · significant: no
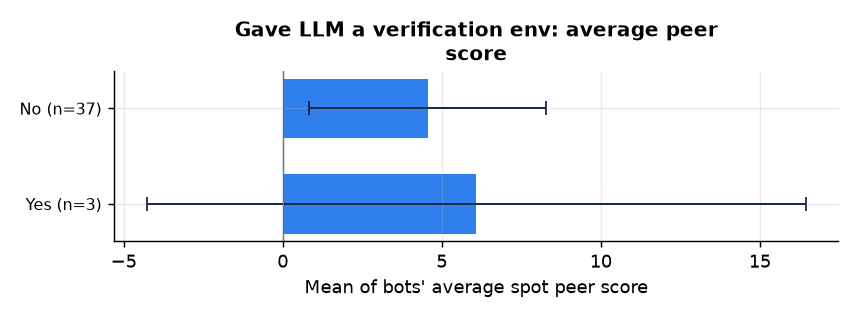
- Gave LLM a verification env: r = +0.04 · p = 0.817 · q = 0.958 · significant: no
- Caps predictions: r = -0.03 · p = 0.853 · q = 0.958 · significant: no
- Team size: r = +0.02 · p = 0.882 · q = 0.958 · significant: no
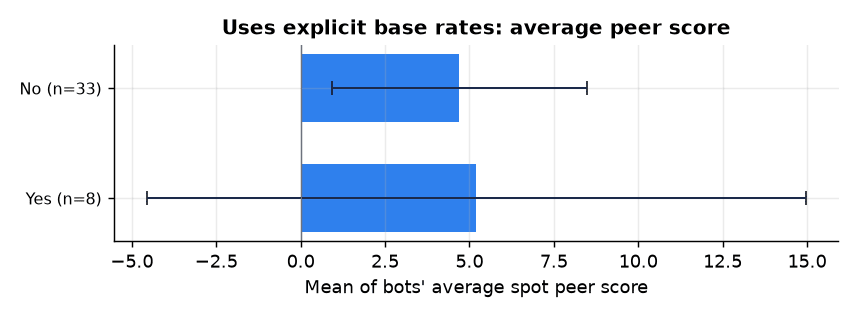
- Uses explicit base rates: r = +0.02 · p = 0.907 · q = 0.958 · significant: no
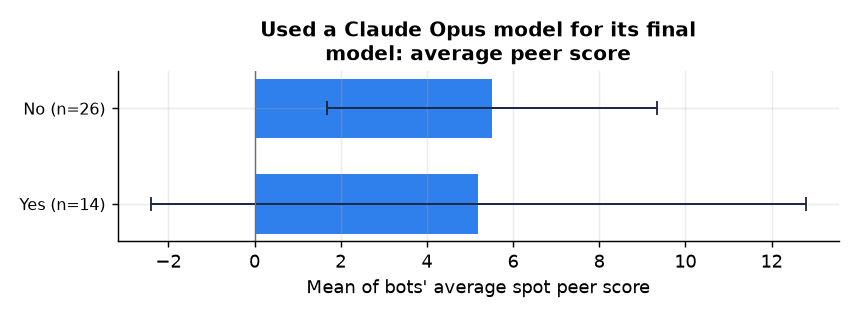
- Used a Claude Opus model for its final model: r = -0.01 · p = 0.929 · q = 0.958 · significant: no
- Does manual review of outputs: r = +0.00 · p = 0.994 · q = 0.994 · significant: no
The question sections below are ordered by their strongest correlation with performance (largest |r| first). Questions with no performance correlation come last. The evidence summary above is ordered by |r| alone.
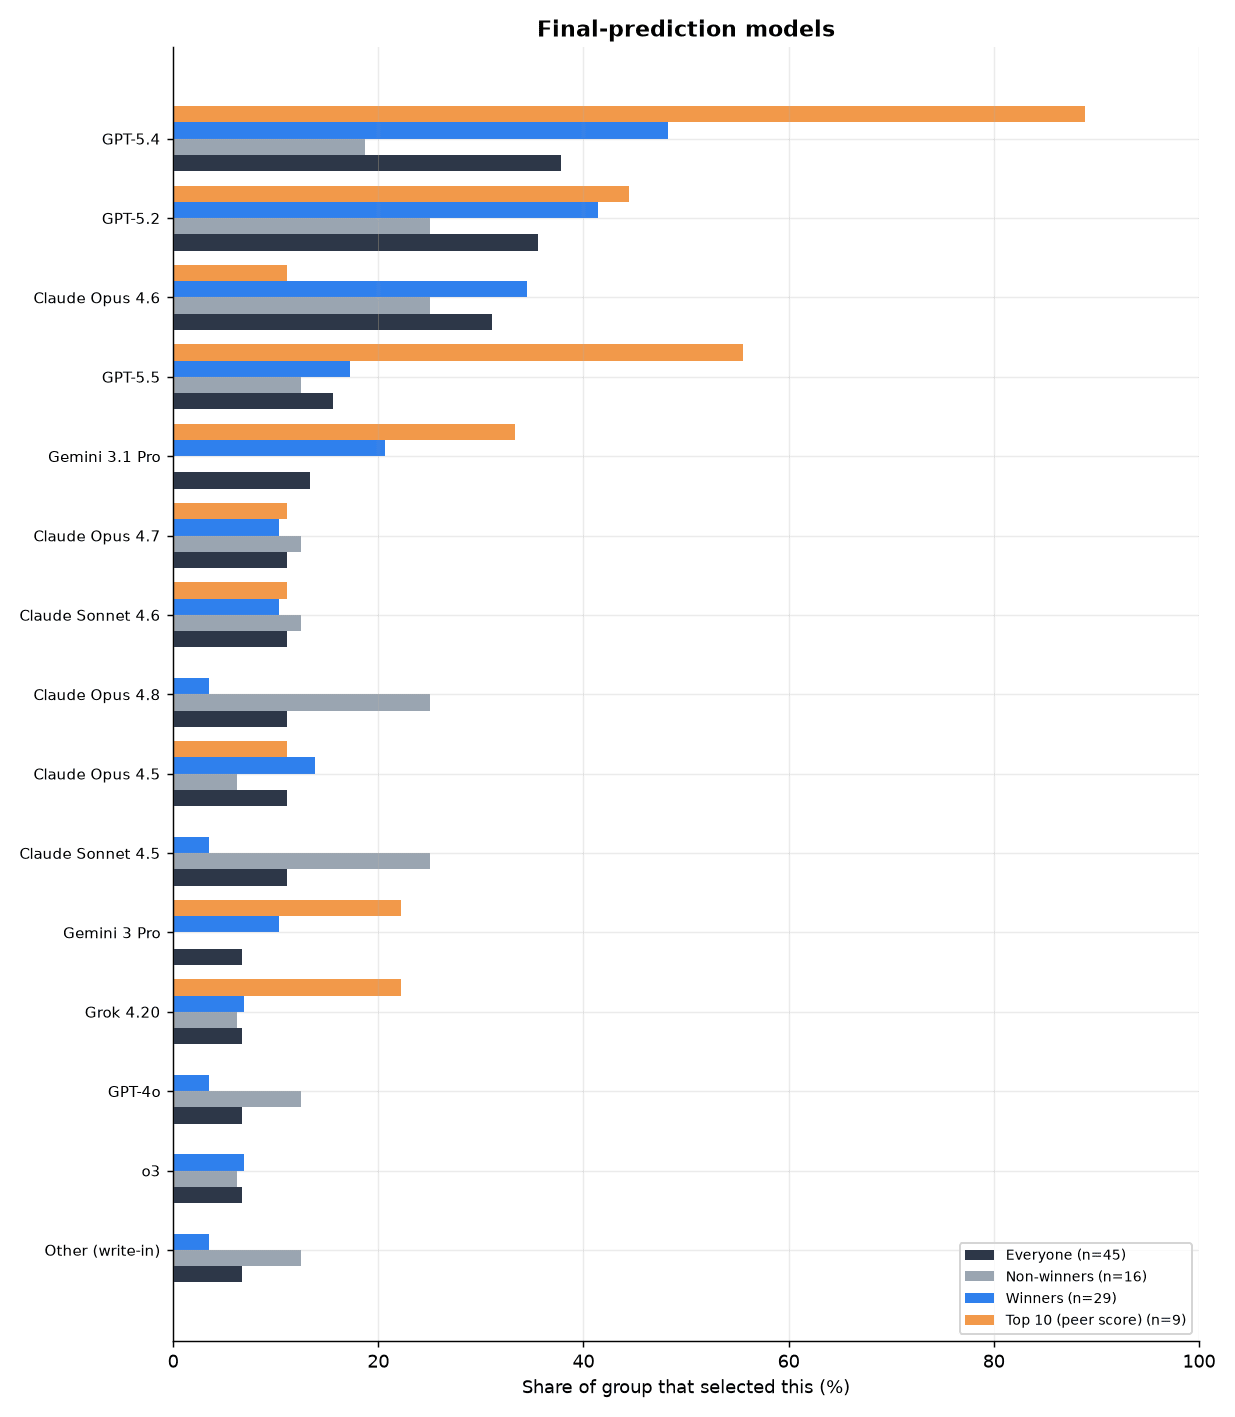
Final-prediction models
Survey question: Which LLM model(s) did you use to make your final prediction/answer?
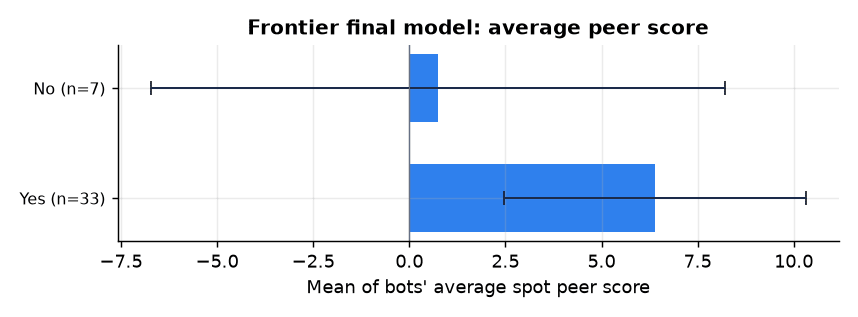
“Frontier final model” shows a weak link to higher peer score (Pearson r = +0.20, p = 0.210, q = 0.557, n = 40).
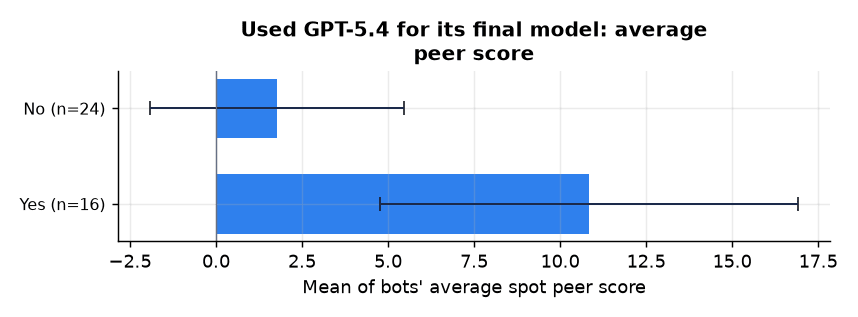
“Used GPT-5.4 for its final model” shows a moderate link to higher peer score (Pearson r = +0.42, p = 0.007, q = 0.238, n = 40).
“Used a flagship GPT-5.x for its final model” shows a weak link to higher peer score (Pearson r = +0.26, p = 0.100, q = 0.422, n = 40).
“Used a Claude Opus model for its final model” shows no clear relationship with peer score (Pearson r = -0.01, p = 0.929, q = 0.958, n = 40).
“Used Claude Opus 4.6 for its final model” shows a weak link to higher peer score (Pearson r = +0.16, p = 0.322, q = 0.614, n = 40).
“Final model release date (flagship models only)” shows a weak link to higher peer score (Pearson r = +0.14, p = 0.421, q = 0.722, n = 35).
Forecasting strategies used
Survey question: Did your bot use any of the below forecasting strategies?
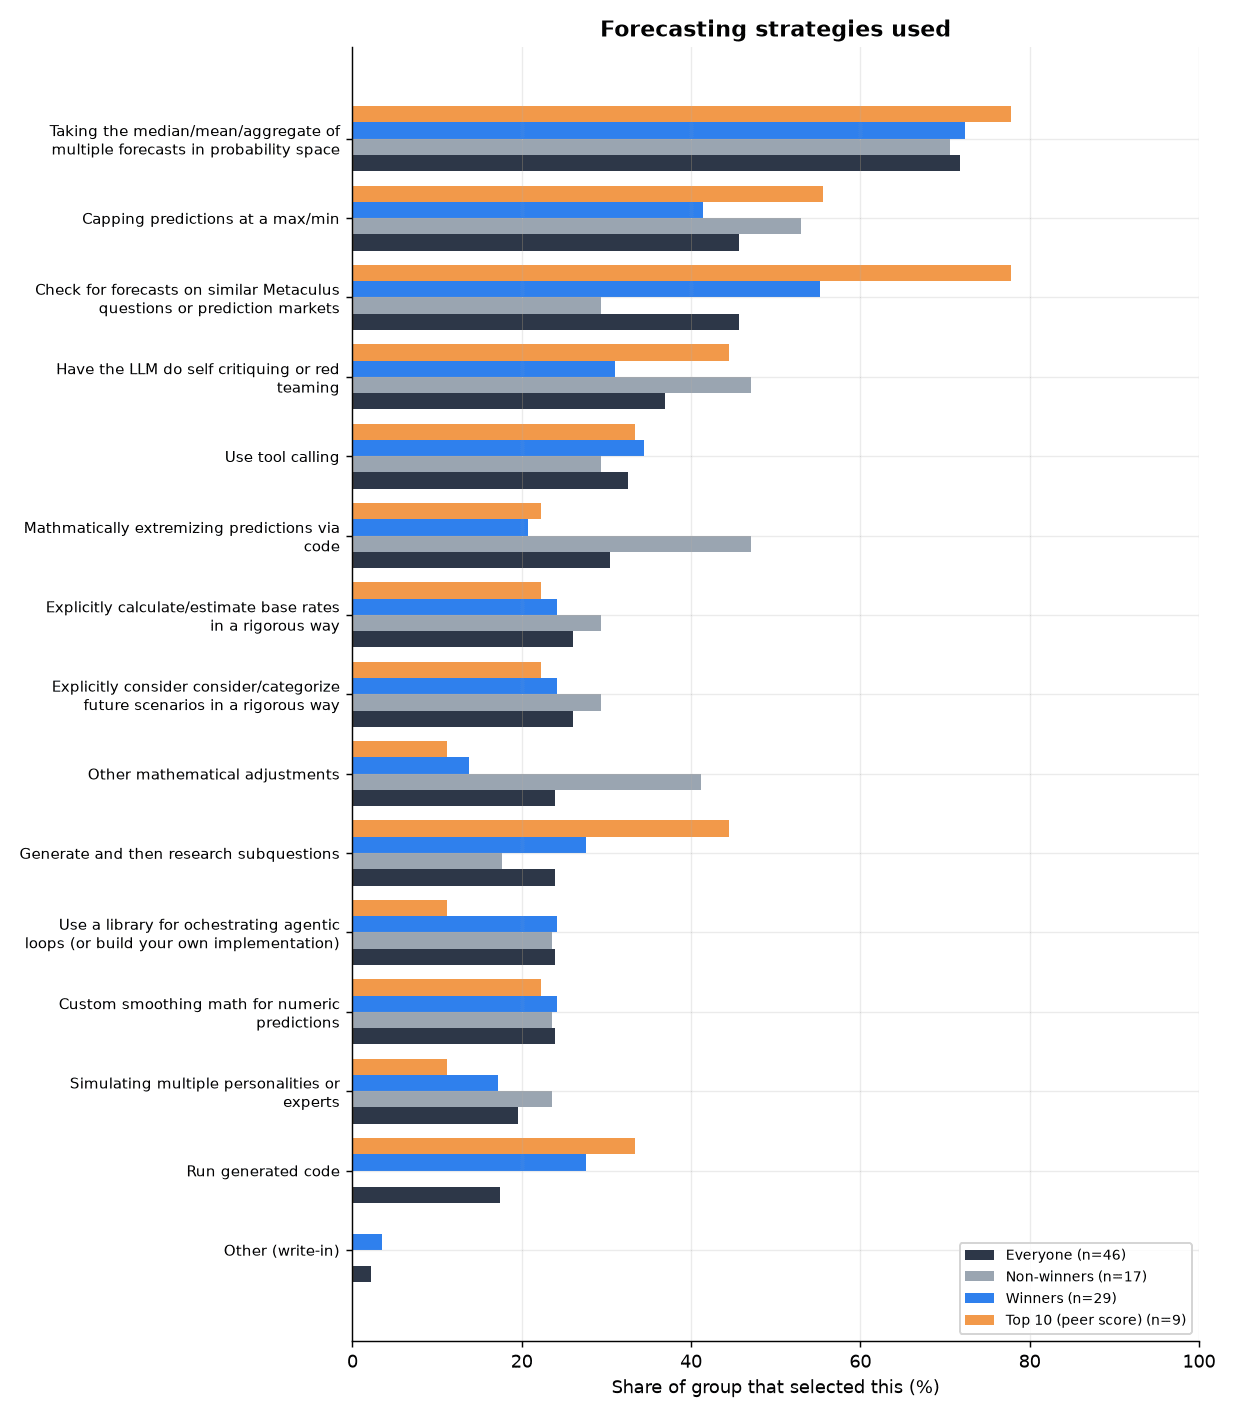
“Aggregates multiple forecasts” shows a weak link to lower peer score (Pearson r = -0.19, p = 0.236, q = 0.557, n = 41). Yes means the bot took the median, mean, or aggregate of multiple forecasts.
“Uses explicit base rates” shows no clear relationship with peer score (Pearson r = +0.02, p = 0.907, q = 0.958, n = 41). Yes means the bot explicitly estimated base rates in a rigorous way.
“Checks similar questions/markets” shows a moderate link to higher peer score (Pearson r = +0.34, p = 0.031, q = 0.323, n = 41). Yes means the bot checked similar Metaculus questions or prediction markets.
“Researches subquestions” shows a weak link to higher peer score (Pearson r = +0.24, p = 0.129, q = 0.475, n = 41). Yes means the bot generated and researched subquestions.
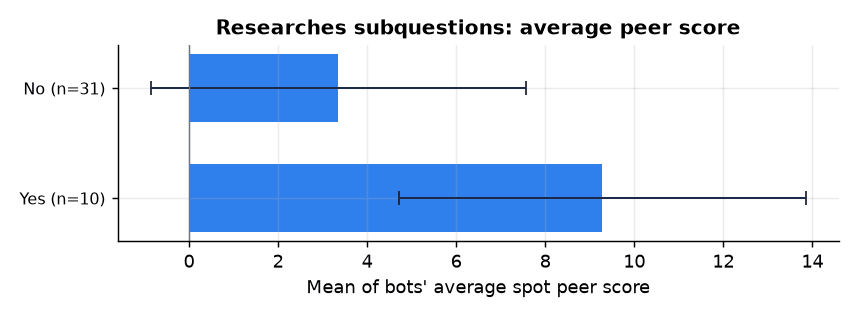
“Uses scenario analysis” shows a weak link to lower peer score (Pearson r = -0.10, p = 0.518, q = 0.736, n = 41). Yes means the bot explicitly considered or categorized future scenarios.
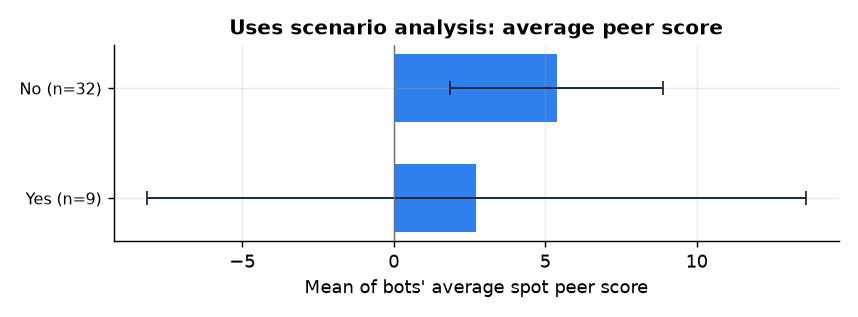
“Uses LLM self-critique / red team” shows no clear relationship with peer score (Pearson r = -0.07, p = 0.675, q = 0.855, n = 41). Yes means the bot had the LLM self-critique or red-team its forecasts.
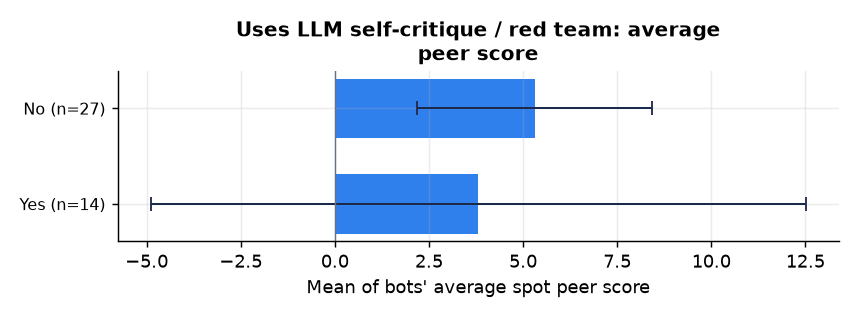
“Caps predictions” shows no clear relationship with peer score (Pearson r = -0.03, p = 0.853, q = 0.958, n = 41). Yes means the bot capped predictions at a max/min.
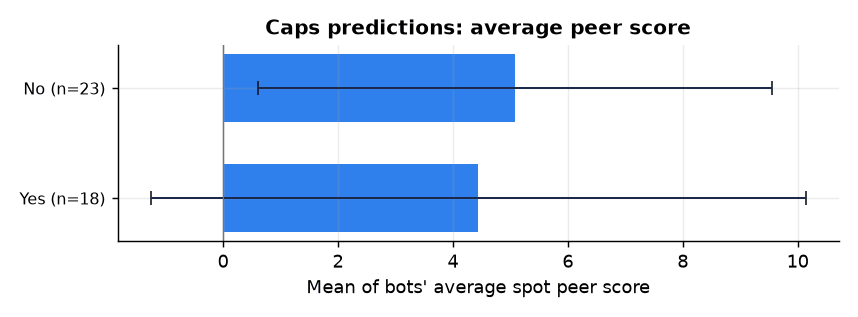
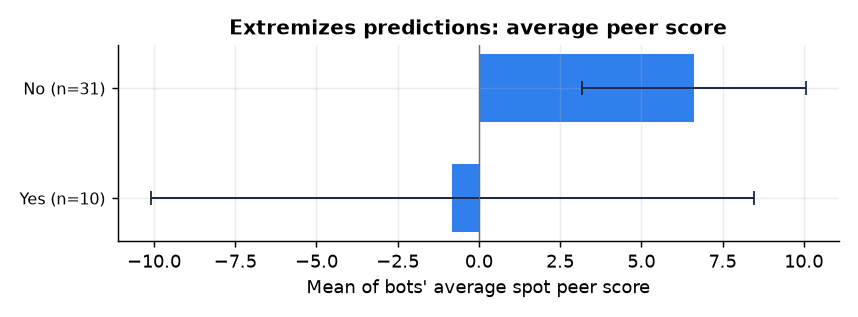
“Extremizes predictions” shows a moderate link to lower peer score (Pearson r = -0.30, p = 0.055, q = 0.365, n = 41). Yes means the bot mathematically extremized predictions via code.
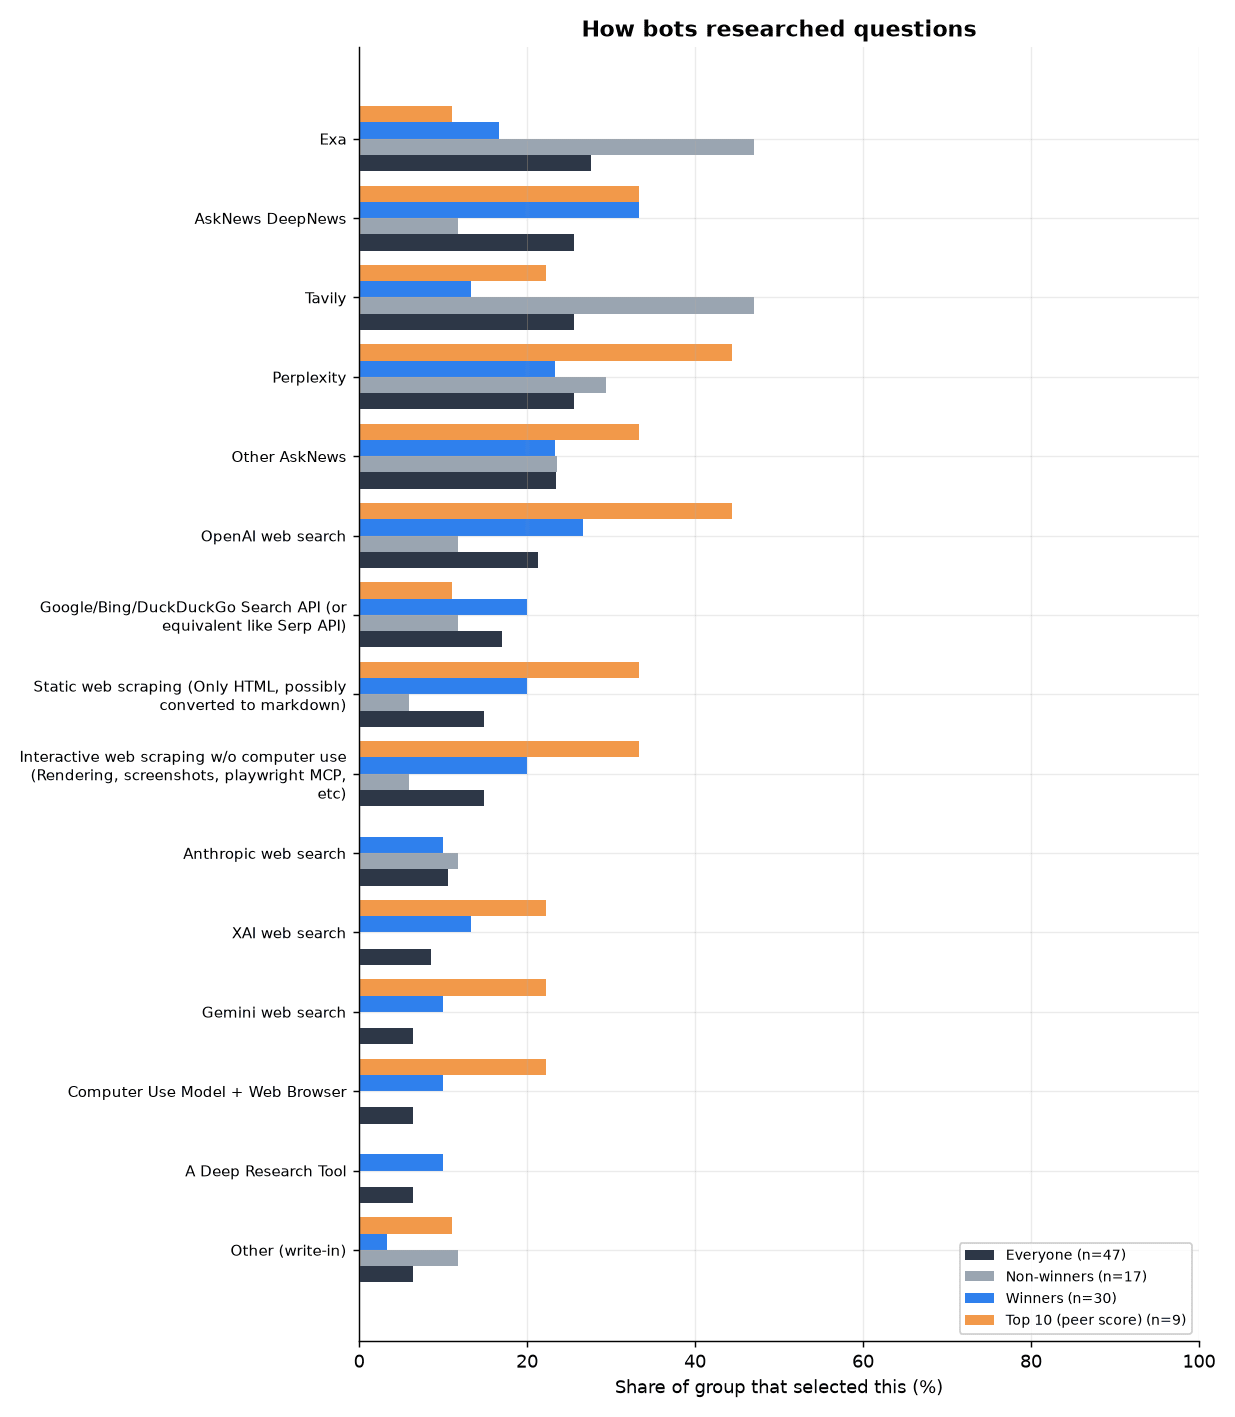
How bots researched questions
Survey question: How did your bot research questions?
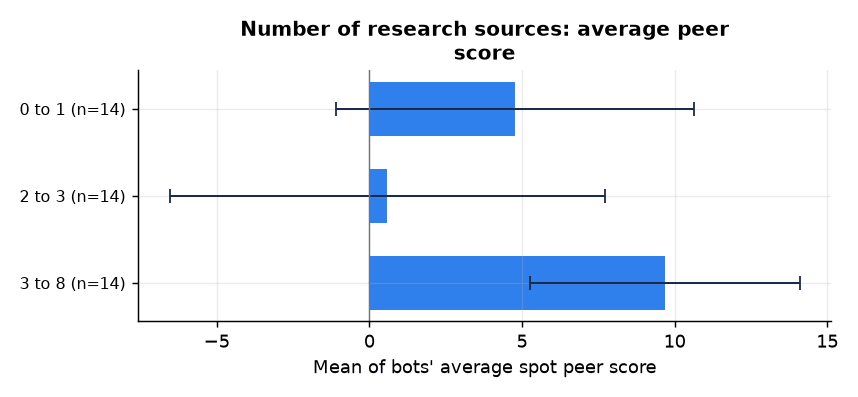
“Number of research sources” shows a weak link to higher peer score (Spearman r = +0.19, p = 0.230, q = 0.557, n = 42).
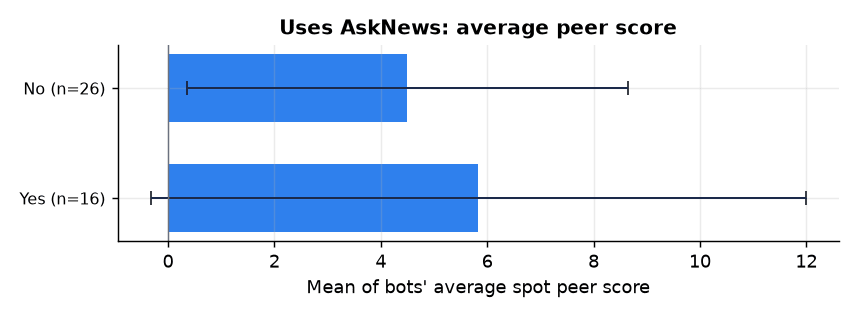
“Uses AskNews” shows no clear relationship with peer score (Pearson r = +0.06, p = 0.700, q = 0.855, n = 42). Yes means the bot’s research used AskNews (AskNews DeepNews or Other AskNews).
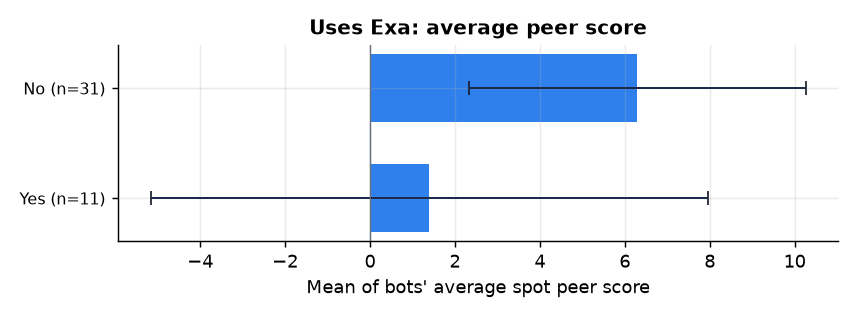
“Uses Exa” shows a weak link to lower peer score (Pearson r = -0.20, p = 0.195, q = 0.557, n = 42). Yes means the bot’s research used Exa.
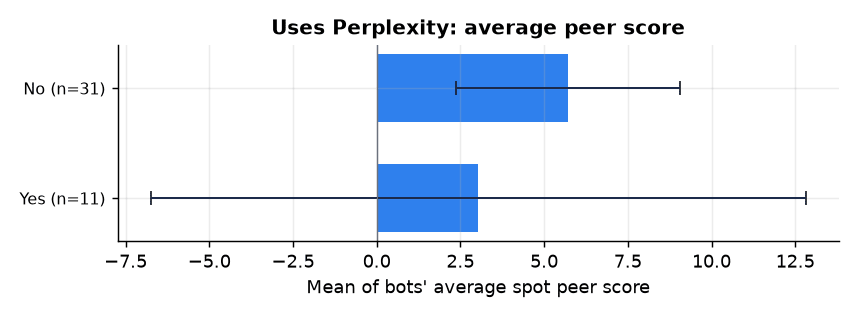
“Uses Perplexity” shows a weak link to lower peer score (Pearson r = -0.11, p = 0.481, q = 0.736, n = 42). Yes means the bot’s research used Perplexity.
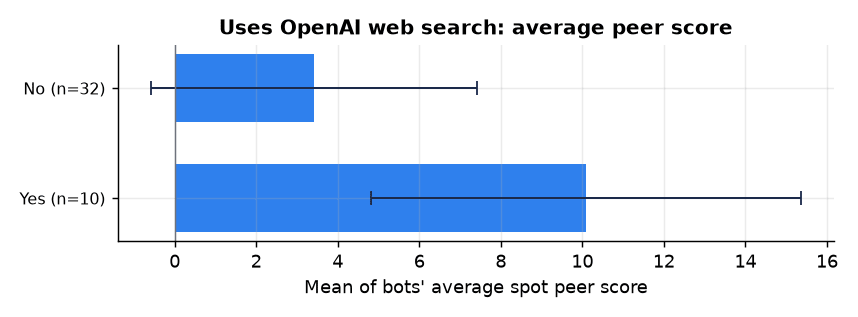
“Uses OpenAI web search” shows a weak link to higher peer score (Pearson r = +0.27, p = 0.084, q = 0.422, n = 42). Yes means the bot’s research used OpenAI web search.
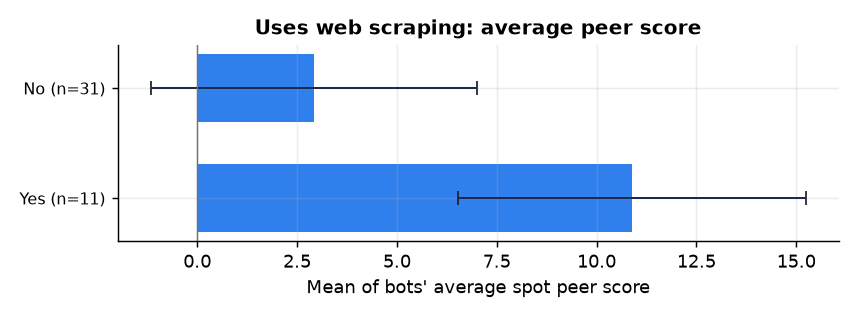
“Uses web scraping” shows a moderate link to higher peer score (Pearson r = +0.33, p = 0.032, q = 0.323, n = 42). Yes means the bot’s research used static or interactive web scraping.
Total active hours on the bot
Survey question: What is your best estimate for how many total active hours (between all team members) have been put into developing your bot?
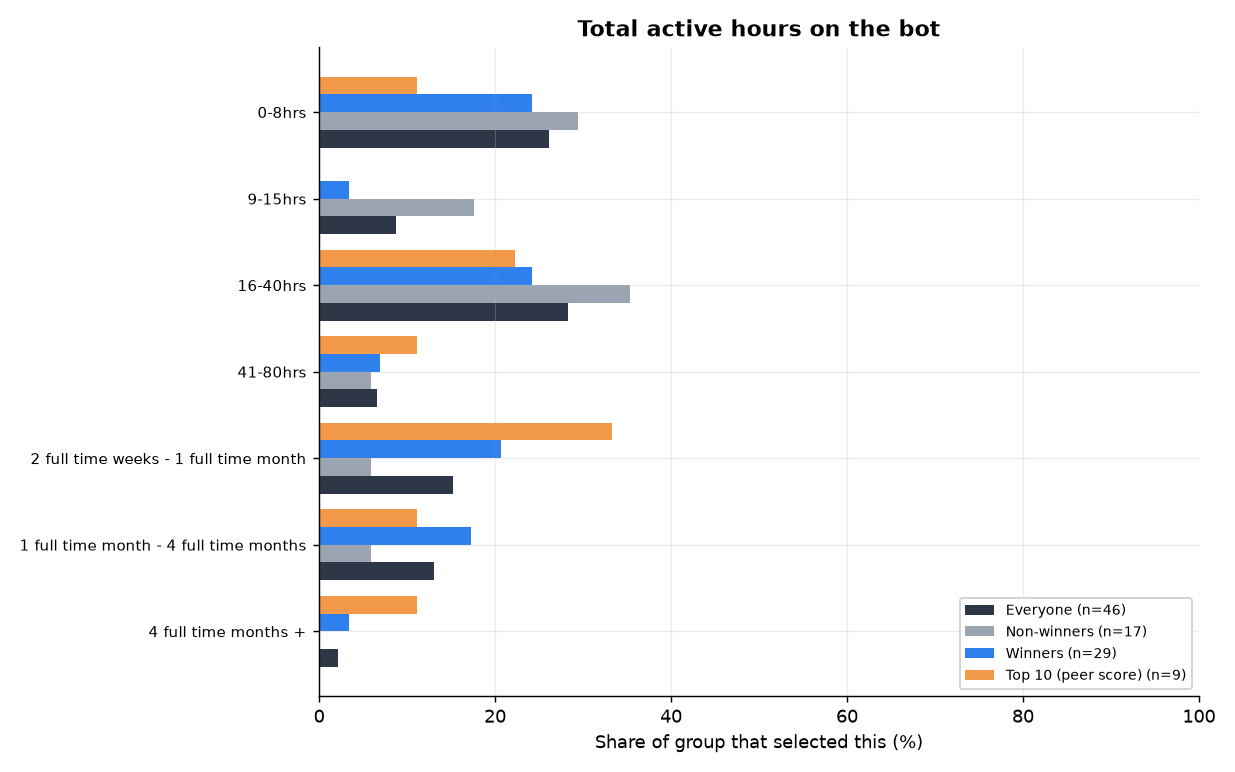
“Total development hours (midpoint)” shows a moderate link to higher peer score (Spearman r = +0.32, p = 0.039, q = 0.323, n = 41).
Research vs reasoning optimization
Survey question: When building, have you optimized more for research (external information retrieval) or reasoning (processing information given to the LLM)?
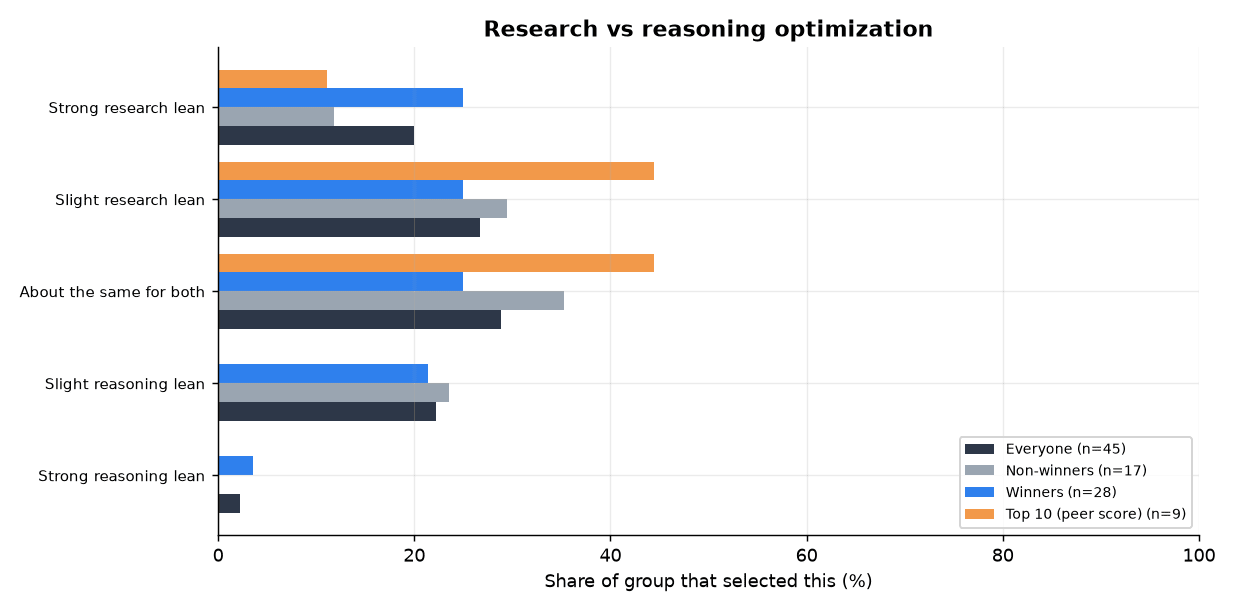
“Research vs reasoning (0=research..4=reasoning)” shows a weak link to lower peer score (Spearman r = -0.26, p = 0.102, q = 0.422, n = 40).
LLM calls per question
Survey question: Your best estimate of the number of LLM calls per question?
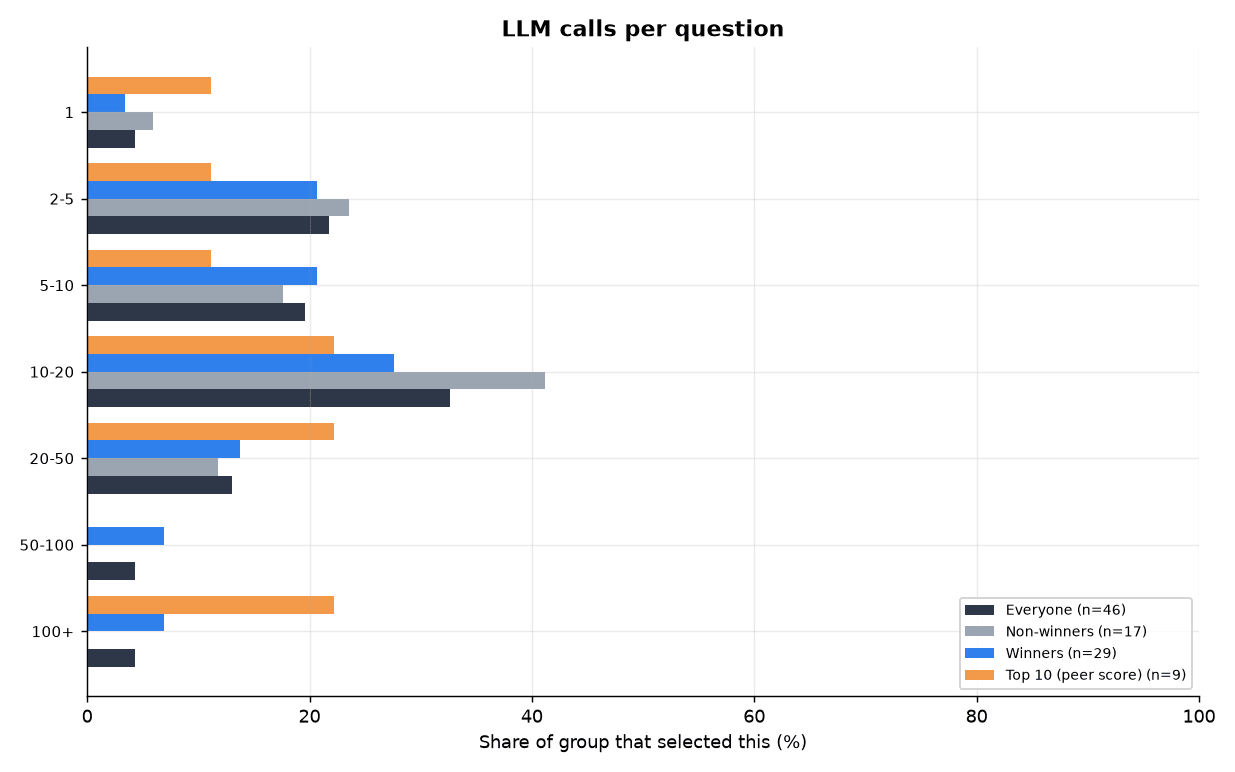
“LLM calls per question (midpoint)” shows a weak link to higher peer score (Spearman r = +0.20, p = 0.209, q = 0.557, n = 41).
Cost per question (USD)
Survey question: What is your best estimate of cost per Question? (USD)
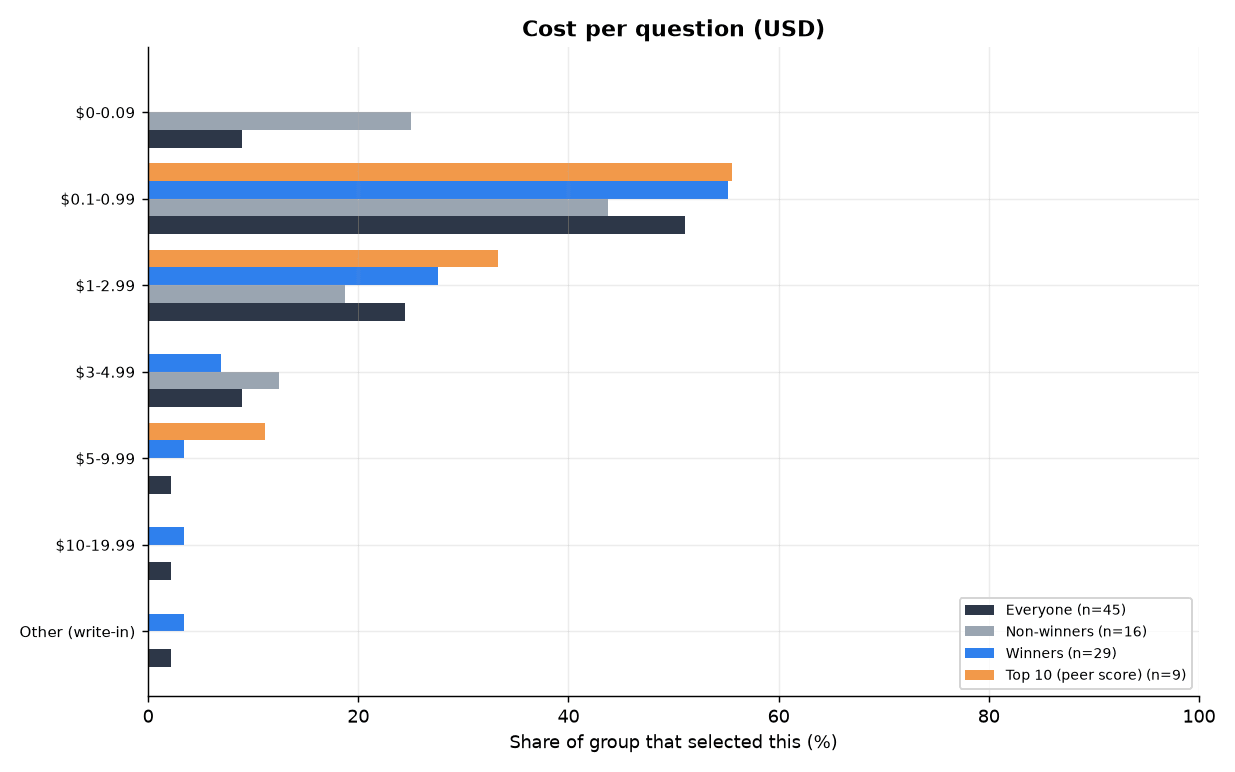
“Cost per question (midpoint)” shows a weak link to higher peer score (Spearman r = +0.17, p = 0.300, q = 0.614, n = 39).
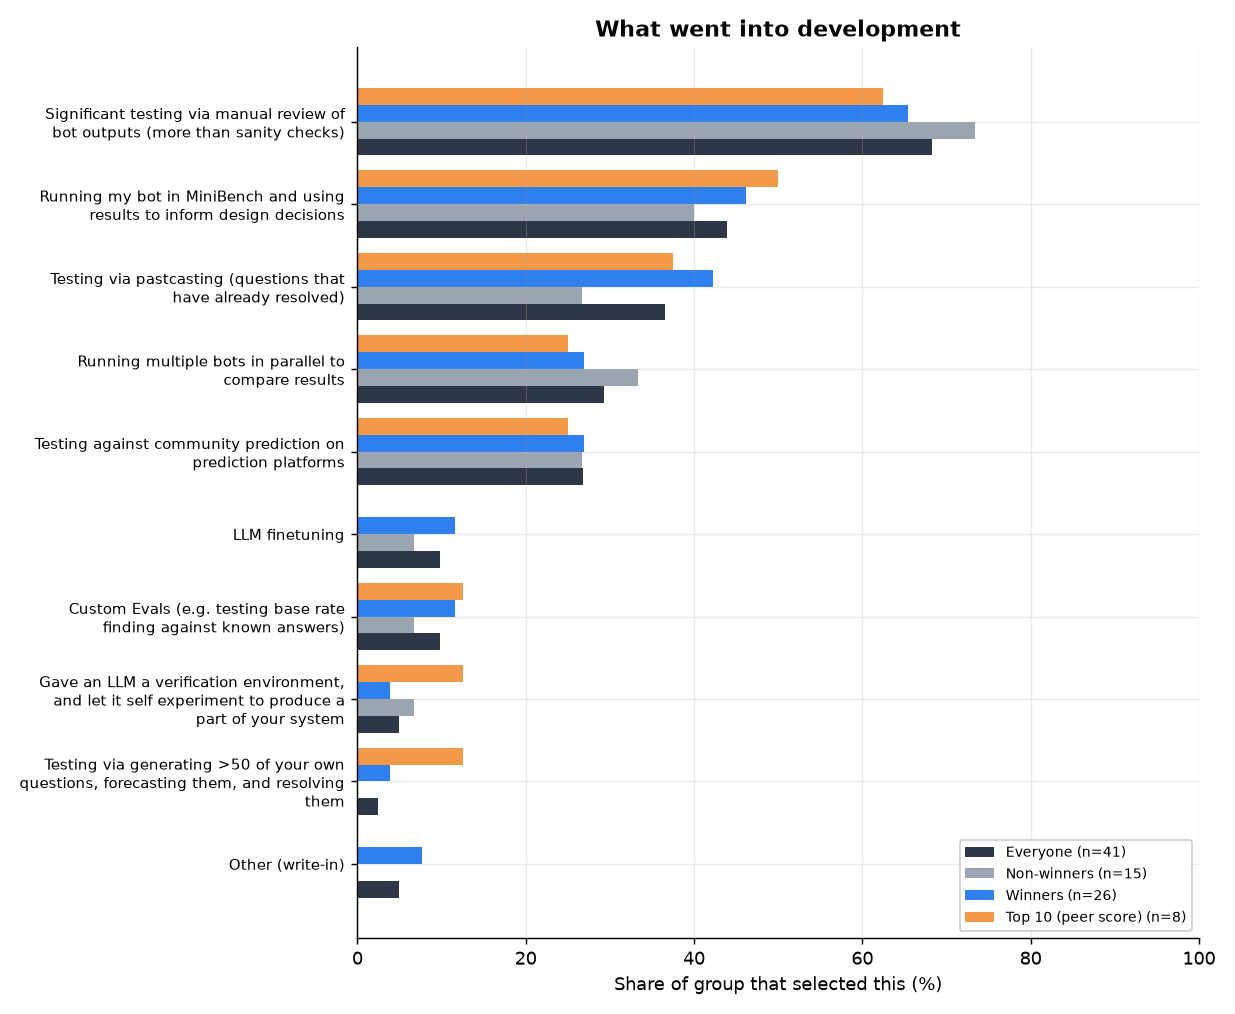
What went into development
Survey question: What went into the development of your bot?
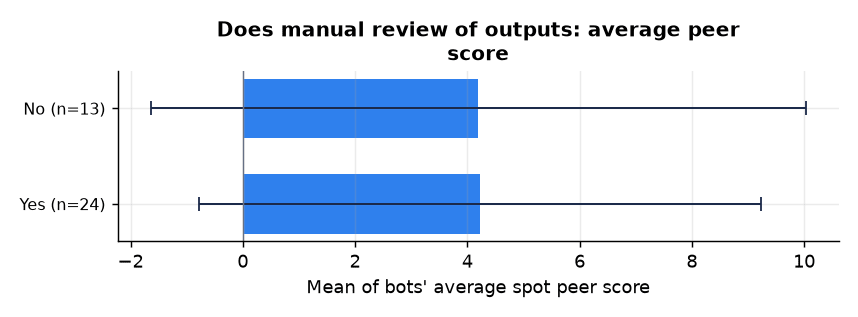
“Does manual review of outputs” shows no clear relationship with peer score (Pearson r = +0.00, p = 0.994, q = 0.994, n = 37). Yes means the maker did significant manual review of bot outputs, beyond sanity checks.
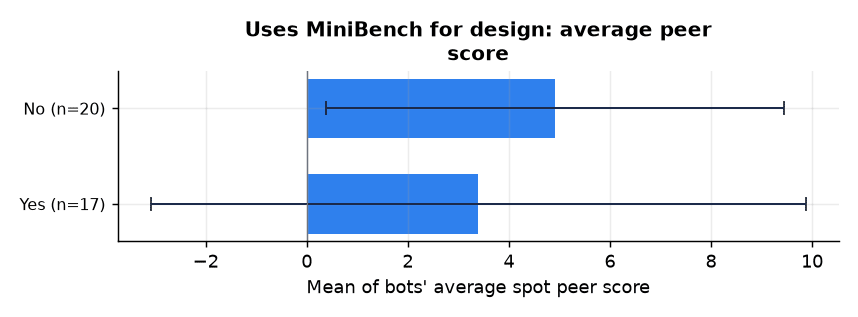
“Uses MiniBench for design” shows no clear relationship with peer score (Pearson r = -0.07, p = 0.682, q = 0.855, n = 37). Yes means the maker ran the bot in MiniBench and used the results to inform design.
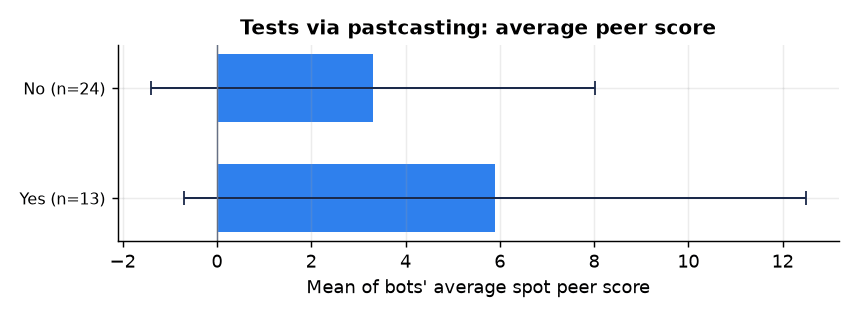
“Tests via pastcasting” shows a weak link to higher peer score (Pearson r = +0.11, p = 0.502, q = 0.736, n = 37). Yes means the bot was tested via pastcasting (questions that already resolved).
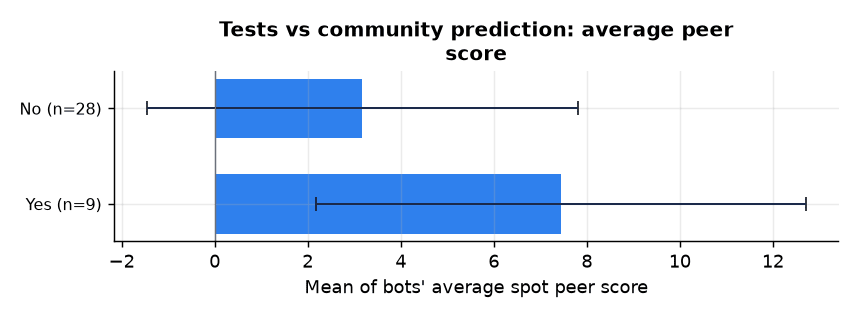
“Tests vs community prediction” shows a weak link to higher peer score (Pearson r = +0.17, p = 0.318, q = 0.614, n = 37). Yes means the bot was tested against community predictions on prediction platforms.
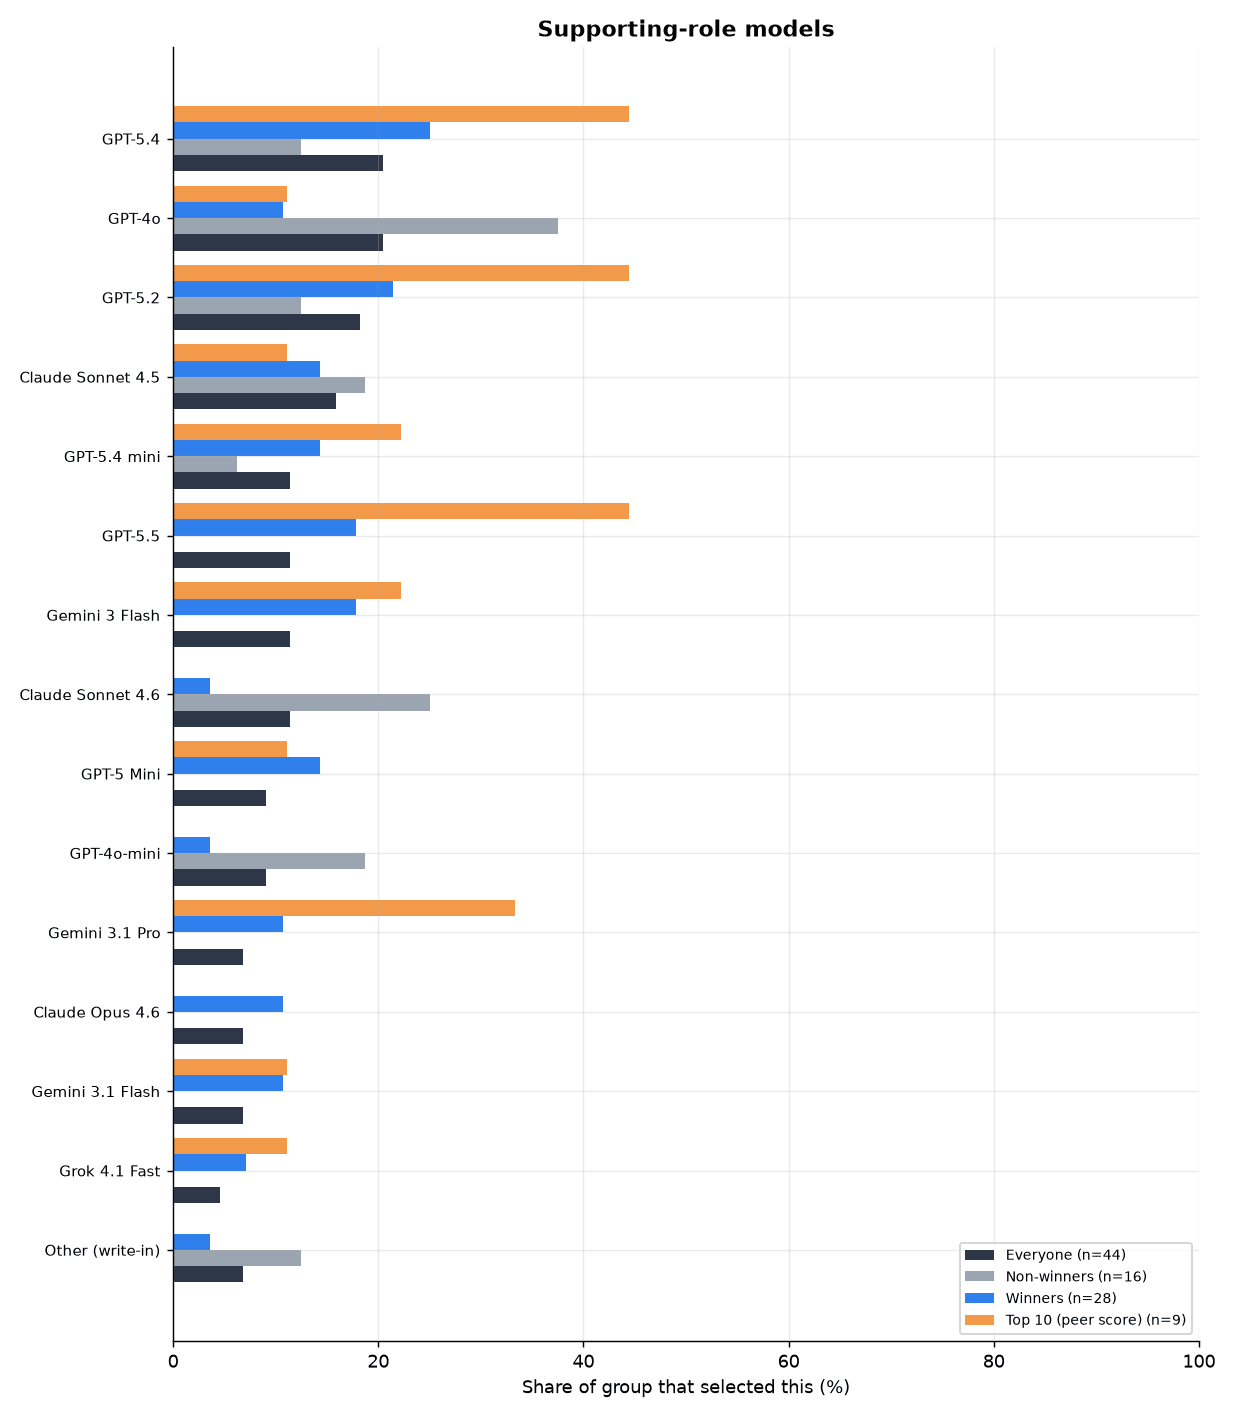
Supporting-role models
Survey question: Which LLM model(s) did you use in supporting roles (i.e. not final predictions)?
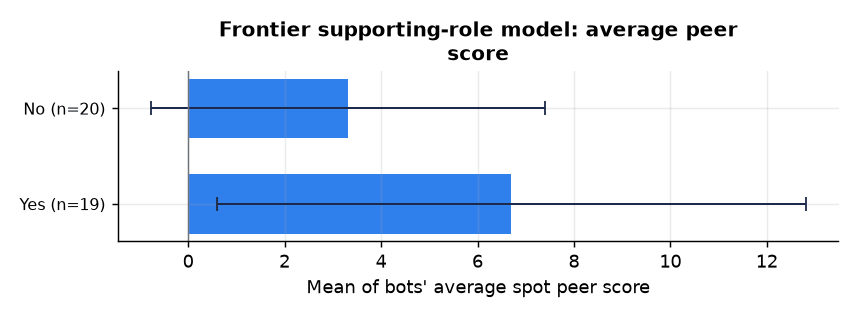
“Frontier supporting-role model” shows a weak link to higher peer score (Pearson r = +0.16, p = 0.335, q = 0.614, n = 39).
Iterations that went live
Survey question: How many iterations of your primary bot did you make that ended up forecasting tournament questions live?
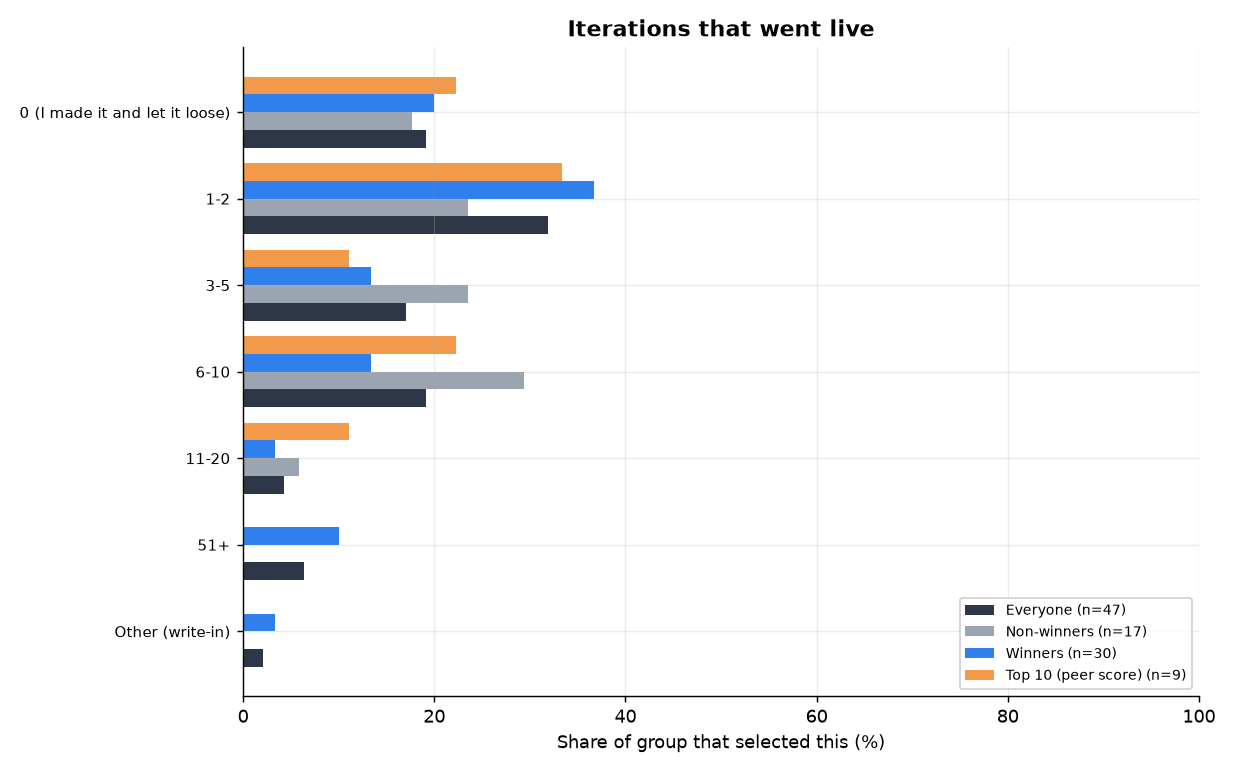
“Iterations that went live (midpoint)” shows a weak link to lower peer score (Spearman r = -0.12, p = 0.438, q = 0.722, n = 41).
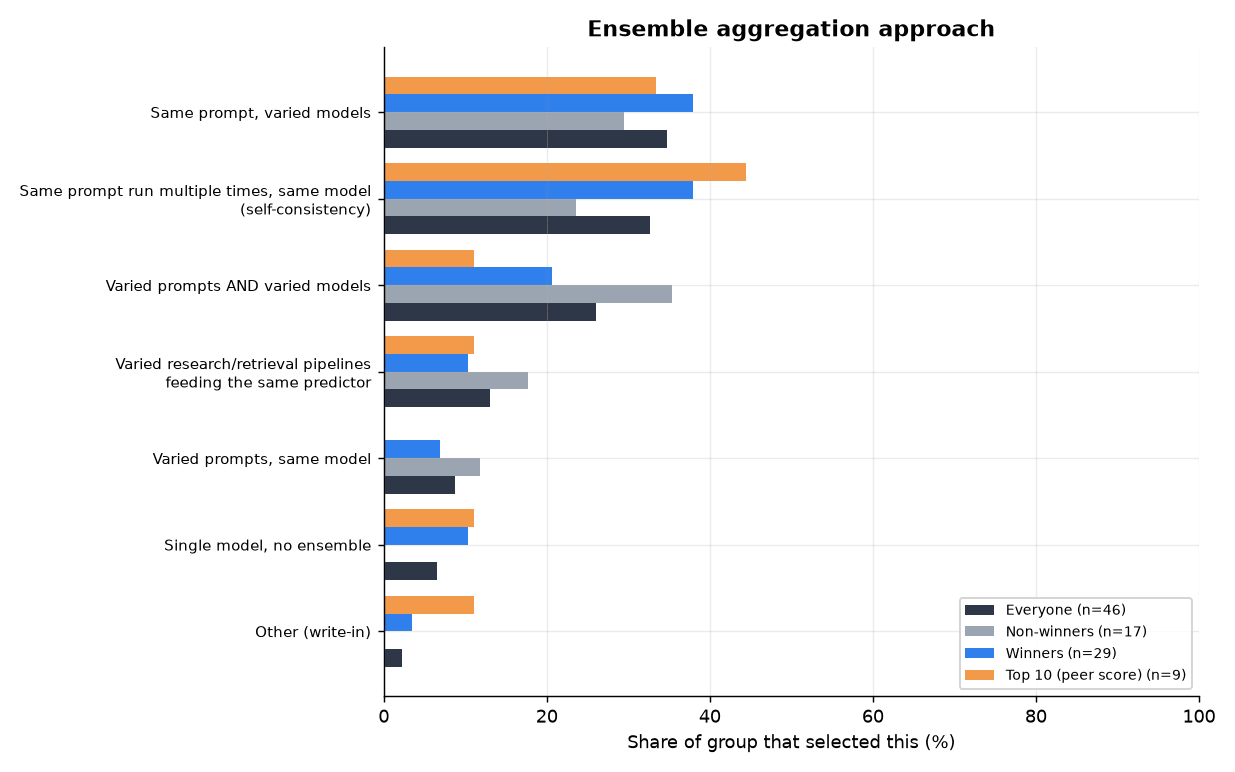
Ensemble aggregation approach
Survey question: How did you aggregate?
“Ensemble uses multiple models” shows no clear relationship with peer score (Pearson r = -0.10, p = 0.535, q = 0.736, n = 41). Yes means the ensemble combined more than one model (answered ‘Same prompt, varied models’ or ‘Varied prompts AND varied models’).
LLM self-experimentation (verification env)
Survey question: Did you give an LLM a verification environment (backtest harness, eval set, scoring loop) and let it self-experiment to produce part of your system?
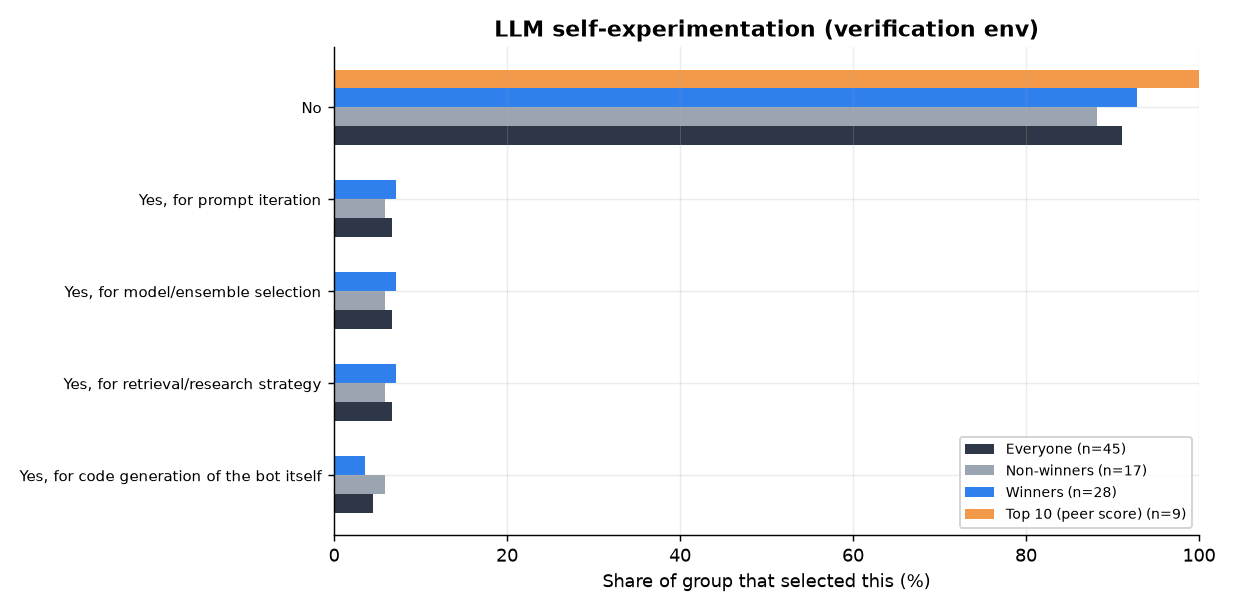
“Gave LLM a verification env” shows no clear relationship with peer score (Pearson r = +0.04, p = 0.817, q = 0.958, n = 40). Yes means the maker answered ‘Yes’ (for any purpose) to giving an LLM a verification environment.
Team size
Survey question: How many people are on your team?
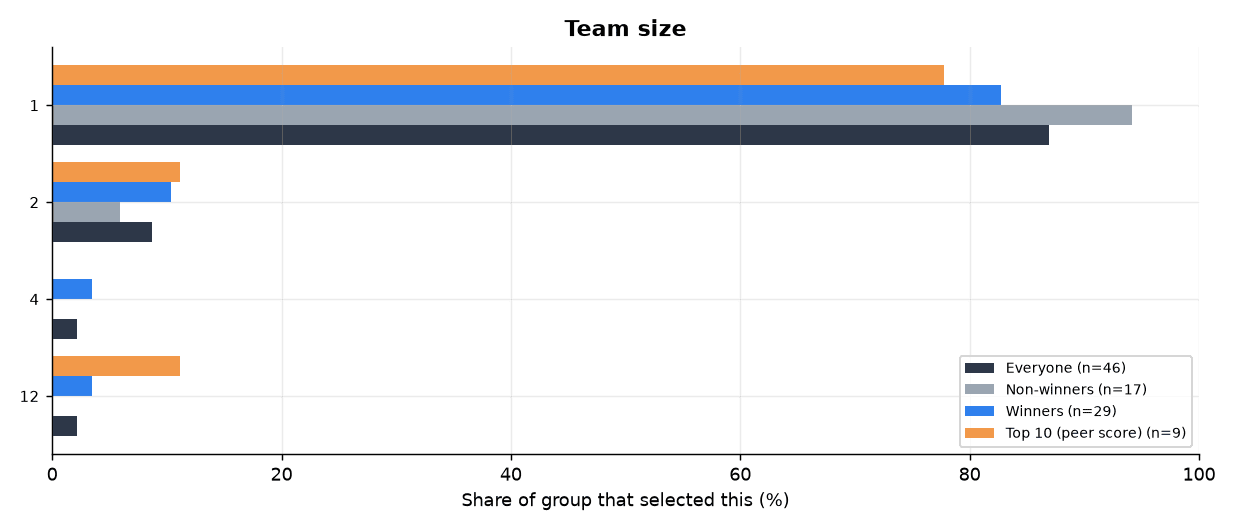
“Team size” shows no clear relationship with peer score (Spearman r = +0.02, p = 0.882, q = 0.958, n = 41). [Graph excluded: this variable is not bucketed for a group chart]
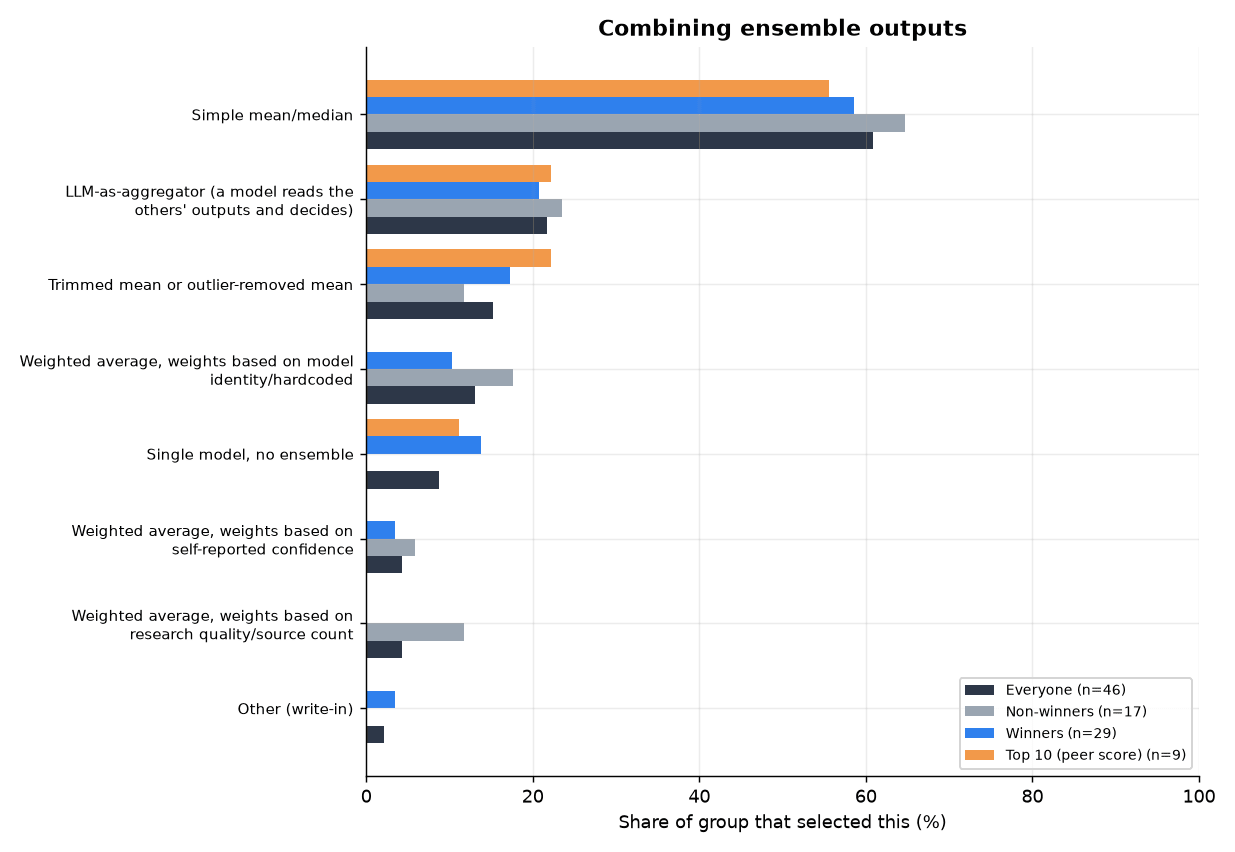
Combining ensemble outputs
Survey question: How did you combine ensemble outputs into the final forecast?
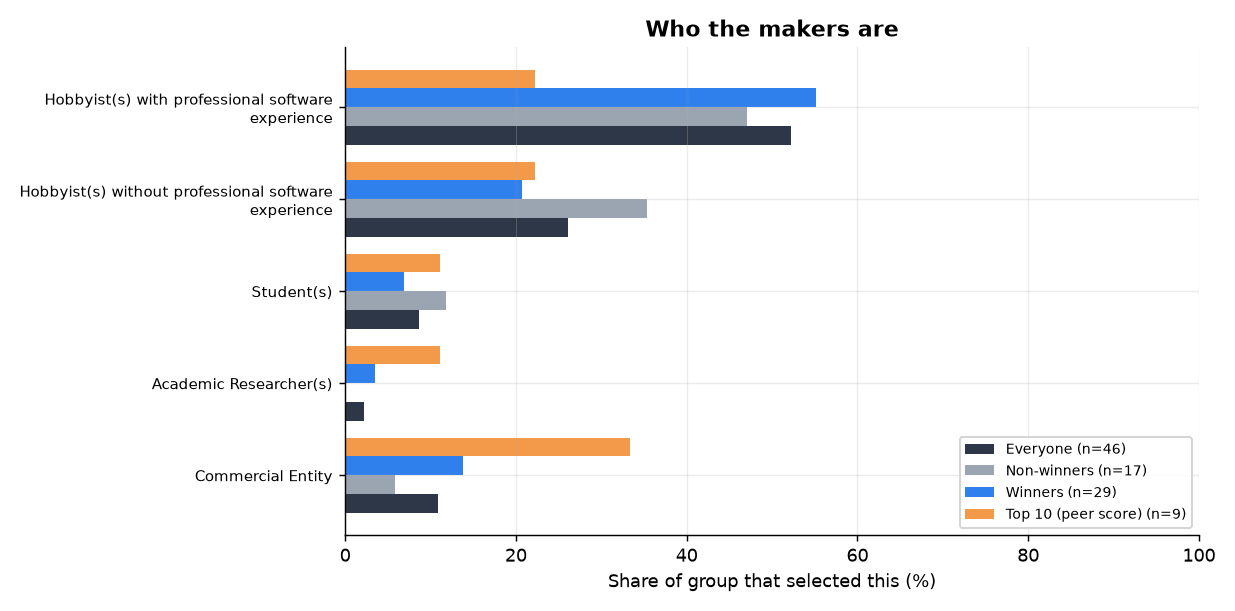
Who the makers are
Survey question: What best describes you?
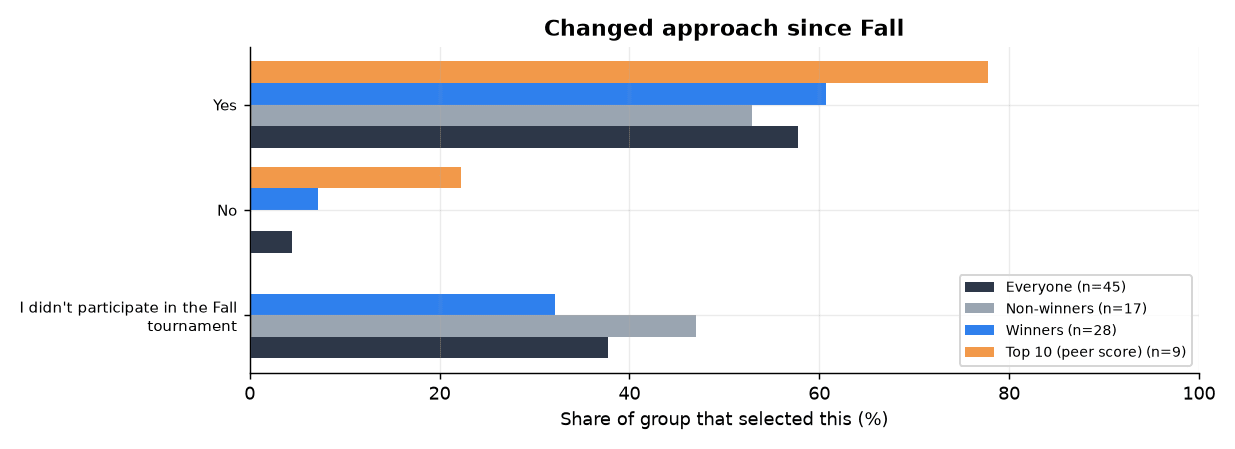
Changed approach since Fall
Survey question: Did you change how your bot predicted questions in Spring compared to Fall?