Assessing the state of AI R&D in the US, China, and Europe – Part 1: Output indicators
By stefan.torges @ 2019-11-01T14:41 (+21)
How does the current state of artificial intelligence (AI) research and development (R&D) compare among the US, China, and Europe? I will publish my findings on this question in two posts. This one focuses on R&D output (scientific publications and patents), and the second one will focus on R&D input. I might also publish a third article that covers conclusions from the first two.
The AI governance community concerned with existential risks has so far mainly focused on US–China relations while neglecting Europe. Part of the reason for this might be that Europe significantly lags behind the two countries in terms of relevant AI R&D. However, my impression is that this has not been substantiated since Europe is simply missing from most analyses.
I also aim to contribute to a more clear-eyed comparison between the state of AI R&D in the US and China. This may improve the general conversations about an “AI arms race,” which seem to be especially prominent in the US, where many believe that the country is “losing” to China.
Since many reports and articles on this comparison tend to focus on a single analysis or study, my goal was to review the available literature for the most important indicators of AI R&D, allowing a more holistic picture. I think additional work on constructing a solid index for AI R&D would be valuable. The Center for Data Innovation, Jeffrey Ding, and a German think tank, Stiftung Neue Verantwortung (only available in German), have done some preliminary work on this.
Summary
- I examined the number and quality of publications as well as the number and quality of filed patents, since they are the most common R&D output indicators.
- Studies or reports in this field do not seem to be particularly rigorous or reliable. The indicators I examined are very coarse and do not capture many relevant nuances. I did not attempt to arrive at numerical estimates. Most studies and analyses do not consider machine learning research alone, but all research related to artificial intelligence. This includes work on symbolic AI (e.g., expert systems).
- For almost all indicators, the US institutions seem to be the global leaders. This is clearest for conference contributions and top benchmark papers.
- The output generated by European and Chinese institutions often seems to be in the same ballpark. At times, China seems to have a slight lead (e.g. highly cited publications), while at other times, Europe does (e.g. top conference contributors). Growth trends seem to favor China.
- The data from AI conferences and AI benchmarks seem to confirm that this is also the pattern for machine learning output more narrowly. However, one source suggests that China generates much more deep learning output than both the US and Europe.
Methodology and limitations
Scientific publications and patents are the most common quantitative indicators of R&D output.[1] One could also use qualitative assessment tools like expert evaluation, but this is outside the scope of this post. My impression is also that these two indicators are widely used in the field of AI (e.g., China AI Development Report 2018 and AI Index 2018).
My focus was on creating a snapshot of the current landscape, as opposed to a projection into the future. However, where available and clear, I do point out trends that one could cautiously use to extrapolate into the future.
I looked for relevant sources by conducting keyword searches for the various indicators on Google and Google News. I was also already aware of several reports and studies on this topic. I looked up any cited references. I welcome pointers to additional sources.
My general impression was that the quality of studies is not particularly high in this field. There is no peer-reviewed work available as far as I can tell. Reports do not compare their findings, and methodologies are often vague. Thus, I would treat individual findings with the appropriate care. I have tried to provide methodological details where relevant and available. I did not apply a strict definition for “Europe,” since the sources differed in their definitions. The reader may assume that “Europe,” unless otherwise stated, refers roughly to the European Free Trade Association (EFTA), which includes all EU member states, Iceland, Liechtenstein, Norway, and Switzerland.
I did not attempt to arrive at numerical estimates for the indicators. Instead, I decided to share my conclusions in qualitative terms to avoid the perception of rigor and precision, which the underlying data do not permit.
The indicators I examined are on a very high level and fail to capture a lot of nuances. For instance, AI technology has many different applications (e.g., natural language processing, computer vision), is used in many different sectors (e.g., online retail, defense), and has different layers (e.g., development platforms like TensorFlow compared to a concrete AI algorithms). The state of R&D with respect to these might differ significantly across countries or regions. However, I believe a more coarse-grained investigation is still informative rather than misleading.
Almost all studies and analyses I found do not focus only on machine learning. They include all publications related to AI, which also includes work on symbolic AI (e.g., expert systems). This might severely limit the relevance of these indicators, since the most notable advances in AI capabilities since 2012 have been in machine learning (deep learning and reinforcement learning in particular). The severity of this limitation depends on the relevance of symbolic AI for future progress. There is considerable disagreement on this point amongst AI experts.
Scientific publications
Numerous sources have reported data on the total number of publications by country or region. Some also included an analysis of “highly cited” publications, but definitions of this were not always clear or consistent. I also aggregated numerous analyses on the distribution of contributions to top AI conferences as a separate indicator. Lastly, I included my own analysis of AI benchmark papers as reported by the Electronic Frontier Foundation, since I am not aware of any other analysis of this dataset but consider it a good and unique representation of cutting-edge AI research.
Number of publications. In light of all the evidence I could find, I tend to believe that in terms of the overall number of scientific publications on AI, Europe is slightly ahead of the US and China, with China gaining ground. According to the only source that restricted the analysis to deep learning, China seems to have a significant lead on the US, which, in turn, is significantly ahead of Europe. The trend lines do not suggest that this ranking will change any time soon.
-
AI Index 2018 (p. 10): “Europe has consistently been the largest publisher of AI papers — 28% of AI papers on [the Scopus database] in 2017 originated in Europe.” However, it seems like China (in second place) has been gaining ground on Europe (see graph below). However, papers seem to have been assigned to countries based on the location of the author, which would count a paper from “Google Zurich” as European, not American. This likely underestimates the share of papers by US-owned institutions, since I would expect more of them to have relevant offices around the world.

-
WIPO Technology Trends 2019 – Artificial Intelligence (World Intellectual Property Organization) (p. 90): Also using the Scopus database, the authors find that Chinese institutions are leading in terms of scientific publications on AI, followed by the US, the UK, India, Japan, Germany, France, Canada, Italy, and Spain. An eyeballed aggregation would put all European countries (including the UK) on roughly equal footing with China and the US, each accounting for around 20% of the total. It is hard to compare this to the AI Index, since I do not know which time period they analyzed. I also do not know how they assigned publications to specific countries.
-
China AI Development Report 2018[2] (p. 15): Using the Web of Science database, the authors find China and the US as the leading countries in terms of AI paper output from 1997 to 2017. However, if aggregated, the European countries’ output is significantly higher than that for either of them: ~450,000, compared to ~370,000 and ~330,000, respectively. They do not give precise numbers for individual years. The trend lines seem to suggest that China has had a higher growth rate over the past 20 years. I do not know how they assigned publications to specific countries.
-
Global Artificial Intelligence Industry Data Report 2019[3]: Also using the Web of Science database (and similar keywords, from what I can tell), they echo that China has published the most AI papers in the last decade and is also now leading in terms of annual output. “The US ranks second in terms of publication volume, followed by India, Germany, and Japan.” However, given the limited translation available, it is impossible for me to aggregate the European countries. I do not know how they assigned papers to countries.
-
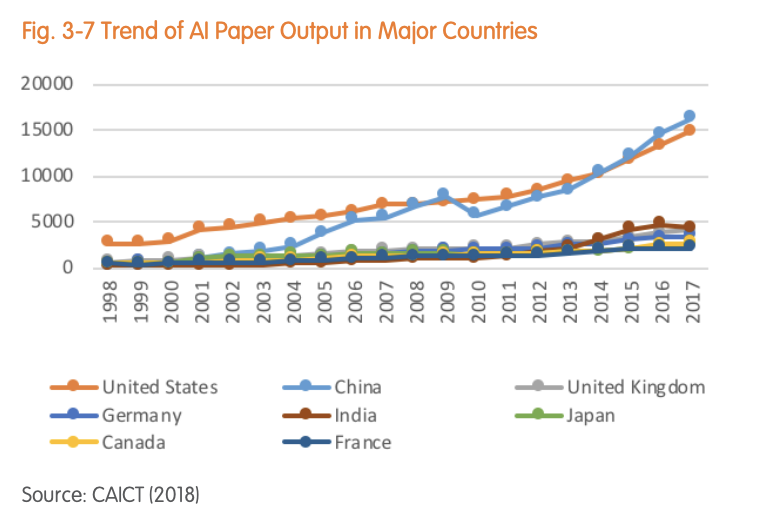
2018 World AI Industry Development Blue Book (p. 14): Relying on a 2018 report by the China Academy of Information and Communications Technology (CAICT; see footnote 2), the authors of this joint report by the CAICT and Gartner find that the most AI publications from 1998 to 2018 came from the US (149,096), followed by China (141,840). However, aggregating all European countries (145,551) puts them ahead of China. In terms of annual output, China is likely in the lead, and the trend line also seems to favor them (see graph below). It is not clear what methodology they used. It is likely similar to the 2019 report from CAICT (see above).
-
US National Artificial Intelligence Research and Development Strategic Plan (p. 13): They also used the Web of Science database but, contrary to the other reports, the authors of this document only examined journal articles mentioning “deep learning” or “deep neural network.” China seems to be in the lead, closely followed by the US, with all other countries trailing off. Even aggregated, I would expect European countries to be significantly behind. The trend line seems to favor China and the US (see graph below). I do not know how they assigned papers to countries.

Number of highly cited publications. There is contradictory evidence for this indicator. However, all sources agree that Europe is not in the lead. I would expect the US and China to be in the same ballpark, with trend lines favoring China. The sources where I can best determine that they actually analyzed highly cited work seem to favor the US (AI Index 2018, Allen Institute analysis). I could not find evidence for machine learning specifically, since the US National Artificial Intelligence Research and Development Strategic Plan does not include analysis for highly cited work.
-
AI Index 2018 (p. 17): Looking at the Scopus database, the authors find US-affiliated authors leading in terms of Field-Weighted Citation Impact, followed by European- and Chinese-affiliated ones. Similar to the raw number of AI papers in the database, China seems to be gaining ground on Europe, judging from the trend line over the past few years (see graph below) The latest numbers are from 2016.

-
China AI Development Report 2018 (p. 20f.): Using the Web of Science database, this report puts China in the lead ahead of the US and any European country, both for the decade between 2007 and 2017 and in terms of annual output in 2017. Aggregating all European countries out of the top 10 from 2007 to 2017 (the UK, Germany, France, Italy, Spain), they almost catch up to the US and China, reaching 2,096 highly cited papers, compared to 2,241 and 2,349, respectively. The same applies to “hot papers.” Unfortunately, I do not know how they operationalized either “highly cited” or “hot.” Eyeballing combined European output in 2017 alone; China is still in the lead with an increasingly large margin, ahead of the US and Europe, which seem to be roughly tied (see graph below).

-
Global Artificial Intelligence Industry Data Report 2019: They use the same database as the China AI Development Report 2018 and seem to find very similar numbers.
-
2018 World AI Industry Development Blue Book (p. 15): The authors state that the Chinese share of the output of highly cited AI papers has risen from “less than 15% in 2008 to 47% in 2017.” Since they rely on an inaccessible primary source and do not provide a methodology, I find it hard to determine the reliability of this claim.
-
Analysis by the Allen Institute for Artificial Intelligence (2019)[4]: Using data from the Semantic Scholar project, the authors examined the distribution between the US and China for highly cited AI papers (top 50%, top 10%, and top 1% in terms of citation count). For the top 50% of papers in 2018, the US and China account for ~25% each; for the top 10%, the US accounts for 29% and China for 26.5%; and for the top 1%, the US accounts for ~36% and China for ~30%. Extrapolating from past trends, the authors expect China to take the lead in 2020 (top 10%) and 2025 (top 1%), respectively. However, they did not include an assessment of European institutions and could not provide numbers upon request. Given the combined share of US and Chinese publications, it is very unlikely that Europe enjoys a decisive lead. At the same time, it also seems implausible that they lag very far behind. It seems sensible to assume that European countries make up between 50% and 80% of the respective remaining shares, which would make them competitive in the top 50% and top 10% of papers, but likely not competitive in the top 1% of papers. However, I do not give this estimate much weight.
Number of publications at top AI conferences. For this section, I examined contributions to the most relevant AI conferences as measured by their h5-index on Google Scholar. I included conferences in the top 10 publications of the categories Artificial Intelligence and Computer Vision & Pattern Recognition. In terms of accepted papers at such conferences, US institutions enjoy a clear lead ahead of European and Chinese ones. The evidence also shows an edge for European institutions over Chinese ones, but not as decisive as the US lead. This trend is broadly echoed in aggregative data from the 2019 Global Artificial Intelligence Industry Data Report. They studied accepted papers from the Conference on Computer Vision and Pattern Recognition (CVPR), the International Conference on Computer Vision (ICCV), NeurIPS, and the International Conference on Robotics and Automation (ICRA) and found American authors to account for 52% of contributions and Chinese authors[5] to account for 18% of contributions. They do not provide numbers for European authors. Out of the top 15 institutions, they found eight to be based in the US, four in Europe (ETH, CNRS, INRIA, Max-Planck-Gesellschaft), and three in China. The only exception to this general pattern is the AAAI Conference on Artificial Intelligence, at which Chinese and US institutions are on equal footing and European ones are lagging significantly behind (see below). I do not know what accounts for this. I would expect most papers at these conferences to relate to machine learning, as opposed to symbolic AI.
-
Conference on Computer Vision and Pattern Recognition (CVPR): I could not find any primary sources on this in terms of accepted papers.
-
Conference on Neural Information Processing Systems (NeurIPS): Among the top 20 institutions in terms of citations received from 1996 to 2019, 15 are based in the US, two in Europe (Max-Planck-Gesellschaft, UCL), two in Canada, and one in Israel. No Chinese institution made the list. Among the top 20 institutions in terms of accepted submissions in 2019, 15 were from the US, two from Europe (Oxford, INRIA), two from Canada (MILA, Toronto), and one from China (Tsinghua). In 2018, 17 were from the US, two from Europe (Oxford, ETH), and one from China (Tsinghua). In 2017, 15 were from the US and four from Europe (Oxford, ETH, INRIA, Cambridge). No Chinese institutions were among the top 20. This general trend is echoed in a more comprehensive publication index for the same year (see graph below).

-
International Conference on Learning Representations (ICLR): The only primary source I could find on ICRL does not provide a year for their analysis. However, since OpenAI appears on the list, it cannot be older than 2016. Among the top 20 institutions in terms of accepted papers, 15 are from the US, three from Europe (ETH, Oxford, Cambridge), and two from Canada (Toronto, MILA). None are from China.
-
European Conference on Computer Vision (ECCV): I could not find any primary sources on this in terms of accepted papers.
-
International Conference on Machine Learning (ICML): Among the top 20 institutions in terms of accepted contributions in 2019, 14 were from the US, four from Europe (Oxford, ETH, EPFL, INRIA), one from China (Tsinghua), and one from South Korea (KAIST). In 2018, 13 were from the US, six from Europe (Oxford, INRIA, EPFL, ETH, Max-Planck-Gesellschaft, Cambridge) and one from Canada (Toronto). No Chinese institution made it into the top 20.
-
International Conference on Computer Vision (ICCV): I could not find any primary sources on this in terms of accepted papers.
-
AAAI Conference on Artificial Intelligence: In 2018, the US and China were clearly leading in terms of accepted papers: 268 and 265, respectively, according to the AI Index 2018 (p. 20). European countries were far below that, at around 74.
Number of top benchmark publications. I analyzed the AI Progress Measurement database of the Electronic Frontier Foundation. I excluded duplicate entries (i.e., papers that were included on multiple benchmarks) and only studied the five best-performing algorithms per benchmark.[6] Across all benchmarks, US institutions clearly dominate. If one counts DeepMind as a US institution, then US institutions were involved in 91 unique papers of the database, clearly ahead of Canada (14) and China (14). If all European countries (including the UK, but excluding DeepMind) are aggregated, their institutions were involved in 17 unique papers, which would put them ahead of China. These benchmarks only capture advances in machine learning.
Patents
I aggregated the numerous sources on the total number of patent families by country or region. I also tried to find reliable data on highly cited or highly relevant patents, but I could only find a single graph in a report by the World Intellectual Property Organization.
Number of patent families. Based on the available evidence, it seems to me that the US is the global leader in terms of AI patent output. I have considerable uncertainty regarding the comparison of Europe and China. Tentatively, I would put Europe slightly in front for now based on the AI Index 2018 and the report by the UK Intellectual Property Office (see below). There also appears to be some evidence that the patent count in China is inflated (via Jeffrey Ding’s US congressional testimony).
-
AI Index 2018 (p. 35): The authors used the patent database from amplified.ai (methodology). They find that the aggregate AI patent count of inventors in the UK, France, and Germany – which presumably accounts for the majority of relevant European patents – clearly lags behind that of the US. They also rank lower than Korea, Japan, and China, but the difference is much smaller and might vanish if one included all European countries in the analysis. China, however, seems to have a higher growth rate than the US and Europe (see graph below).

-
WIPO Technology Trends 2019 – Artificial Intelligence (p. 60) (methodology available here): Among the top 30 applicant organizations for AI patent families (not exclusively machine learning) in 2018, 12 were from Japan, six from the US (IBM and Microsoft in the two top spots), five from China, four from Europe, and three from South Korea. It is noteworthy that Chinese public institutions seem to apply for many more patents than those in any other country or region, and by a very significant margin. The report also contains a whole chapter on the geographical distribution of patent filings, which I skimmed but did not include, because the filing location can be somewhat misleading. The number of filed patents in a particular country or region is usually a better indicator of the respective market for goods or services relating to the patent, as opposed to the research capacity behind the patent.
-
Artificial Intelligence – A worldwide overview of AI patents and patenting by the UK AI sector (p. 12f.): The UK Intellectual Property Office finds that among the top 20 applicants by total number of AI patent families from 1998–2017, nine are from China, four from the US (IBM and Microsoft in the two top spots), five from Japan, one from South Korea, and one from Germany. However, in terms of the total number of applicants/inventors by country during the same time period, the US is clearly in the lead, with at least four times as many patent applications as Japan, ranked second. China is ranked fourth. Aggregating the European countries in the top 20 yields a total that is ahead of China but still far behind the US (see graph below). The fact that the analysis goes back to 1998 makes it less relevant for assessing current output.

-
China AI Development Report 2018 (p. 30): The authors provide a graph that shows China leading in terms of total patent count, slightly ahead of the US and presumably clearly ahead of European countries. However, they do not detail their methodology and do not cite the actual numbers. They also seem to count patents based on the respective filing office as opposed to inventor country/region, which confounds any inferences. All of this makes the results less clear-cut and leads me to give their findings significantly lower weight.
Number of highly cited patent families. The only source on this I could find is the WIPO Technology Trends 2019 – Artificial Intelligence report (p. 88). They find that US institutions have filed ~28,000 highly cited patent families, followed by Japan (~6,000), Germany (~1,000), South Korea (~1,000), and China (~1,000). I could not find their definition of “highly cited” or the time period from which the data are sourced. I would not give this a lot of weight, but the margin of the US lead is still noteworthy.
People in the effective altruism community might be particularly interested in indicators that track AI R&D as it relates to the development of transformative AI (TAI). However, this is outside the scope of this post. I should note that out of the indicators included in this post, scientific publications are probably more relevant than patents because the former are more likely to include foundational breakthroughs, which seem to be a better indicator for R&D relevant for TAI. Similarly, highly cited publications are likely more informative than the total number of publications. ↩︎
This report is authored by the China Institute for Science and Technology Policy at Tsinghua University. I am not in a position to assess the extent to which this report is shaped by the interests of the Chinese government. Tsinghua University is one of the most reputable universities in China and a leading institution in terms of AI research in China. ↩︎
This report is authored by the China Academy of Information and Communications Technology (CAICT). While it is an organ of the Chinese government and “subordinate to the powerful Ministry of Industry and Information Technology (MIIT)” (New America), I am not in a position to assess the extent to which this report is shaped by the interests of the Chinese government. It is notable that even though they used a very similar methodology to the China AI Development Report 2018, they seem to include far fewer papers, and the UK does not seem to make it into the top 5 (contrary to the China AI Development Report 2018). All of this makes me somewhat skeptical about this source. ↩︎
From Wikipedia: “The Allen Institute for Artificial Intelligence (abbreviated AI2) is a research institute founded by late Microsoft co-founder Paul Allen. The institute seeks to achieve scientific breakthroughs by constructing AI systems with reasoning, learning, and reading capabilities.” ↩︎
Since I do not know their methodology, it is not clear if this includes Chinese-Americans with Chinese names or only authors from Chinese institutions, etc. ↩︎
I did this to save time while including the most cutting-edge research. This, however, might exclude papers that were breakthroughs at the time but have since been superseded. Analyzing all entries would solve this issue. ↩︎