EAGxAmsterdam 2025: What We Learned
By James Herbert @ 2026-04-02T14:34 (+61)
James Herbert, Co-Director at Effectief Altruïsme Nederland and EAGxAmsterdam Team Lead
EAGxAmsterdam 2025 took place on 12–14 December at B.Amsterdam, bringing together 517 attendees from across Europe. This is a brief write-up of what went well, what didn't, and what I think other EAGx organisers can learn from it.
The headline numbers:
- 517 attendees (up 36% from 380 at EAGxUtrecht 2024) — one of the largest EAGx events in recent years, behind only EAGxBerlin 2025
- €387 cost per attendee (target was €520; 2024 was €586)
- 10 reported new connections per attendee (target was 10, 2024 was 10)
- 906 applications (34% above target)
- 57 GWWC pledges (26 full 10% Pledges + 31 Trial Pledges) — the strongest pledge outcome of any EAGx to date, and ahead of every EAG and EAGx event until that point except EAG NYC 2025. GWWC estimated this represents ~$2.9M in expected lifetime giving ($436K counterfactually adjusted).
- NPS of 63 (mean recommendation: 8.86/10)
Budget
Cost per attendee came in at €387, down from €586 at EAGxUtrecht 2024 — a 34% improvement while serving 36% more people.
The budget is dominated by venue and catering (~70%), with contractors (~23%) the next largest line. Compared to 2024, venue + catering fell significantly despite the larger event, contractor costs rose as we brought on a more experienced team, and paid advertising roughly doubled from €2,599 to €4,176 — a modest increase that drove outsized returns in applications.
The case for investing in marketing
The single biggest change from 2024 was investing in professional marketing. We worked with two external teams: one for strategy and creative assets (not so creative), and one for Meta campaigns (Amplify). This was an investment, but I think it was clearly worth it.
The result: 906 applications versus 570 in 2024 — a 59% increase. We reduced cost per attendee from ~€586 to ~€387. More people, better cost efficiency. The marketing spend paid for itself many times over by spreading fixed costs (venue, AV, catering minimums) across more attendees.
I'd strongly encourage other EAGx organisers to consider professional marketing support, especially for Meta campaigns. The EA community's organic reach has limits, and if we're serious about growing the pipeline of engaged people, we need to invest in reaching them. Our experience suggests you can do this without sacrificing quality — 53% of our attendees were at their first EAGx, and quality metrics held steady or improved.
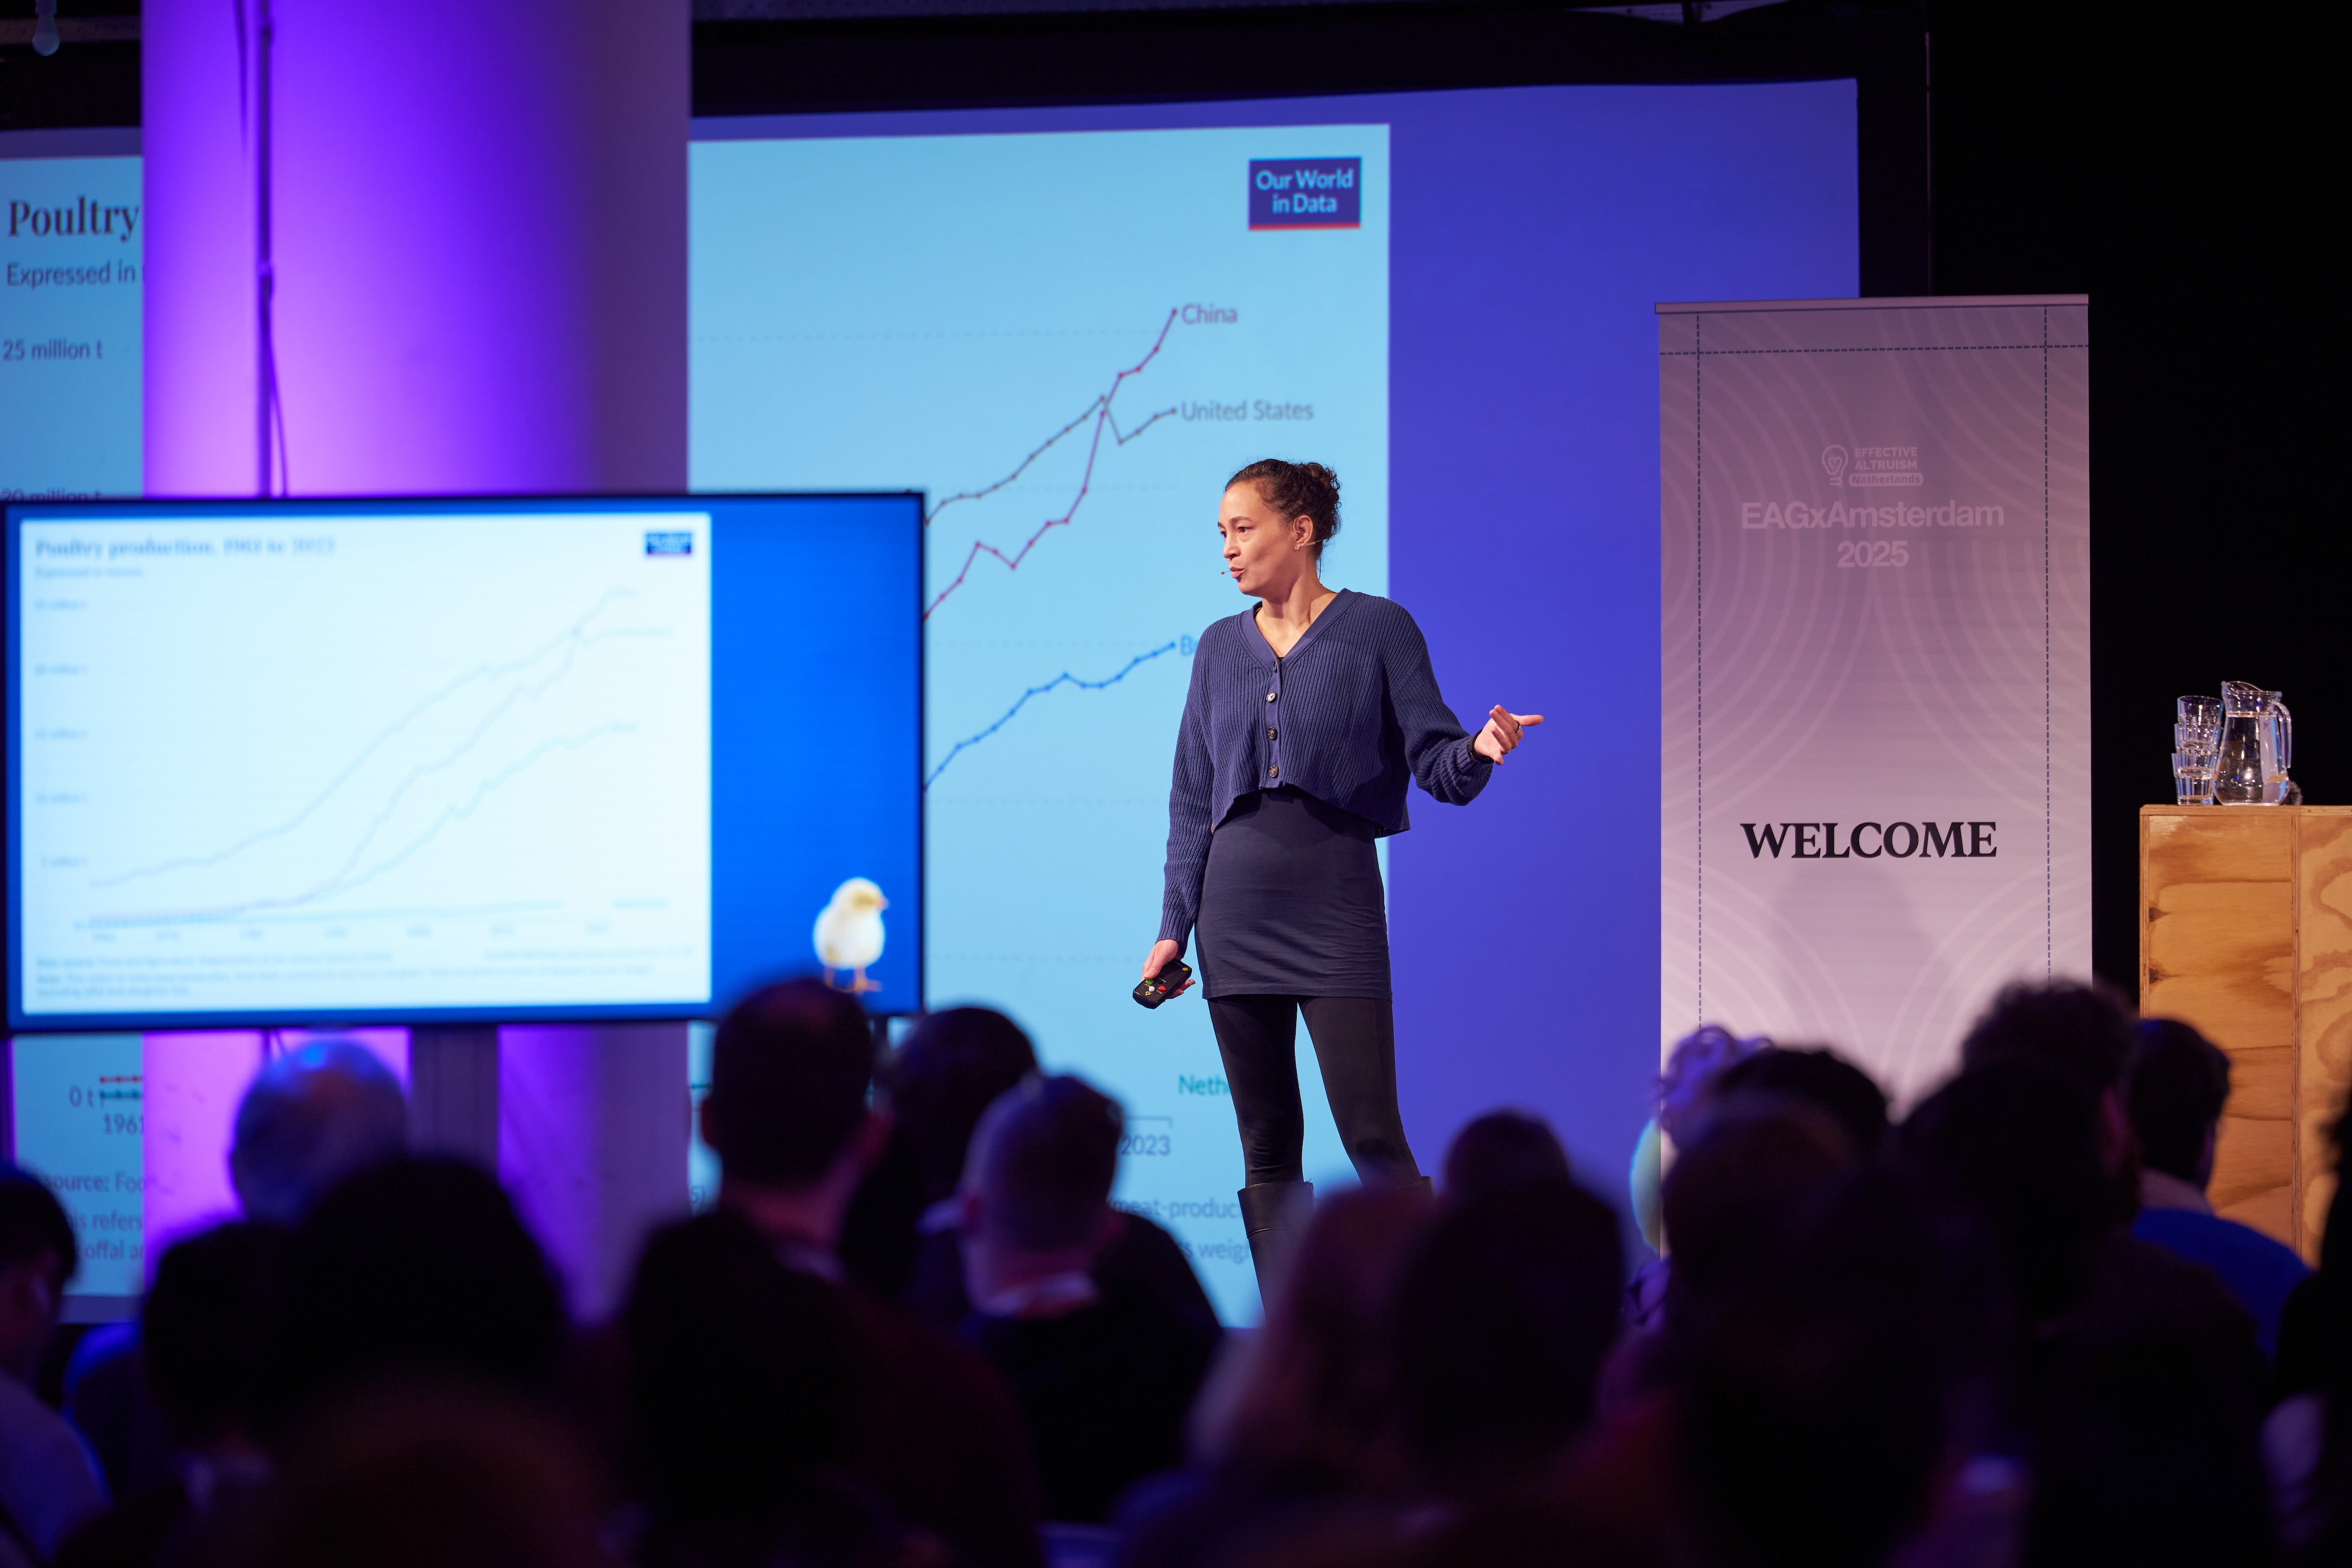
Content highlights
I'm really proud of the programme Ricardo built this year. We built a lineup that combined international EA celebrities (Benjamin Todd, Michael Plant, Bob Fischer, Sjir Hoeijmakers, Stien van der Ploeg, etc.), stalwarts of the regional community, and speakers with significant standing outside EA — Sarah Bouchie (CEO of Helen Keller Intl, a GiveWell top charity, at her first EAGx), Arthur Baker (Chief of Staff to Nobel laureate Michael Kremer), Susi Snyder (ICAN, 2017 Nobel Peace Prize), Dirk-Jan Koch (Director of the Dutch Advisory Council on International Affairs), and Paul Meerts (former Deputy Director General, Clingendael Institute). Talk satisfaction rose from 4.27 to 4.40 year-on-year.
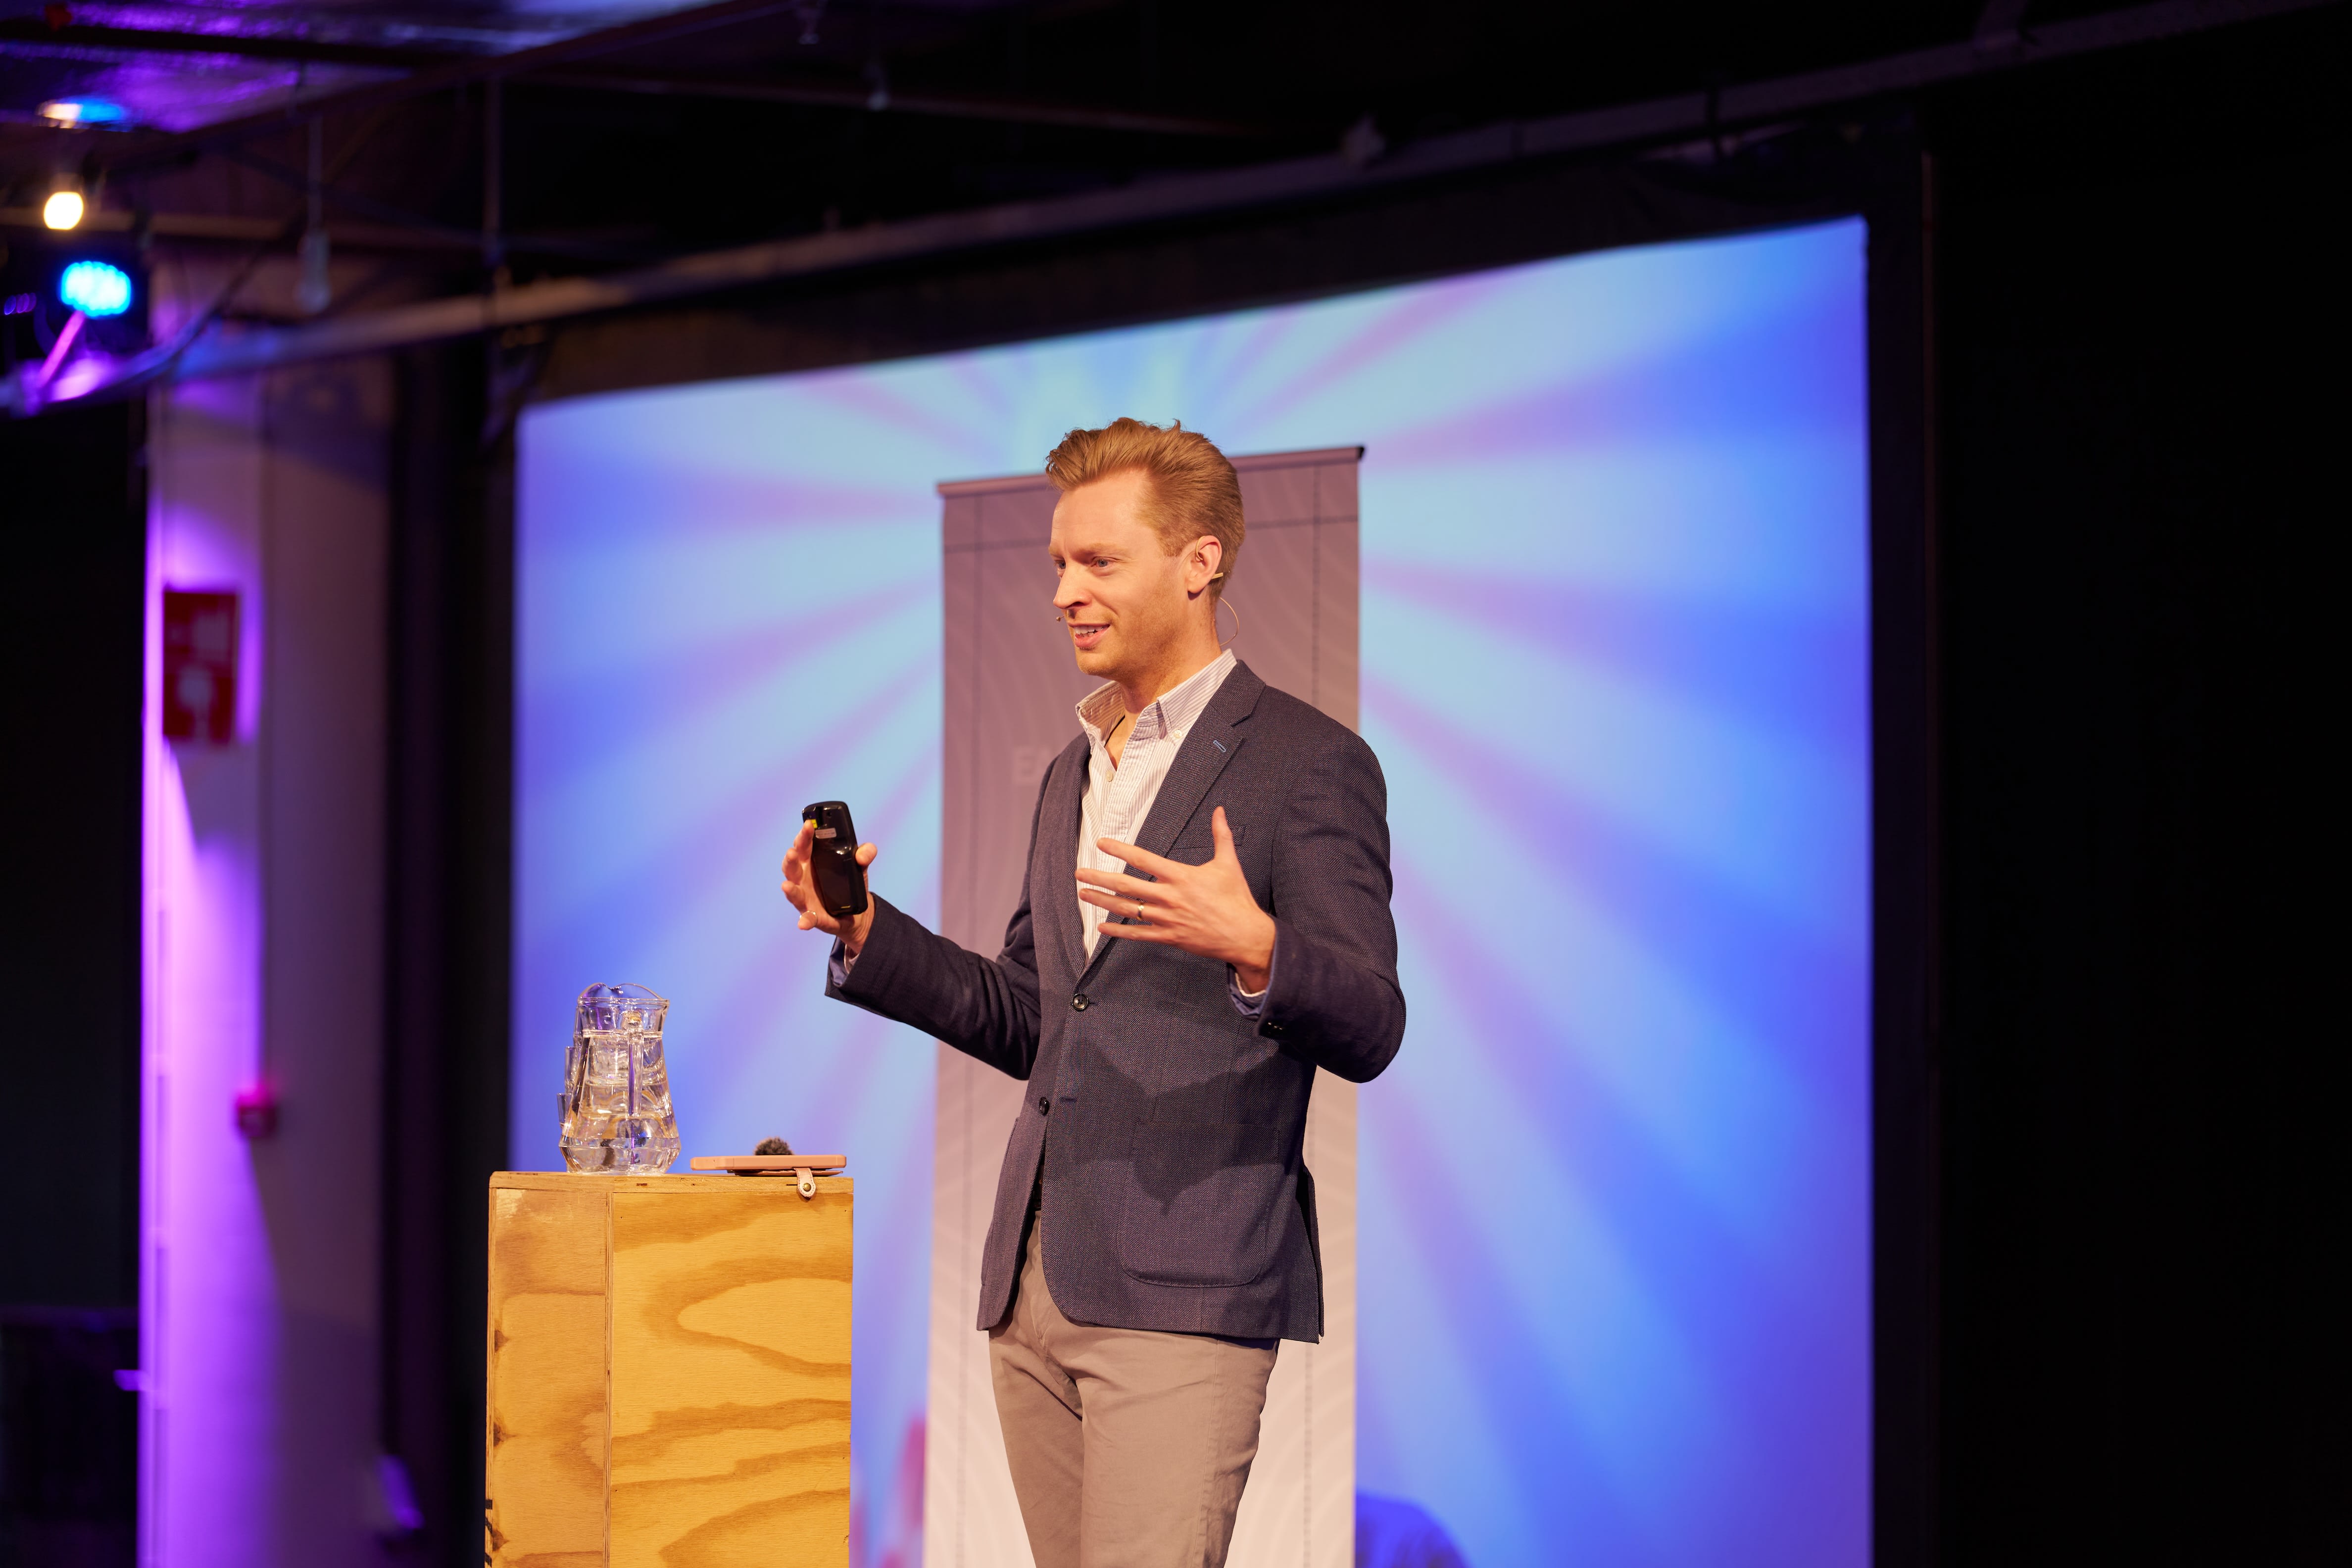
We also experimented with a "Talk + Fireside Chat" format — a short talk followed by a moderated conversation — and it scored 4.93/5 on Swapcard, compared to 4.26 for standard talks. I'd recommend other organisers try this.
Michael Plant wrote publicly afterwards about his experience, noting he left "much more optimistic" about the EA movement's direction.
What didn't work
Being transparent about the shortcomings:
- The December date was unpopular. Satisfaction with the date dropped from 4.30 to 4.07, with attendees citing exam and holiday clashes. We'll look at this for next time.
- Venue noise was a real problem. The 1:1 spaces were too loud for meaningful conversation, and sound leaked between rooms. We had more attendees than expected.
- Swapcard remains frustrating. Scored 3.74/5, with increased negative mentions in qualitative feedback. Bugs, crashes, confusing navigation.
- Female attendance dropped from 40% to 35% of survey respondents.
- We missed scheduling BIPOC, Queer, and Neurodivergent meetups, which should have been in the programme from the start.
What I'd tell other EAGx organisers
- Invest in marketing. It's the highest-leverage thing we changed. Professional Meta campaigns and early awareness-building drove a 59% increase in applications without compromising quality.
- Hire experienced contractors. This made a huge difference for us. Our production officer, Chiona, is an events professional who also did EAGxUtrecht 2024 with us. Our admissions officer and volunteer coordinator, Kars, had done the same job at EAGxUtrecht — he knew the systems, the failure modes, and the pace required, and he handled 906 applications without breaking stride. Our content officer, Ricardo, has years of experience organising EA events and hosting conferences. And as mentioned above, we brought in professional marketing teams rather than doing it in-house. All of these people were simply excellent at their jobs, and I think that's because we hired for relevant experience rather than just enthusiasm or familiarity with EA.
- Try the Talk + Fireside Chat format. Our best-received sessions used it.
- Don't neglect venue acoustics. Noise complaints dominate qualitative feedback at events like these and they directly undermine the core value proposition: good 1:1 conversations.
- Plan for GWWC pledge infrastructure early. Having a proper pledge booth was clearly high-impact — 57 pledges representing $2.9M in expected lifetime giving ($436K counterfactually adjusted) is a remarkable return.
- Get photos back within 48 hours. We were slow here, which limits the social media momentum after the event.
- Set clear goals and make sure everyone knows them. Alongside the main project management spreadsheet, we kept one simple document with the key targets. It meant everyone on the team — contractors, volunteers, the lot — knew what we were working towards. It sounds basic, but it kept us aligned.
Looking ahead
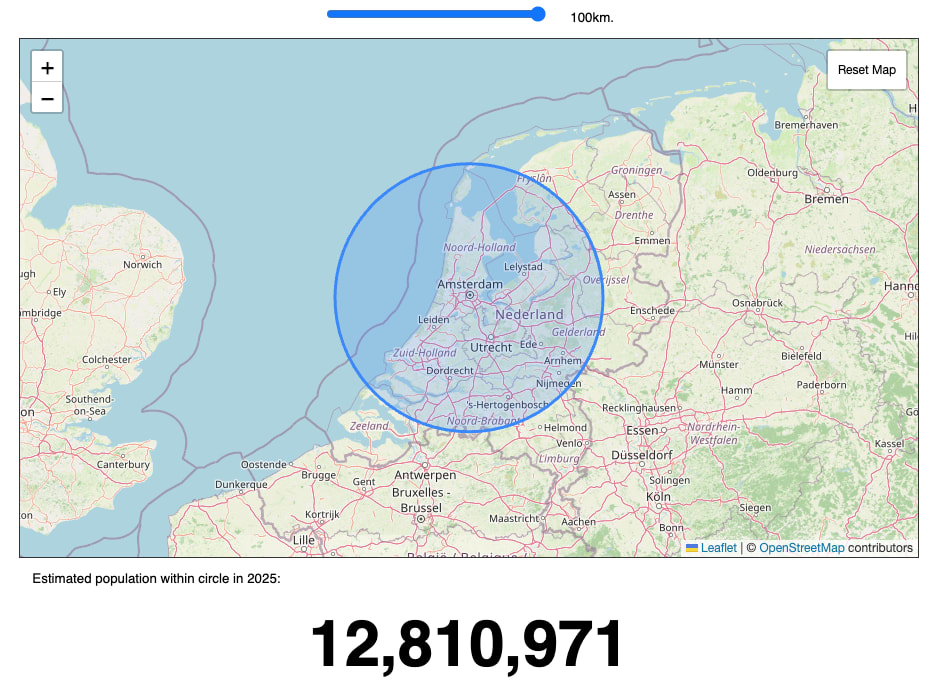
The Netherlands has hosted EA conferences since the late 2010s (before there was an EAGx programme). Most recently, we've had Rotterdam (2022), Utrecht (2024), and now Amsterdam (2025). Since rebuilding the event post-2022, we've improved on every metric: more attendees, better cost efficiency, stronger programming, and now a record-breaking pledge outcome. Survey data suggests the Netherlands has one of the largest national EA communities in the world (with Amsterdam being the largest hub city outside the UK/US), it's centrally located in a densely populated area,[1] extremely well-connected internationally, and the results above suggest we know how to run these events well.
We don't yet have funding confirmed for a 2026 or a 2027 event, but we'd love to keep building on what's working. If you have thoughts on that — or if you're interested in getting involved as a speaker, volunteer, or sponsor — do reach out.
The full event report with detailed survey data and year-on-year comparisons is available on request. Thanks to Chiona, Kars, Ricardo and the marketing teams for making this event happen, to Jonathan Mannhart for the photography, and to our volunteers, speakers, and, of course, to the CEA events team for funding and supporting us.

Joris 🔸 @ 2026-04-03T09:51 (+11)
Such a nice write-up! Thanks James
I'm curious: what makes you attribute the application increase to marketing specifically? I think there's many other reasons one could brainstorm that could explain the increased attendance (Amsterdam vs Utrecht, general growth of the EA community, etc.). But maybe you e.g. asked people how they first heard about the event, and many more folks selected "Facebook ads"
James Herbert @ 2026-04-04T12:00 (+6)
Thanks Joris, and an excellent question. The honest answer is that I can't cleanly attribute the application increase to marketing. If I had to put a number on it, I'd estimate marketing contributed roughly 30–35% of the application increase — but this is genuinely uncertain, and I'd put the range at somewhere between 20% and 50%. Here's the reasoning and the data behind that.
What we did differently this year
The standard promotional activities — Forum posts, reaching out to group organisers across the region and asking them to share the event — were roughly the same as previous years. We also ran paid ads in both years, but the 2025 campaign was substantially different in quality and targeting.
In 2024, the ad campaign was set up by a very capable student who threw herself into it but had no prior experience with paid advertising. She ran campaigns on both LinkedIn and Meta. In 2025, we hired a professional agencies to run the Meta campaign on Instagram and support us with organic content on LinkedIn and Instagram.
Here's how the paid campaigns compare. In 2024, we spent ~€2,640 and generated 454,904 impressions and 4,162 clicks (CPM of €5.80, CPC of €0.63). In 2025, we spent ~€3,200 and generated 257,698 impressions and 6,442 clicks (CPM of €12.41, CPC of €0.50). CPM is cost per 1,000 impressions; CPC is cost per click.
So the 2025 campaign was more expensive per impression but cheaper per click — it reached fewer people but got more of them to engage. And the critical difference was what happened after the click: in 2024, there was no lead capture mechanism, just link clicks. In 2025, 709 leads were captured via instant forms and entered an automated email follow-up sequence.
I asked Claude to compare the 2025 campaign stats against industry benchmarks, and the results suggest the agency did a good job. Our CPC of €0.50 is well below typical Instagram rates (industry averages run $1.83–$3.35). Our CTR of 2.62% is roughly 3–10x the Instagram norm of 0.22–0.88%. And our CPL of €4.07 is a fraction of the average Facebook lead campaign CPL of ~$28. The one caveat is that instant forms with pre-filled data make conversion very easy, which flatters these numbers — the real question is always what those leads are worth further down the funnel.
On top of the paid campaign, we invested significantly more time in organic LinkedIn content with support from the agency. My personal profile generated 103k impressions over the campaign period (March–December), reaching 25,129 unique members, up 814% on the prior period. The EAN company page added another 26k impressions, with a clear ramp from ~500/month early on to 7,100 in November, dropping back to ~700/month after the event. We also distributed posters across university campuses in the Netherlands.
A caveat on the LinkedIn figures: the organic content also included campaigns for our intro course (which saw a 140% increase in completions YoY), so those numbers overstate the EAGx-specific reach. I can't easily disaggregate the two.
The mechanics of the Meta campaign
We ran Instagram ads using Meta's instant form format. Someone scrolling their feed sees an ad, taps it, and a form pops up within the app pre-filled with their name and email — they can submit with essentially one tap. Those emails then synced to a Mailchimp automation that sent two follow-up emails linking to the application page.
The funnel looked like this: ~50,000 people reached → 6,000 clicks → 709 instant form leads → 612 entered the email automation → ~30–40 click-throughs to the application page. We generated those 709 leads at €4.07 each.
We originally wanted to run a website conversion campaign, which would have let us track the full journey from ad to application. The EA Global website (where applications happen) doesn't support a tracking pixel, so we built our own landing page — but then we messed up the pixel there as well. So we fell back to the instant forms, which gave us reliable lead data but broke the chain between ad exposure and actual applications.
What the feedback survey says
The post-event survey asked attendees how they heard about EAGxAmsterdam. Only ~2% of respondents credited Instagram ads and ~3% credited LinkedIn. On the surface, this looks like marketing had no effect.
But I'd be cautious about taking that at face value. Only 98 out of 159 respondents answered the channel question. It's plausible that attendees who came via ads — likely newer to EA and less engaged — were less likely to fill in a post-event survey, meaning they'd be systematically underrepresented.
There's also a basic attribution problem. Someone sees an Instagram ad, doesn't click, then hears about the event from a friend a week later and applies. They'd truthfully answer "through a friend" on the survey, even though the ad planted the seed. Self-reported attribution tends to undercredit awareness channels and overcredit the last touchpoint.
How I get to the estimate
Taking all of the above together: we received 906 applications in 2025 versus 570 in 2024, an increase of 336 (59%). Attendance grew from 381 to 517 (36%).
One way to get at the question is to compare against the broader trend. CEA's recent post reports that overall EAGx attendance grew 20% in 2025 (2,866 → 3,238). Amsterdam's 36% attendance growth significantly outperformed this. And there are reasons to think the baseline is even lower than 20%: that figure partly reflects expanding from fewer to 10 events globally (including new ones in Nigeria and São Paulo), so the per-event growth rate may be close to flat. There were also factors working against us: EAGxBerlin was close to us on the calendar (competing for the same regional audience), and EA Connect — CEA's largest ever virtual event — ran around the same time, potentially satisfying people's appetite for EA events without needing to apply to an in-person conference. In 2024, EAGxUtrecht was in the summer, further from other events.
So Amsterdam significantly outperformed a baseline that was probably close to flat, despite calendar headwinds. The main local factors that could explain the outperformance are: Amsterdam being more well-known than Utrecht, and our marketing investment.
Of those 336 additional applications, how many did marketing drive? 709 people submitted an instant form after seeing an ad. But the gap between tapping a pre-filled form on Instagram and actually paying ~€120 and filling out a substantive application is wide. For a paid event with a non-trivial application process, a lead-to-application conversion rate of 5–15% seems realistic — that gives roughly 35–105 applications from Meta ads. LinkedIn and the poster campaign are harder to quantify: LinkedIn works as an awareness channel that primes people to respond when they encounter the event elsewhere, and posters are essentially untrackable. Together they probably contributed a few dozen applications at most that would show up in the data as "EA Global website" or "through a friend."
Setting those against the 336 additional applications, and accounting for the confounders above, I'd estimate marketing explains somewhere in the range of 20–50% of the growth, with 30–35% as my central estimate. The range is wide mostly because the lead-to-application conversion rate is doing all the heavy lifting and I have no data to pin it down. I hold this loosely.
What would actually help us figure this out
The biggest gap is that we can't connect our leads to actual applications. Fixing the tracking pixel or matching our 709 lead emails against the applicant list would give us a hard floor on ad-driven applications. It'd be great if the EA Global team could find a solution for this.
The other thing that would help is knowing whether Amsterdam outperformed or tracked with the broader trend. @Arthur Malone🔸 / @Kiryl Shantyka / @Niki Kesseler — would you be able to share application trends across EAGx conferences over the past couple of years? The overall EAGx attendance figure includes new events, so a per-event comparison would give a cleaner baseline. If Amsterdam's growth was in line with returning events, that points to ecosystem-level factors. If it significantly outperformed, that helps isolate the local effect.
NickLaing @ 2026-04-02T16:37 (+3)
Great analysis love the simple language. I'm super impressed by the payback on marketing. 50 percent first timers is amazing!
@MichaelPlant the EA celeb love it. I wonder if he'll accept that label?
James Herbert @ 2026-04-02T17:18 (+2)
Thank you, Nick! Means a lot to get a forum compliment from a power user like yourself :)
Vasco Grilo🔸 @ 2026-04-08T17:36 (+2)
Hi James.
- NPS of 63 (mean recommendation: 8.86/10).
In case anyone is wondering, NPS stands for net promoter score, and is equal "fraction of people giving a score of 9 or 10 (promoters)" - "fraction of people giving a score of 0 to 6 (detractors)".
James Herbert @ 2026-04-10T11:15 (+4)
Thanks Vasco!
I think it isn’t used much by EA event organisers because it probably doesn’t really measure precisely what it claims to measure. However, I do think it’s nonetheless a reasonable measure of overall quality, and because it’s widely used outside the EA bubble, you can more easily use it to benchmark (compared to likelihood to recommend scores).
Vasco Grilo🔸 @ 2026-04-10T12:33 (+2)
It also seems something worth tracking to me.
Jacob Eliosoff @ 2026-04-11T21:16 (+1)
Do you see any risk that the marketing increased the number of applicants, but also on average lowered their level of interest or how much they had to contribute? I've had some experiences like that before when promoting events very widely. (Though I've also had the opposite experience, where casting a wide net brings in amazing people you'd never have reached otherwise.)
I'm sure it depends on the type of marketing used, and in general I agree marketing is an important tool in the toolkit!
James Herbert @ 2026-04-14T10:49 (+2)
Yup, that's a risk! I think you can mitigate it by learning how to do marketing well, but that's easier said than done!
Jmd @ 2026-04-02T17:08 (+1)
But what great photos!!!
So glad Jan had some bear cuddles for support, Swapcard is draining!