Giving Green Launches New Biodiversity Research and Top Biodiversity Nonprofits
By Soemano Zeijlmans, Giving Green @ 2026-02-25T11:31 (+19)
Summary
- As a consulting project for a donor, Giving Green has identified opportunities where philanthropic funds can make an outsized impact on reducing global biodiversity loss.
- The biodiversity financing gap highlights the importance of spending limited philanthropic funds to achieve outstanding impacts.
- On land and in freshwater ecosystems, we recommend that donors support alternative proteins and wetland protection.
- For marine biodiversity, we recommend that donors support bycatch mitigation and innovation for alternatives to fish meal and fish oil.
- We recommend that donors who are primarily interested in reducing biodiversity loss follow our recommendations for reducing land use change and overfishing. However, donors who care about both biodiversity and climate change could consider donating to the Giving Green Fund or directly supporting Top Climate Nonprofits.
Introduction
At Giving Green, we focus on directing funding toward highly effective climate mitigation strategies. Last year, however, a donor approached us with an opportunity to use our research methods to identify where limited philanthropic dollars could have an outsized impact on reducing global biodiversity loss.
We’re thrilled to finally share our learnings from this consulting project in our new strategy report on Reducing Biodiversity Loss. As a result of our research, the donor who backed this project donated a total of $1,830,000 USD to the high-impact biodiversity nonprofits we identified.
We’re grateful that the donor agreed to make this research public to help guide other donors and grantmakers in the biodiversity space towards high-impact solutions and nonprofits.
Before we go further, we want to make it clear that addressing climate change remains at the heart and soul of Giving Green’s mission. Our research into high-impact climate giving strategies and Top Climate Nonprofits remains our priority, and 100% of donations to the Giving Green Fund will continue to fund climate solutions.
For now, this biodiversity research is purely educational and advisory in nature. One day, if we receive enough interest and demand, we may consider starting a separate biodiversity fund informed by this workstream.
Why we identify biodiversity priorities
Healthy ecosystems are important for humanity’s flourishing, as nature is responsible for valuable ecosystem services such as pollination, carbon storage, food, climate regulation, and flood prevention. Regardless, the extent and condition of natural ecosystems have declined by 47% since their earliest estimated states, and so have indicators for 23 out of 27 ecosystem services.[1]
The financing gap to reach globally agreed biodiversity targets is immense at more than $700 billion USD per year. Philanthropy—which is only a small part of all biodiversity financing—only comes in at roughly $2 billion per year. This implies that we’re unlikely to solve biodiversity by simply donating more: we need to think strategically about how we can allocate our limited biodiversity-earmarked resources to have maximum impact.[2]
As previously argued on this forum by David Goodman, even if we don’t meet the biodiversity financing gap, total biodiversity funding is a non-trivial amount. If we can (re)direct only a part of that funding towards high-impact solutions we could make considerable progress on this issue.
The goal of our report is to help prioritize funds that are earmarked for biodiversity conservation. We’re not making any claims around how biodiversity conservation relates to climate change or other cause areas in terms of importance, tractability, and neglectedness.
How we approached prioritizing levers to address biodiversity loss
Biodiversity is an inherently multidimensional issue that can’t be quantified well. When we evaluate climate change mitigation strategies and nonprofits, we can usually use greenhouse gas emissions as a reasonably good proxy to compare the scale of different strategies. Unfortunately, there are no straightforward “units of biodiversity” that allow us to compare the scale or importance of biodiversity interventions.
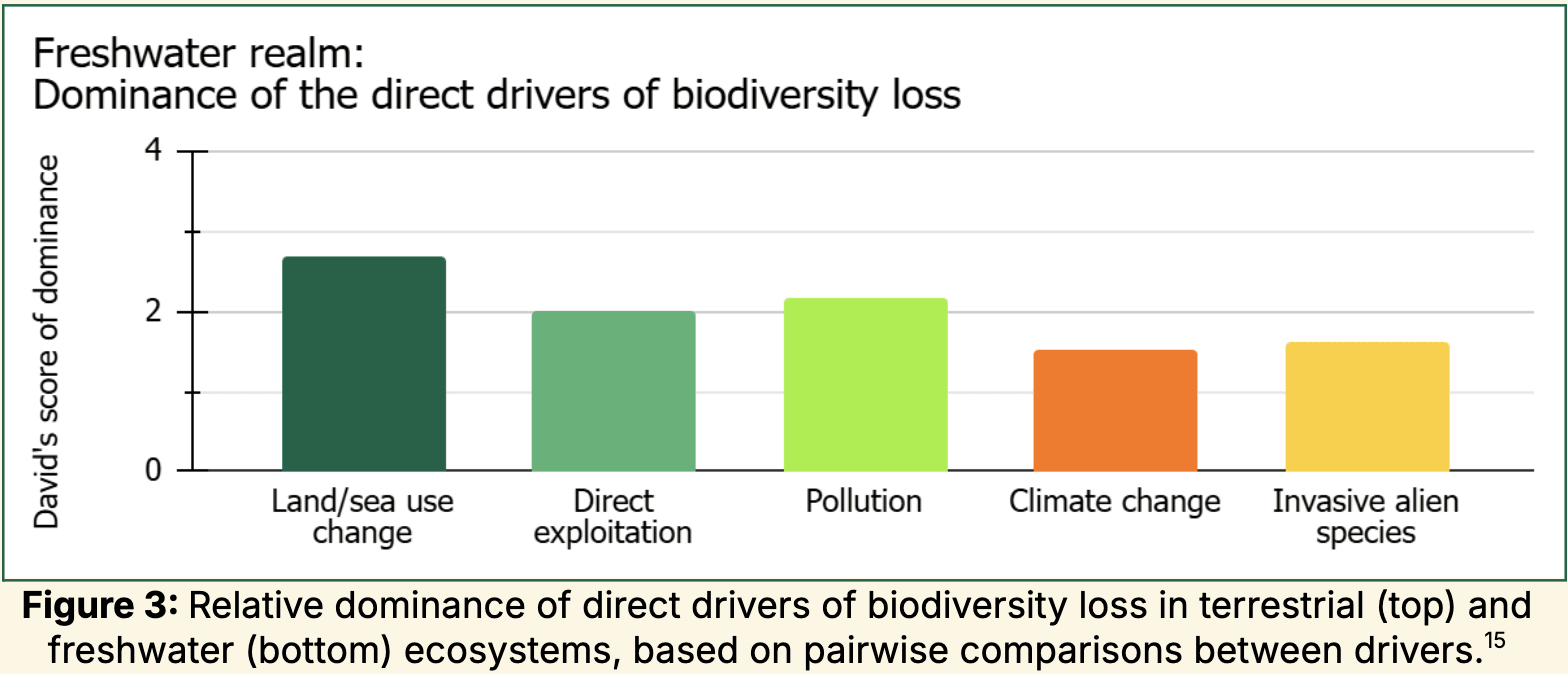
To overcome this issue, we first subdivided biodiversity into multiple realms (terrestrial, marine, and freshwater) and the “direct drivers” of biodiversity loss. The “direct drivers” are land/sea use change (e.g., deforestation for agriculture), direct exploitation (e.g., hunting and fishing), pollution, climate change, and invasive species. Academic literature (notably Jaureguiberry et al., 2022) aggregated site-specific comparisons of these drivers to identify the most dominant drivers globally. We prioritized the drivers that rank highest on dominance.
Recommendations for biodiversity on land and in fresh water
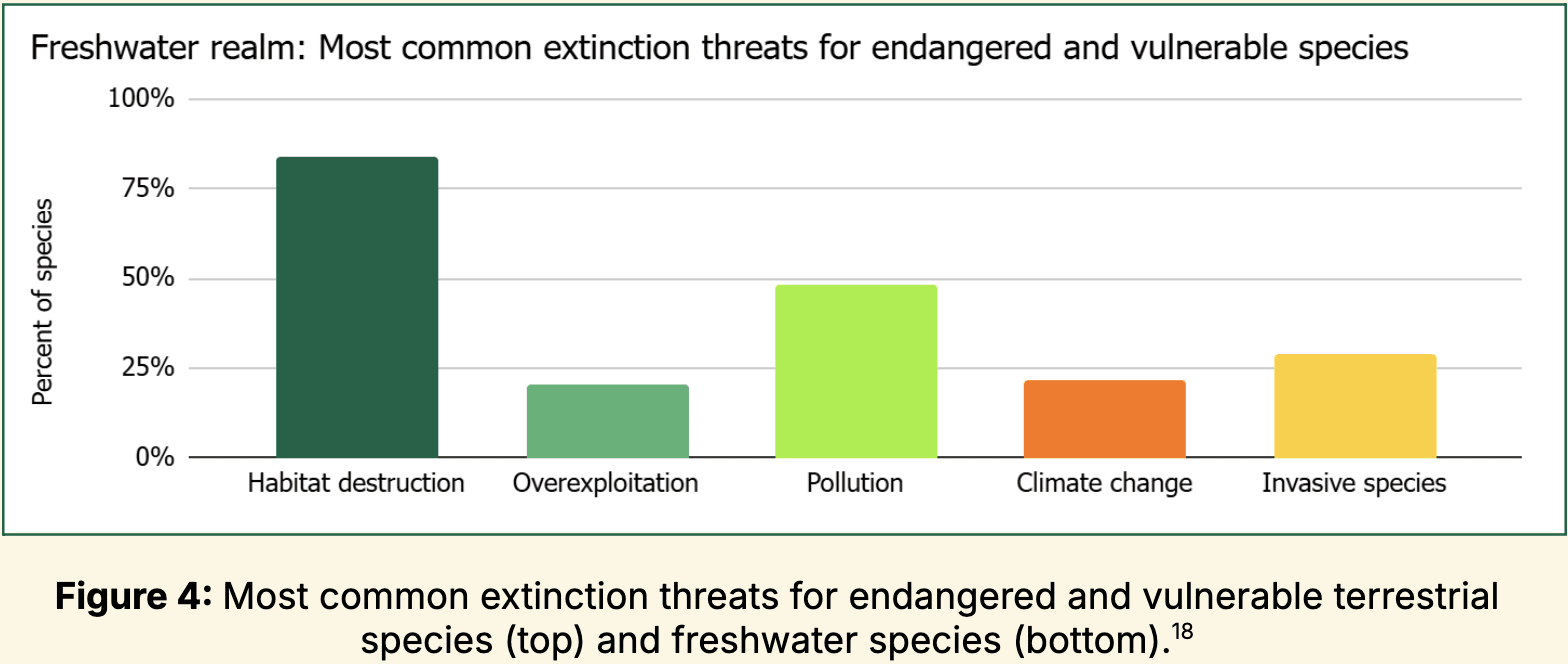
For biodiversity on land, we recommend donors to focus on reducing land use change from agricultural expansion. Land use change is the most dominant driver of terrestrial biodiversity loss.[3] Habitat destruction threatens 85% of endangered or vulnerable species that live on land, making it by far the most common threat to terrestrial species.[4] We expect future land use change to come from land-intensive agricultural products like animal proteins. For donors, the following impact strategies stand out as especially promising:
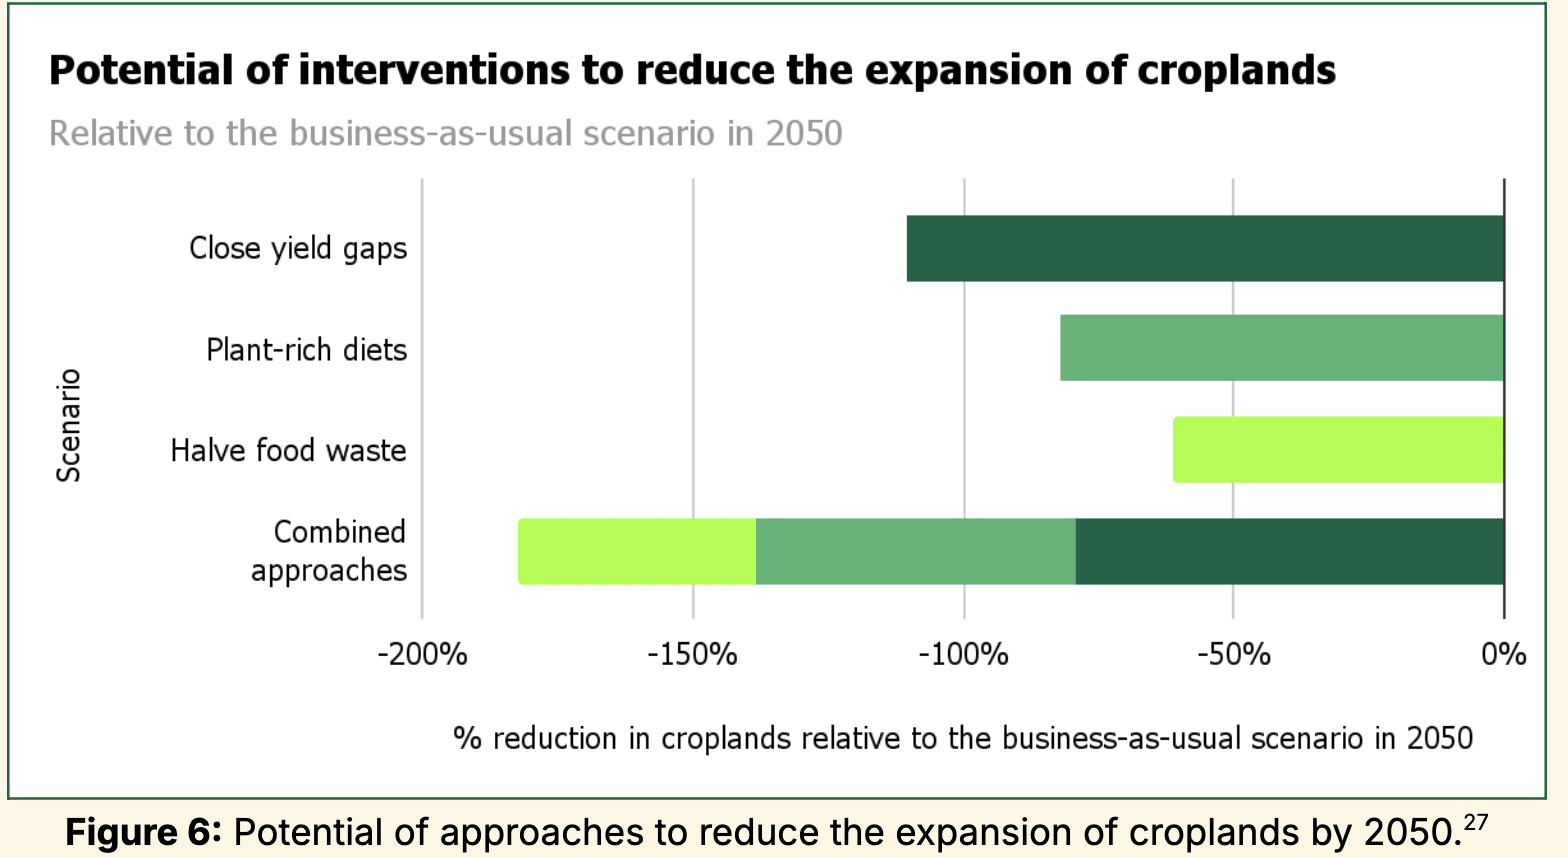
Advocating for alternative protein policy and research can make these products as tasty and cheap as conventional meat, which has the potential to reduce the expansion of croplands by 82% by 2050.[5]
Protecting sensitive and unique habitats at scale, such as wetlands, which, despite accounting for just 10% of the total global land surface, are where up to 40% of the world’s species live and breed. Protecting these ecosystems could help conserve the most valuable habitats from conversion in the short term until land-use pressures are solved.[6]
Recommendations for marine biodiversity
For marine biodiversity, we recommend that donors focus on reducing ecosystem damage from fishing. The fishing sector is the leading driver of marine biodiversity loss.[7] For donors, the following impact strategies stand out as especially promising:
- Developing and implementing improved fishing gear can help reduce bycatch, the unintended capture of non-target species such as dolphins or seabirds.
- Supporting innovation for alternatives to fish meal and fish oil (FMFO) can reduce the quantities of forage fish caught by up to 13% by reducing the need for wild-caught fish for aquaculture.
Our Top Biodiversity Nonprofits
In our research, we identified two Top Biodiversity Nonprofits that we’re really excited about. Both work on lowering biodiversity loss on land and in freshwater habitats.

The Good Food Institute (GFI) is a global nonprofit that seeks to make alternative proteins competitive with conventional proteins in terms of price and taste via science, policy, and industry workstreams. By lowering livestock production and the land it requires, GFI’s work to advance alternative proteins can help reduce future habitat loss.

Wetlands International is a global nonprofit organization working to safeguard and restore wetlands for their environmental value and ecosystem services. Wetlands International’s work to conserve and restore wetlands at scale is important for protecting the ecosystem services they provide and the species that depend on them.
Unfortunately, we didn’t identify top nonprofits working on addressing marine biodiversity loss, but we did work with our donor to make one-off grants to two initiatives that address marine biodiversity loss:
- The Centre for Feed Innovation, to support the development of alternatives to fish meal and fish oil
- The Bycatch Solutions Hub, to support pilot projects and the implementation of fishing gear that reduces bycatch.
How does climate change relate to biodiversity?
Climate change is the fourth leading driver of biodiversity on land and in freshwater ecosystems, and the second-largest in the oceans.[8] As the planet continues to warm, the damage done to ecosystems will rise exponentially along with global temperatures, making climate change a more dominant threat in the years to come.[9]
We recommend that donors who are primarily interested in reducing biodiversity loss follow our recommendations for reducing land use change and overfishing. However, donors who care about both biodiversity and climate change could consider donating to the Giving Green Fund or directly supporting Top Climate Nonprofits. In this context, alternative protein policy and research stands out as especially promising, since this strategy addresses both greenhouse gas emissions and habitat loss.
Read more
- Read the full strategy report on reducing biodiversity loss
- Read our nonprofit evaluation of The Good Food Institute
- Read our nonprofit evaluation of Wetlands International
- ^
- ^
- ^
Point estimate of the dominance of land use change in the terrestrial realm: 3.16/4.00 (95% confidence interval: 2.77–3.40, n=87 studies) (Jaureguiberry et al., 2022, Fig. 1B).
Dominance scores are built from published studies that directly compared at least two drivers of biodiversity loss. Each study was converted into weighted head-to-head matchups: the more important driver received 1 point, the less important driver 0, and ties 0.5. Weights reflected study scale (local to global) and under-represented indicators. These weighted results were summed and converted into normalized David’s scores, which range from 0 (always lowest ranked) to 4 (always highest ranked), with 2 expected if all five drivers were equally important. A score of 3.16 for land-use change in terrestrial ecosystems shows it consistently outranked other drivers. - ^
We retrieved data from the IUCN Red List of Threatened Species in October 2025 and filtered for species that are critically endangered (CR), endangered (EN), or vulnerable (VU) and live—at least partially—on land (n=41444 species). We then grouped IUCN’s categorization of threats to these species into the five groups included in the diagram in line with the method by Hogue and Breon (2022):
Habitat destruction: Threat codes 1-3, 6-7, 4.1-4.3, 5.3.3-5.3.5.
Overexploitation: Threat codes starting with 5, except 5.3.3-5.3.5.
Pollution: Threat codes starting with 9.
Climate change: Threat codes starting with 11.
Invasive species: Threat codes starting with 8.
The sum of the percentages exceeds 100% because species may be affected by more than one extinction threat. - ^
Data from Williams et al., 2020 with processing by Our World in Data and Giving Green. The combined effect of the strategies is less than their sum because of interaction effects. Values below -100% represent a decrease in cropland area in 2050 relative to 2020. The ‘close yield gaps’ line represents increasing yields to 80% of the maximum sustainable yield. The ‘plant-rich diets’ scenario is the global implementation of the EAT Lancet diet.
- ^
Wetland cover percentage: We took the area estimates of (semi-)terrestrial and (semi-)freshwater wetland categories from the Global Wetland Outlook, 2025, Table 1: estuarine waters, salt marshes, mangroves, tidal flats, lakes, rivers and streams, inland marshes and swamps, and peatlands. This amounts to 14 million km2 of wetlands. We divided this by the total surface of Earth’s land (141 million km2). 14 Mkm2 / 141 Mkm2 ≈ 10%.
Species percentage: “Up to 40% of the world’s species live and breed in wetlands” UN Climate Change News, 2018 - ^
Point estimate of the dominance of direct exploitation in the marine realm: 2.82/4.00 (95% confidence interval: 2.61-3.14, n=58 studies). We explain dominance scores in more detail in the chapter on land use change. Climate change is the next most dominant driver with a dominance score of 2.51/4.00 (95% confidence interval: 1.82-2.75). Direct exploitation was not significantly (p>0.05) dominant over climate change. Jaureguiberry et al., 2022, Fig. 1B
- ^
Point estimate of the dominance of climate change across all three realms: 1.53/4.00 (95% confidence interval: 1.11-2.01, n=154 studies).
Point estimate of the dominance of climate change in the marine realm: 2.51/4.00 (95% confidence interval: 1.82-2.75, n=58 studies).
We explain dominance scores in more detail in the chapter on land use change. Jaureguiberry et al., 2022, Fig. 1B - ^
“The relationship between global temperature rise and species extinction rates is best described by a quadratic biosphere damage function, indicating that the rate of biodiversity loss accelerates as temperatures increase.” Thor, 2024
“Results suggest that extinction risks will accelerate with future global temperatures, threatening up to one in six species under current policies.” Urban, 2015
Vasco Grilo🔸 @ 2026-03-05T09:32 (+9)
Hi Soem.
What exactly do you mean by "reducing global biodiversity loss"? Decreasing the number of species going extinct? If so, are you overwhelmingly focussing on invertebrates and plants, which account for the vast majority of species?
Have you considered incorporating some considerations related to increasing welfare in your research on reducing biodiversity loss?
Mo Putera @ 2026-03-06T13:18 (+11)
Giving Green are welcome to correct me on this (I'm invoking Cunningham's law here) -- the impression I got from their strategy report is "this isn't that straightforward to answer"
- while they don't explicitly define biodiversity loss, let alone use a single quantitative metric like you guessed, they do reference IUCN Red List-based "percent of species threatened with extinction" and David's dominance scores to justify their analytical focus on land use change as the most dominant biodiversity loss driver
- the metrics they looked at for their "problem scale" heuristic for assessing philanthropic strategies are varied:
For land use change, we looked at the surface area of land conversion avoided as a heuristic for scale, while weighing this against the importance of different biomes in terms of ecosystem services. For overfishing, we used heuristics such as the harmfulness and extent of fishing practices and the percentage of fish caught.
- they pragmatically proxied loss reduction by focusing on loss drivers instead, which are the subject of most of the report, as that's where comparative data is available:
Because biodiversity is an inherently multi-dimensional and non-fungible good,
comparing specific impact strategies in terms of scale is methodologically challenging.
For this reason, we prioritized among the five direct drivers of biodiversity loss, for which
quantitative comparisons in scale exist.
- the loss driver indicator they picked, ecosystem services, is focused on the benefits humans derive from ecosystems so my guess to your 2nd question is "probably not", but they did guardrail against strategies potentially harmful to animals, cf. these 2 guiding principles (out of 8 total) they used to identify promising funding opportunities:
Ecosystem services: While there are many indicators for biodiversity, we decided
to focus on ecosystem services as the biodiversity indicator to prioritize. Since
ecosystem services describe the benefits that humans derive from ecosystems,
this definition is closest to Giving Greenʼs mission to maximize human and
ecological well-being. In practice, there are often no concrete quantitative
indicators of ecosystem services for the strategies that we evaluate, so we often
rely on heuristics from other indicators.Co-benefits for humans and animals: In principle, co-benefits for human health,
development, and animal welfare were not part of our prioritization, but we took
care to not recommend strategies that may cause harm.
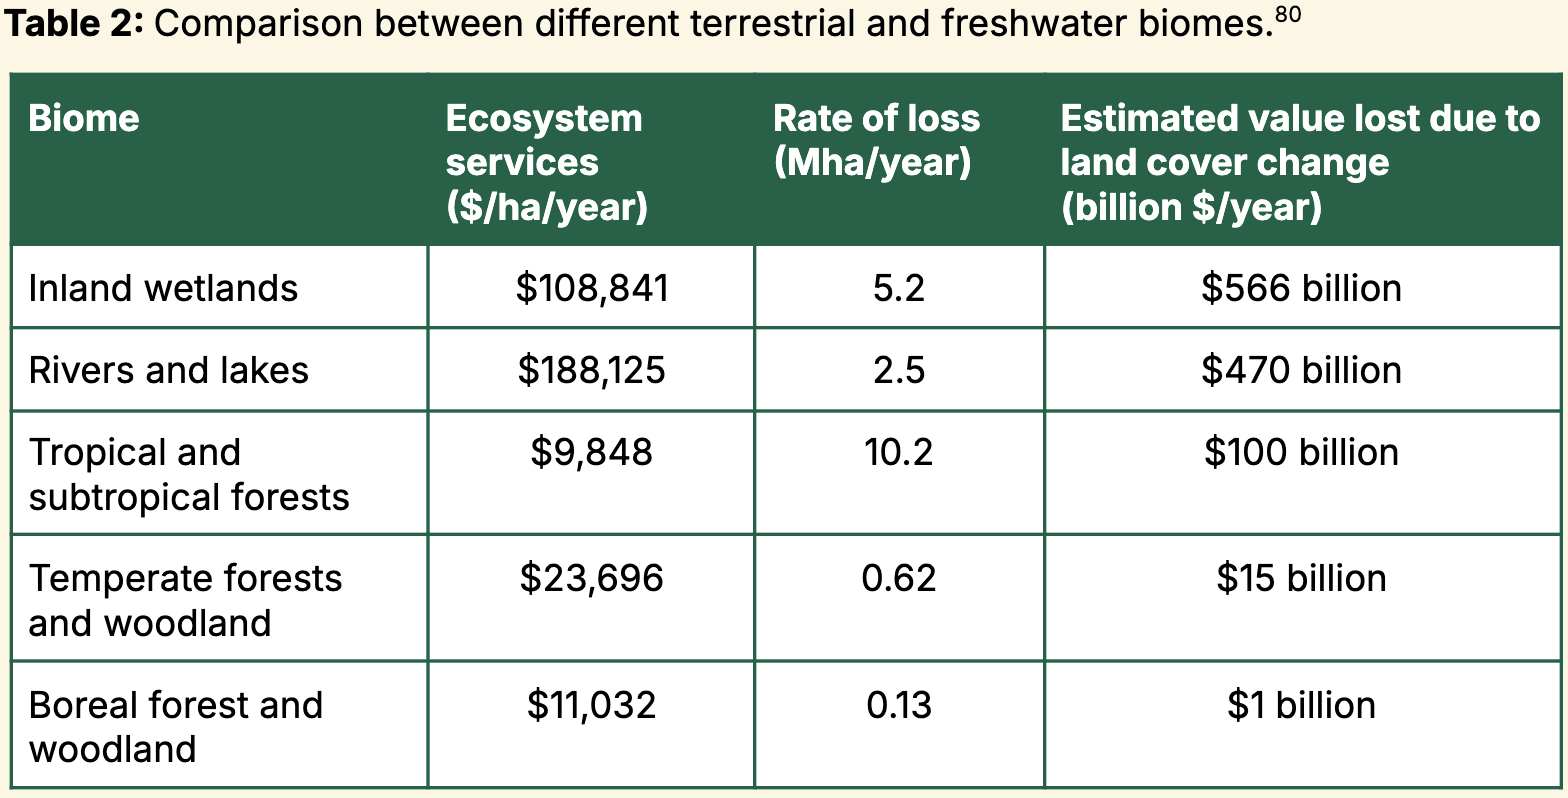
- They referenced the Ecosystem Services Valuation Database for the data above, which yields tables like this, caveating that these estimates "are compiled across multiple studies which differ in methods and scope, and therefore should only be seen as a rough indication of the monetary value of different biomes rather than an exact comparison"
Why not just pick number of species going extinct? My guess is the argument across these scattered quotes from Founders Pledge's guide to ecosystem philanthropy, cited in GG's report:
... while biodiversity is a useful measure of an ecosystem’s organizational and structural health, it should not be used as the sole objective to maximize for philanthropists who are interested in the protection of ecosystems more broadly. Intuitively one might argue that conservation should maximize the world’s biodiversity as the abundance and diversity of species are worth protecting. However, using biodiversity as its own metric runs into various issues (see Brennan and Lo 2022 for a further overview). ...
Biodiversity vs wilderness
The focus of protecting and restoring ecosystems is to preserve the natural state of an ecosystem before human interference. This focus on wilderness (or naturalness) often comes in conflict with pure biodiversity maximization. For example, in arid ecosystems, human use can bring about higher biodiversity: a farm built in a desert landscape will provide more habitat for species than the original ecosystem did. Similarly, Brennan (1988) describes temperate forests in which limited land clearing increases the diversity of tree species. A response to this critique might be that, at least among conservation projects, one should choose those that most guard against biodiversity loss. However, even in this limited case, biodiversity is just one consideration among many. Many areas that are regarded as important to conserve, such as many US national parks, are generally lower in biodiversity and instead prized because they are deemed aesthetic or sublime (Sarkar 2005). As such, a primary focus on biodiversity would likely rule out many ecosystems widely deemed important to conserve and could even suggest actions that would go against the preservation of natural ecosystems. Rather, biodiversity should be one consideration among many.
Biodiversity vs Ecosystem Vigor & Services
Many of the most productive ecosystems are not very species-rich. Similarly, the ecosystems that provide the most services for humans are on average lower in biodiversity (such as salt marshes for water filtration). As such, a focus on biodiversity alone might lead to prioritizing ecosystems that are high in different species but are not vibrant in the sense that they contain relatively few ecological processes or provide few services for humans (Brennan and Lo 2022). Biodiversity is therefore best understood as an element of ecosystem health rather than its own metric based on which to prioritize. ...
Heuristics for prioritization
There are various metrics in the conservation field that one might use as heuristics for prioritizing. Biodiversity, the abundance and diversity of species, for example, has intuitive appeal. However, as described above, it often runs counter to other considerations such as wilderness/naturalness and the functioning of ecosystems. Another metric, ecosystem health, provides a more holistic framework to measure the ecological integrity of ecosystems. Prominent models focus on the organization and functional structures of ecosystems and their resilience. As such, they capture a more complete range of ecosystem integrity, and align more closely with the popular notion of “protecting vibrant ecosystems”. Philanthropists should focus on interventions that look at ecosystems holistically, aiming to preserve their structure, functioning, and resilience as opposed to focussing on singular metrics such as biodiversity maximization.
also re: your 2nd question, FP's guide also has a short section on how they're "uncertain about any particular prioritization (of ecosystem protection based on reducing animal suffering) at this point", due to population ethics dilemmas and uncertainty over whether wild animal lives "are on net lives of suffering", and I'm guessing GG's report implicitly adopts this stance.
Vasco Grilo🔸 @ 2026-03-06T16:31 (+2)
Thanks for the detailed clarification, Mo.
Giving Green @ 2026-03-04T22:44 (+1)
For those who are interested in learning more, we are hosting a webinar on March 17 to dive deeper into our biodiversity research and recommendations.
Our lead biodiversity researcher Soemano Zeijlmans will walk you through our findings, breaking down the disconnect between where ecological risks are greatest and where capital currently flows.
You'll also hear from our Top Biodiversity Nonprofits and industry experts about high-leverage, systems-level interventions that address the root causes of habitat and species loss.
Sign up here: https://us06web.zoom.us/webinar/register/4217726626627/WN_9JpIGFjQSwG6Wy45At6oOw#/registration