Project Proposal Looking for Feedback: Making Policy Impacts Transparent — A Reasoning Model for Trade, Jobs, and Prices
By Echo Huang @ 2025-05-07T17:14 (+17)
Call for Collaboration and Feedback
This project is still in its early stages, and its strength will depend not just on its technical design—but on the relevance and clarity it brings to real-world users.
I am actively seeking feedback, critique, and collaboration from:
Policy professionals, think tanks and researchers, Trade experts and business analysts, International economic observers, technical experts, and generalist users.
You are more than welcome to reach out to me: echohuang42@gmail.com
What is the problem I am trying to solve?
When a new economic policy is proposed—like raising tariffs, introducing subsidies, or increasing minimum wages—it’s often unclear what the real-world effects will be. This lack of clarity leads to unproductive debate, weak policy design, and public mistrust. Two fundamental challenges contribute to this problem:
- The economic system is too complex for any one person or tool to grasp fully. Information is scattered across academic papers, policy reports, industry analyses, and economic datasets. No single person or existing platform can hold and synthesize this fragmented knowledge in a transparent, connected way.
- It’s difficult to trace cause and effect. A policy decision might influence prices, employment, supply chains, corporate strategies, consumer behavior, and more. These effects are often indirect, delayed, and interdependent—and most tools, even advanced ones, struggle to explain these ripple effects clearly and understandably.
This creates serious obstacles for decision-makers and the public:
- Communication breaks down. Experts, policymakers, and citizens often talk past each other because they rely on different assumptions, jargon, or fragments of the system.
- Traditional econometric models, while powerful for analyzing historical data, are difficult to understand for non-experts. Their results are often locked behind statistical tables or regression coefficients—informative for analysts, but opaque to the broader public.
- LLMs like ChatGPT may sound fluent, but they often hallucinate or gloss over the complexity of chain reactions in economic systems. This can mislead rather than clarify.
How This Project Offers a New Solution
This project proposes to build a domain-specific LLM system for economic reasoning and systemic simulation, powered by Retrieval-Augmented Generation (RAG). The system will allow users to input a policy (e.g., a new tariff), and receive a step-by-step causal reasoning output of likely outcomes across a mapped network of economic actors and relationships. Integrating structured knowledge and real-world data enhances reasoning accuracy and reduces hallucination, allowing users to simulate economic dynamics, compare outcomes, and better communicate complex policy impacts.
Unlike econometric models, which emphasize numerical estimation, this tool emphasizes causal reasoning and communication. When someone inputs a policy, the model will walk through its effects—who is impacted, how, and why—grounded in economic structure, historical cases, and stakeholder behavior. This doesn't just produce results; it provides a shared reasoning path that people can follow, critique, or build upon.
Rather than offering a “one true prediction,” the model supports structured economic dialogue:
- It makes competing assumptions visible.
- It reveals tradeoffs across sectors and actors.
- It helps people understand second-order effects—like how a subsidy might affect not just prices, but labor responses, supply bottlenecks, or foreign retaliation.
Why This Matters
By making economic reasoning more accessible, this tool empowers a broader set of stakeholders to participate meaningfully in policy discussions:
- Policymakers and researchers gain a structured way to simulate and communicate tradeoffs.
- Think tanks and advocates can generate reasoned, visual narratives for public and legislative outreach.
- The general public, often alienated by data-heavy reports, can now explore how decisions affect them—through narratives they can trace, challenge, and understand.
When the benefits and risks of a policy are made visible and intelligible, engagement becomes possible. Workers, small businesses, civic groups, and voters can advocate for themselves—not based on slogans, but on an understanding of the forces at play. That’s the real goal: not to automate decisions, but to deepen and democratize the reasoning behind them.
Product description
The system will be built around four connected modules, each designed to help the language model understand the real world, reason through complex situations, and communicate clearly:

Historical Context Database (Text-RAG)
This part of the system gathers relevant information from real-world documents—news reports, policy papers, economic history, etc. It gives the model a clearer sense of what is happening right now and what has happened before, so that its answers are grounded in actual context.
Economic Knowledge Graph
This module maps the economic system as a dynamic network of interconnected actors, relationships, and feedback loops. It is not based on any single economic theory, but instead on fundamental, structural logic—such as supply and demand dynamics, stakeholder incentives, pricing behavior, and time-based responses. The goal is not to impose a particular ideological model, but to construct a logic-driven, evidence-informed simulation space where users can explore how policies ripple through real-world systems.
The graph consists of nodes representing key economic entities, such as policies, industries, stakeholder groups, and products, and edges that describe how these entities influence one another. Each node and edge includes properties that add realism and nuance to the simulation. For example:
- Policies have properties like tariff rate or duration.
- Industries are defined by elasticities and exposure to trade shocks.
- Stakeholders (e.g., “U.S. Automakers,” “Labor Unions”) are modeled with their influence levels, reaction times, and policy positions.
- Products (e.g., steel, semiconductors) include unit prices, supply chain risk, and commodity classes.
Edges between nodes capture different types of relationships, such as:
- Causal links with signed directionality (positive/negative), strength, and delay.
- Feedback loops, marked as either reinforcing (amplifying effects) or balancing (stabilizing responses).
- Stakeholder impacts, capturing not only economic strength but also sentiment and political alignment.
This produces a multi-layered, multi-sectoral graph capable of modeling both direct and indirect effects of policy changes. By explicitly encoding a variety of sectors and interdependencies—rather than abstracting them away—this graph avoids the trap of narrow, theory-bound modeling. It can reflect complex realities like:
- How a tariff on steel impacts construction, automotives, labor unions, and downstream prices.
- How stakeholders might support or oppose policies based on strategic interests and alignment.
- How time delays and feedback dynamics generate second-order effects.
By treating the economy as a system of interacting parts rather than a fixed equilibrium, the knowledge graph helps the model simulate not just what might happen, but why, while leaving space for competing interpretations and refinements. It is designed to evolve: new nodes, edges, or relationships can be added as the model learns from additional data and feedback.
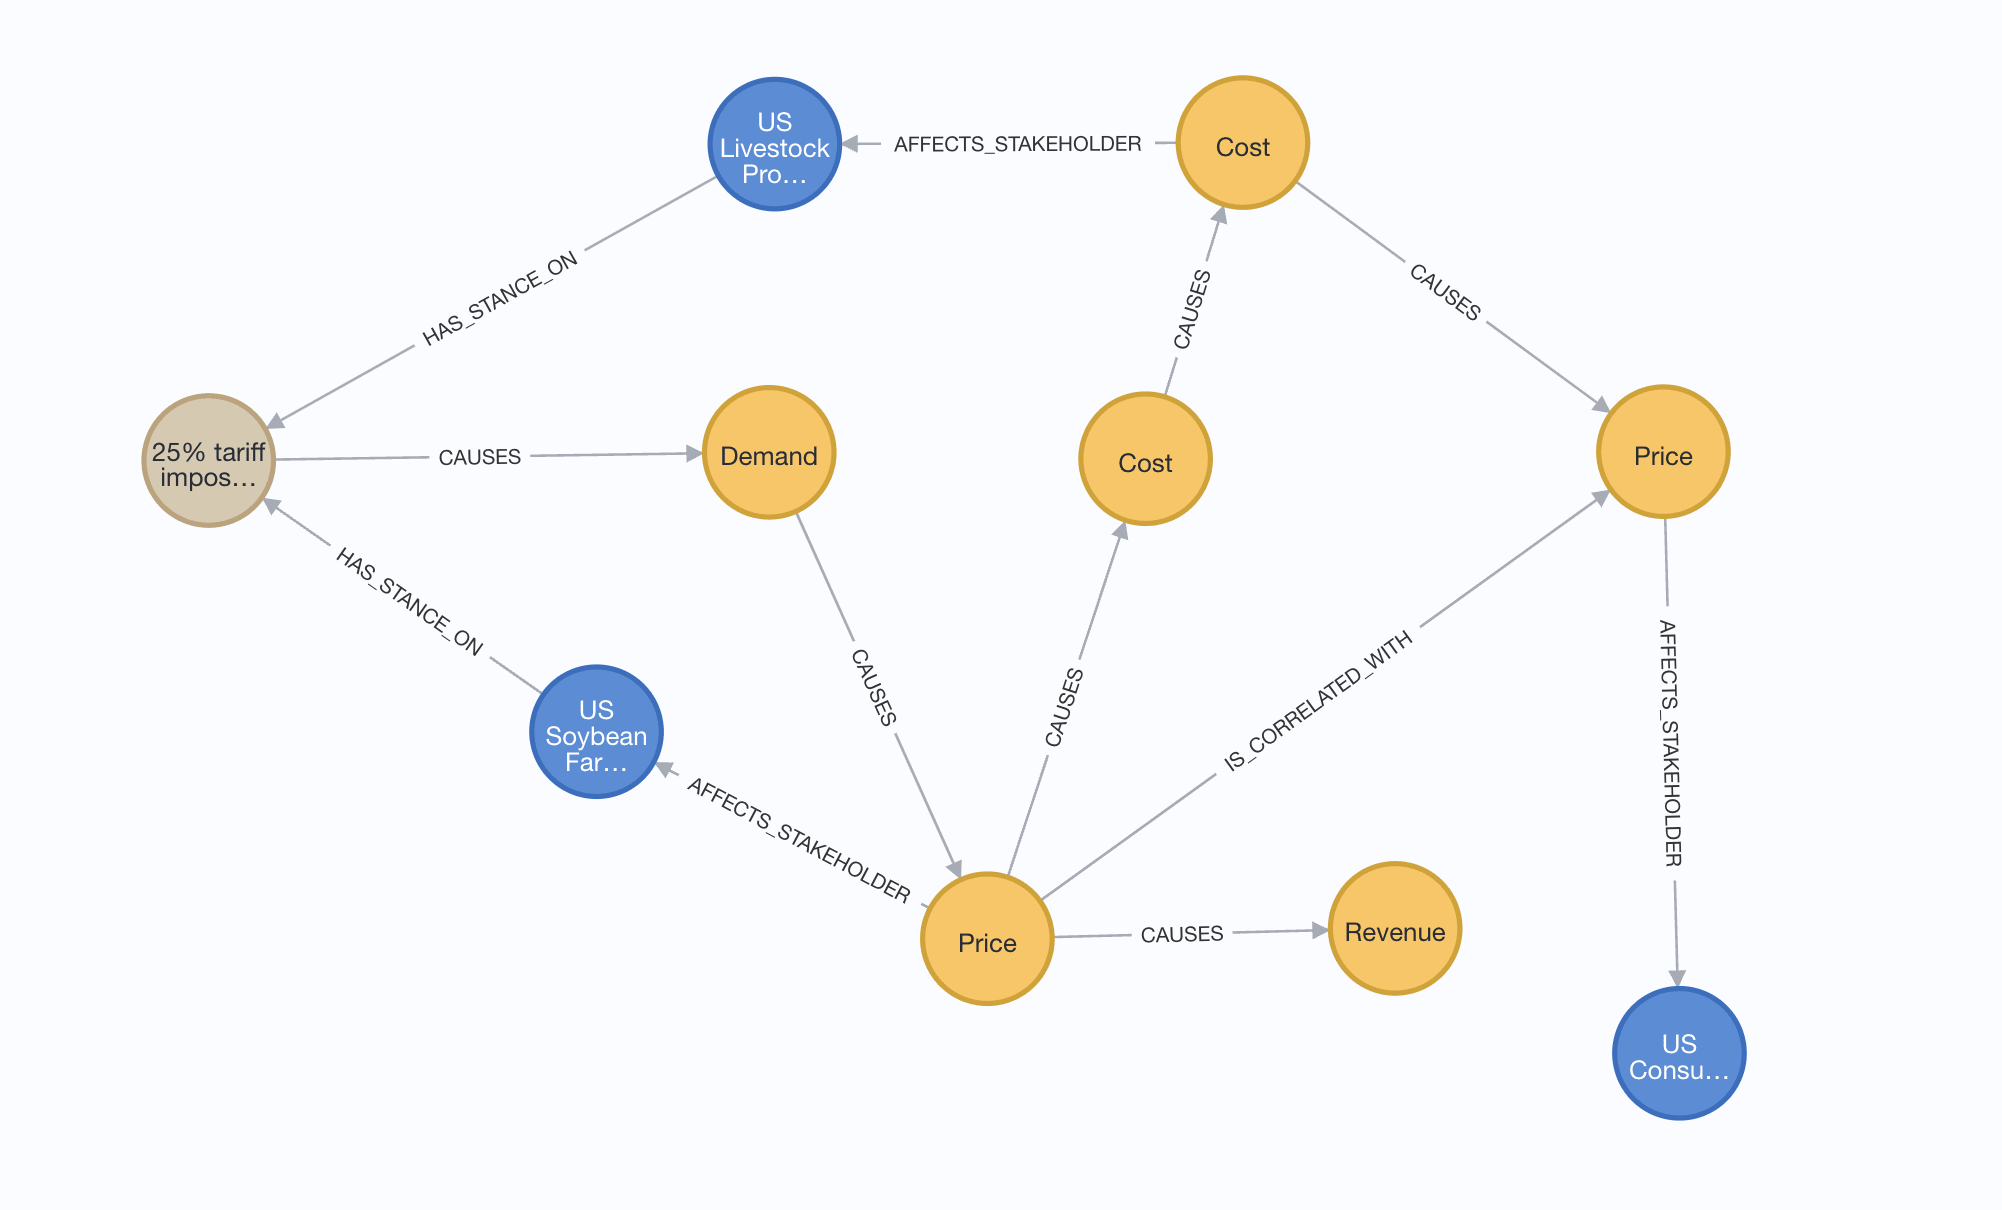
An simplified example graph created with Neo4j
- LLM Reasoning Engine This is the brain of the system: a language model that has been fine-tuned to think through economic problems step by step. Using the information from the databases and graph, it can explain not only what might happen, but also why. For example, if a new tax is introduced, it might show how that affects consumer spending, then how that changes production, and then how that affects jobs in specific regions.
Numerical Data Module (Prediction Layer)
After the reasoning is done, this module connects with real-world numbers—economic datasets and forecasting tools—so it can predict concrete outcomes. For instance, if the simulation shows a price increase, it might estimate:
“The average price of a dozen eggs could rise from $3.00 to $6.00, with regional differences of up to $1.00.”
This makes the reasoning more verifiable, transparent, and easier for users to relate to their everyday lives.
The final product will let users ask “what happens if…?” and get answers that are grounded in facts, reasoned through clearly, and tied to real-world numbers. It will also help people make sense of tradeoffs—for example, how job growth in one sector might come with higher prices in another.
Expect outcome and effectiveness
- Clearer, shared policy reasoning: This system is not designed to offer a single, definitive prediction of the future. Instead, it simulates likely outcomes by tracing how different economic actors—like firms, workers, consumers, and governments—might respond to a policy change. By modeling these reactions in a transparent, step-by-step way, it helps stakeholders reason from the same foundation. Even if they disagree on interpretations or assumptions, they can engage more constructively by referring to the same causal logic.
- Structured explanation over speculation: By combining Retrieval-Augmented Generation (RAG) with a dynamic economic knowledge graph, the model prioritizes clear, grounded reasoning. While traditional LLMs may hallucinate or jump to conclusions, this system builds its outputs by tracing causal chains and backing claims with historical context or theoretical grounding. Users can follow not just the conclusions, but the logic behind them.
- Exploring possible futures, not guaranteeing them: The system supports policy forecasting by surfacing multiple plausible scenarios and the assumptions they rest on. It aims to assist decision-makers in preparing for a range of outcomes, not by declaring what will happen, but by helping explore what could happen and why. As with all economic models, uncertainty and bias are unavoidable, especially where data is limited or theory is contested. The system makes this uncertainty explicit, offering ranges rather than single-point estimates and annotating assumptions behind each inference.
- Managing cognitive complexity: Economic systems are full of interdependent variables and feedback loops, which can be overwhelming to reason through manually. This tool helps reduce that cognitive load by breaking complex dynamics into understandable parts, showing how individual decisions propagate through the system. The goal is not simplification, but clarity: enabling users to grasp the structure of an argument even if the outcome is uncertain.
Existing research progress to build on
- RAG and Toolformer-style agents: The project builds on recent advancements in retrieval-augmented models, such as LlamaIndex and LangChain, which enhance the accuracy and reliability of AI systems by integrating real-time data retrieval.
- Economic-aware knowledge graphs: Drawing from work in graph neural networks and economic simulations, like Agent-Based Modeling (ABM), this tool will help model how different economic agents (like businesses, consumers, and governments) interact and influence each other.
- System dynamics and causal inference: The system is informed by system dynamics theories (e.g., Jay Forrester’s systems thinking), Leontief input-output models, and causal inference methods (such as those developed by Judea Pearl) to understand the feedback loops and complex causal relationships within economies.
- LLM failure analysis: The model also takes into account research on the limitations of large language models, including problems with hallucinations, shallow reasoning, and issues with context length that are common in current GPT-style models. By addressing these, the system aims to be more reliable and consistent.
Main Challenges
1. Constructing a Knowledge Graph That Balances Richness and Neutrality
The system’s reasoning relies on a large-scale economic knowledge graph composed of interconnected nodes (e.g., policies, industries, stakeholder groups, products) and edges (e.g., causal relationships, feedback loops). Designing this graph poses a dual challenge:
- It must be sufficiently comprehensive, including key sectors, multi-level feedback, and diverse actors—from labor unions to commodity markets.
- It must remain structurally unbiased, avoiding the trap of hard-coding a single economic ideology or oversimplifying contested dynamics.
Capturing economic complexity in a machine-readable form, without collapsing it into rigid theory, requires deliberate modeling choices and the ability to support multiple interpretations or scenario pathways.
2. Reconstructing Complex Historical Events as a Test of Causal Validity
A key benchmark for the model is whether it can meaningfully simulate the dynamics of known past policy events. Examples might include:
- The impact of U.S. steel tariffs in 2018,
- The cascading labor market effects of pandemic stimulus in 2020–2021,
- Or the inflationary ripple effects of energy price shocks.
Recreating these events requires integrating structured economic logic, historical documents, and behavioral insights into stakeholder actions. The goal is not to perfectly replicate outcomes, but to trace plausible, causally grounded chains of reasoning. Achieving this strengthens the model’s credibility and its utility as a tool for exploring future scenarios.
3. Ensuring Transparent Communication of Uncertainty and Assumptions
Perhaps the most difficult challenge is not technical, but epistemic: helping users engage with the model’s outputs responsibly. Economic reasoning is inherently uncertain and deeply dependent on assumptions. If users interpret the model’s simulations as authoritative forecasts rather than contingent scenarios, it risks misleading rather than informing.
This challenge includes:
- Clearly communicating which assumptions underlie each simulation path.
- Surfacing alternative viewpoints or counterfactuals within the system itself.
- Highlighting the range of possible outcomes, not just the most likely one.
- Designing the user interface to encourage exploration over acceptance, debate over deference.
The system must act not as an oracle, but as a facilitator of structured dialogue, especially among stakeholders without deep training in economics or statistics. This means building trust not by hiding complexity, but by making uncertainty intelligible and navigable.
Conclusion
T In a world where economic decisions shape lives and yet remain hard to follow, we need tools that don’t just predict, but explain. By combining causal reasoning, historical insight, and transparent simulation, this system aims to make economic policy more understandable, accessible, and debatable for everyone it affects. If we can make complex tradeoffs visible and shared, we can support better policy conversations—and better decisions.
I welcome your thoughts, collaboration, and critique.
Mo Putera @ 2025-05-08T05:05 (+5)
In case it's helpful, you may want to speak with Max Ghenis, cofounder & CEO of PolicyEngine, a tech nonprofit that computes the impacts of public policy, which your project proposal reminded me of. Here you can (quoting their calculator) "build a tax-benefit reform by selecting parameters from the menu (organised by government department)" and then "click Calculate economic impact to see how your reform would affect the economy, or Enter my household to see how it would affect a specific household". They use microsimulation models based on tax and benefit calculations applied to representative survey data to calculate impact and have used AI since 2023 for policy analysis / explanations / insights. They have an X account too where you can check out what they're about.
Echo Huang @ 2025-05-09T14:02 (+4)
Thank you for your recommendation! Really helpful!
mirembeddumba @ 2025-05-12T12:47 (+2)
This is one of the most thoughtful policy modeling proposals I’ve come across. As an Economics major, I’ve often been frustrated by how disconnected traditional models can feel from the realities people live through. Your statement that “the economic system is too complex for any one person or tool to grasp fully” really resonated with me. In many of my classes, we rely on simplified graphs or regression outputs, but those rarely capture how a single policy can ripple across industries, communities, and even generations.
The way you combine historical context, a knowledge graph, and numerical simulations is compelling. Instead of just presenting outcomes, your system helps users understand why those outcomes occur. That shift from output to reasoning could be transformative, especially for local decision-makers, students, or voters trying to make sense of policies like tariffs or subsidies. For example, a user could input a steel tariff and see how it might influence housing prices, union responses, or downstream manufacturing jobs, rather than just GDP or CPI changes.
I really appreciate your emphasis on “structured explanation over speculation.” In a time when policy debates often rely on soundbites or intuition, your approach invites people to slow down and think in systems. This could be a powerful educational tool and a bridge between economists and the broader public.
One thing I’m wondering is how the system will handle disagreement within economics. Take the minimum wage. Would the model be able to show multiple reasoning paths based on different schools of thought or labor assumptions?
Overall, this project feels incredibly timely and meaningful. I’d love to stay in the loop and contribute in any way I can, whether that’s offering feedback from a student lens, or exploring ways it could be used in economics classrooms.
SummaryBot @ 2025-05-08T19:35 (+1)
Executive summary: This exploratory proposal outlines a system that combines causal reasoning, economic knowledge graphs, and retrieval-augmented generation to help policymakers, analysts, and the public understand the ripple effects of economic policies—prioritizing transparent, structured explanations over predictive certainty—and invites feedback and collaboration to shape its development.
Key points:
- Problem diagnosis: Current tools for assessing economic policy impacts are fragmented, opaque, and inaccessible to non-experts, making it hard to trace causal effects and undermining public trust and policy design.
- Proposed solution: The author proposes a domain-specific LLM system that simulates the step-by-step effects of policy changes across interconnected economic actors using a dynamic knowledge graph and historical/contextual retrieval (RAG), emphasizing explanation rather than prediction.
- System architecture: The model integrates four modules—(1) a historical text database, (2) an economic knowledge graph, (3) a reasoning-focused LLM, and (4) a numerical prediction layer—designed to trace and visualize how policy affects sectors, stakeholders, and outcomes over time.
- Use cases and benefits: This system aims to support clearer communication among policymakers, researchers, and the public by making assumptions explicit, surfacing tradeoffs, and enabling structured, multi-perspective dialogue on economic consequences.
- Challenges and design considerations: Key hurdles include building a comprehensive yet ideologically neutral knowledge graph, simulating historical events for causal validation, and designing interfaces that clearly convey uncertainty and avoid false confidence in results.
- Call to action: The project is in an early stage and seeks input from policy experts, economists, and generalist users to refine the design and ensure it serves real-world needs.
This comment was auto-generated by the EA Forum Team. Feel free to point out issues with this summary by replying to the comment, and contact us if you have feedback.