Forecasting farmed animal numbers in 2033
By Hannah_🔸, Sagar K Shah, Rethink Priorities @ 2025-05-09T12:42 (+90)
Citation: McKay, H. and Shah, S. (2025). Forecasting farmed animal numbers in 2033. Rethink Priorities.
The report is also available on the Rethink Priorities website.
Executive summary
We produced rough-and-ready forecasts of the number of animals farmed in 2033 with the aim of helping advocates and funders with prioritization decisions. We focus on the most numerous groups of farmed animals: broiler chickens, finfishes, shrimps, and select insect species.
Our forecasts suggest almost 6 trillion of these animals could be slaughtered in 2033 (Figure 1).
Figure 1: Invertebrates could account for 95% of farmed animals slaughtered in 2033 according to our midpoint estimates. Note that ‘Insects’ only includes black soldier fly larvae and mealworms.
Our midpoint estimates point to a potential fourfold increase in the number of animals slaughtered from 2023 to 2033 and a doubling of the number of animals farmed at any time.
Invertebrates drive the majority of this growth, and could account for 95% of farmed animals slaughtered in 2033 (see Figure 1) and three quarters of those alive at any time in our mid-point projections.
We believe our forecasts point to an urgent need to address critical questions around the sentience and welfare of farmed invertebrates.
Our estimates come with many caveats and warnings. In particular:
- Species scope: For practicality, we produced numbers only for a few key animal groups: broiler chickens, finfishes, shrimp, and certain insects (black soldier flies and mealworms only).
- Sensitivity to insect farming growth: Our forecasts are particularly sensitive to the growth in insect farming, which is highly sensitive to the success of insect farming business models and their ability to attract future investment.
The recent and forecasted estimates, with 90% subjective credible intervals, can be viewed below in Table 1.
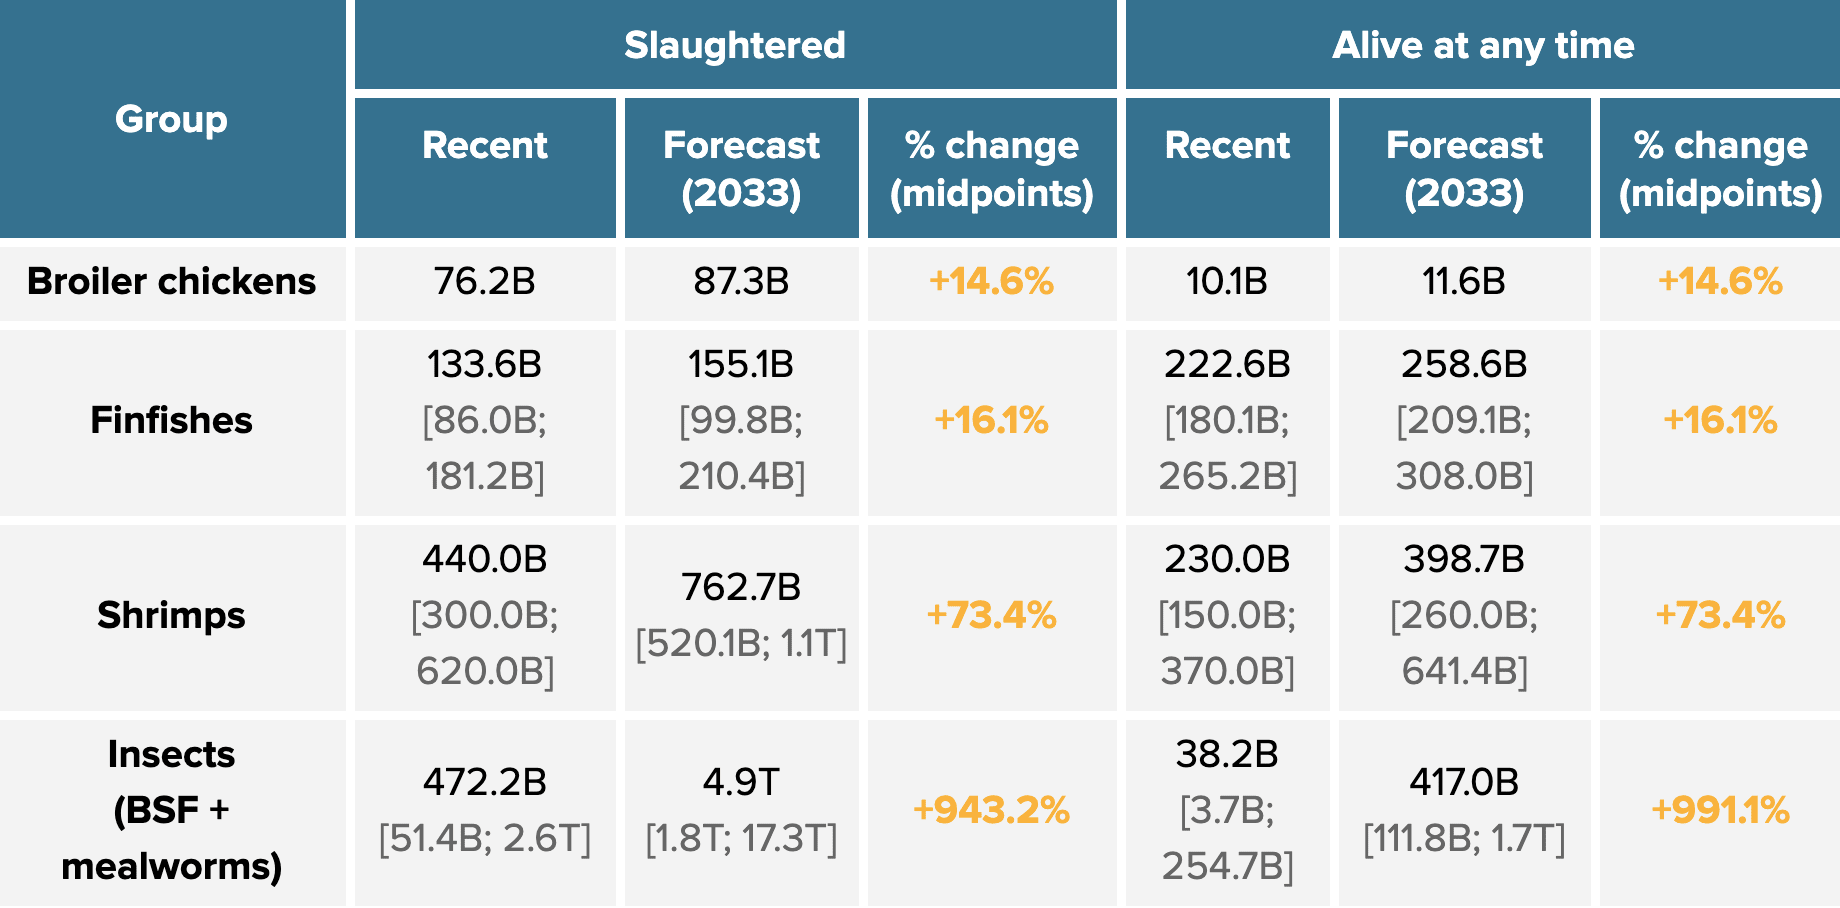
Table 1: Estimates of recent and forecasted numbers of broiler chickens, finfishes, shrimps, and insects slaughtered and alive at any time, with percentage change in the midpoint estimates.
Forecast year: 2033 for all groups
B = billion; T = trillion
Square brackets show 90% credible intervals
Introduction
Hundreds of billions of animals are raised on farms every year. This number has been steadily increasing since the 1960s (see e.g., Ritchie et al., 2023). However, figures like these have often excluded invertebrates and aquatic animals. When they are included, estimates suggest farmed shrimps currently dominate the picture, with 230 billion alive on farms at any time (Waldhorn & Autric, 2023). With billions of dollars being invested into scaling insect farming (Shah, 2024), the picture could change again. So, how many animals will be farmed in the future? And what species groups will they belong to?
We provide rough-and-ready estimates to support advocates and funders in making prioritization decisions. Forward-looking estimates can help tailor present decision-making for future impact, enabling decision-makers to allocate resources to the species groups that may experience the most suffering in aggregate.
We estimate forecasts for four main groups of farmed animals: broiler chickens (the most widely farmed terrestrial vertebrate)[1], finfishes, shrimps, and insects. Within insects, we provide forecasts only for black soldier flies and mealworms, the species that have attracted the most financial investment (Shah, 2024).[2] Our species scope was based on practicality (e.g., data availability, time needed to develop forecasts), scale, and expectations of future growth.
We estimate how many individuals of these four groups will be slaughtered and will be alive at any moment annually out to 2033.
There are multiple challenges in forecasting farmed animal numbers, especially in data availability and uncertainties about the future. We provide more detail in the Caveats section. Due to these considerations and time constraints, this report does not:
- Identify new emerging farmed species (beyond insects)
- Explore geographic trends—we only estimate numbers on a global level
- Evaluate the case for sentience in different species groups
- Analyze the underlying causes of farmed animal industry growth
Findings
Animal farming is set to grow over the next decade
Our forecasts suggest that animal agriculture will continue to expand over the next ten years. This expansion translates to roughly 270% more animals slaughtered compared to current levels, according to midpoint estimates. We also found that the pace of growth decreases across the decade (Figure 2).
Figure 2: Midpoint estimates of the number of farmed animals (broiler chickens, finfishes, shrimps, and insects) slaughtered yearly from 2023–2033 (blue bars) and the growth rate in slaughter numbers between years (yellow circles and line).
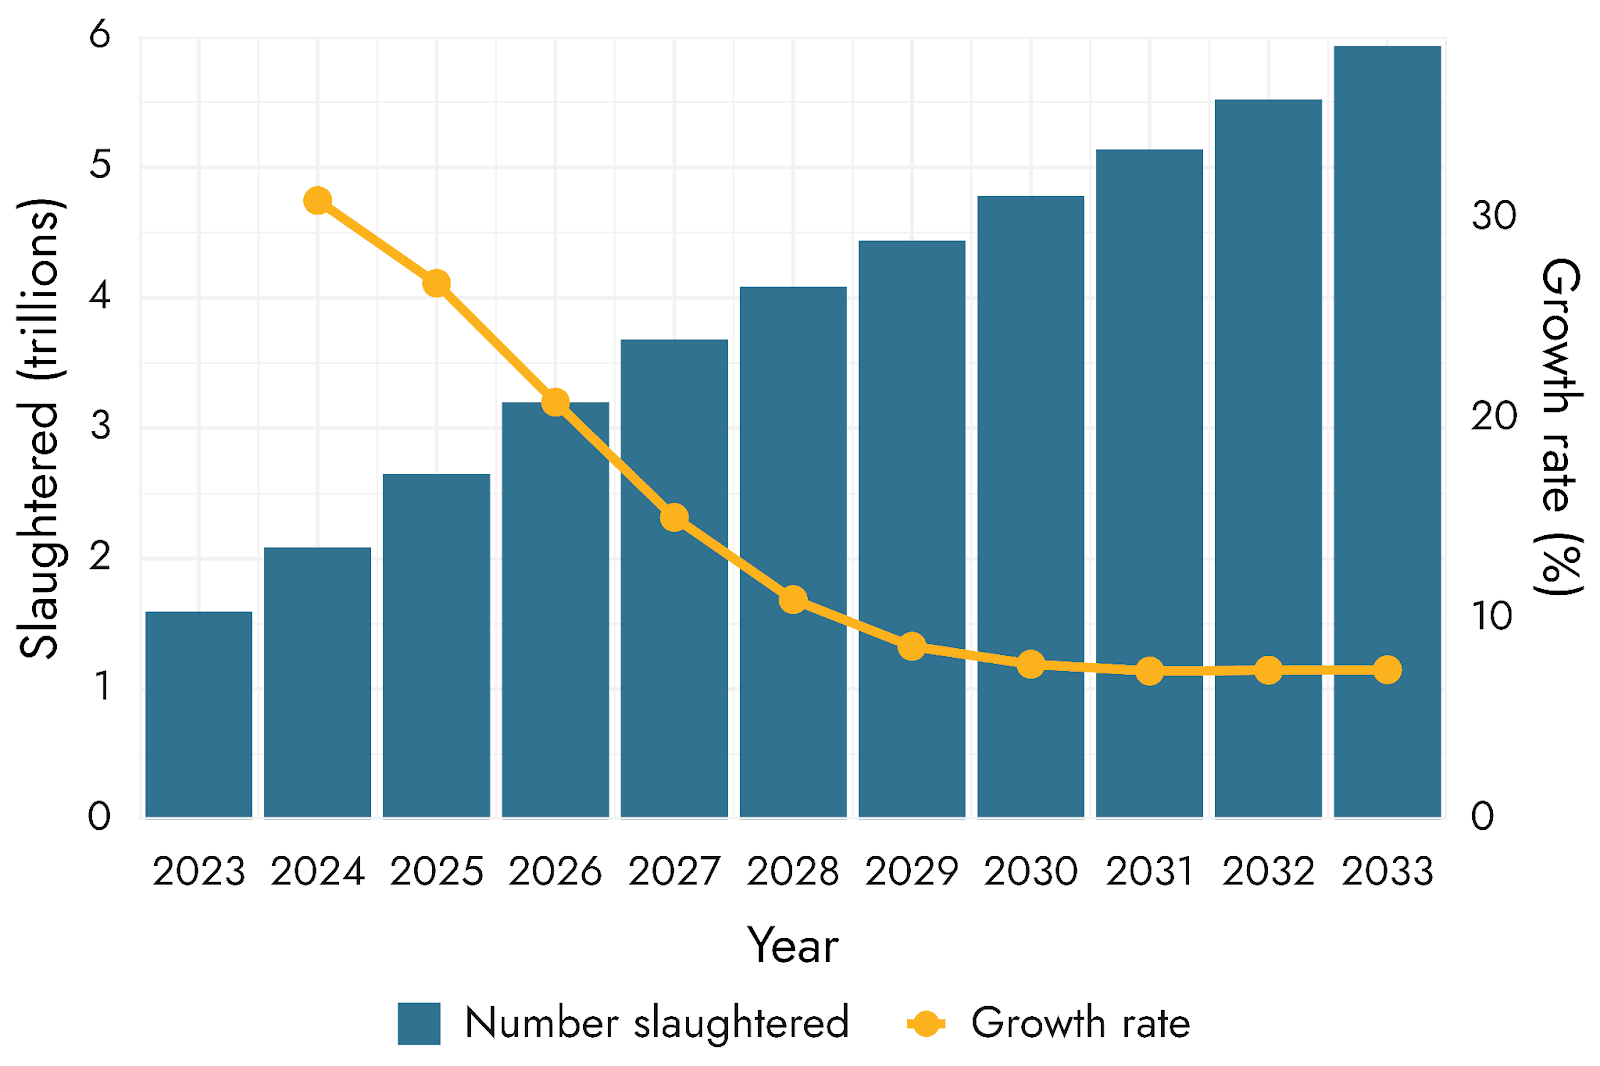
The first half of the decade shows the most rapid increase in slaughter numbers across species.[3] This growth is not uniform across species groups, however, with some sectors expanding much faster than others.
Invertebrate farming will drive most growth in the number of farmed animals. While the number of broiler chickens and finfishes show moderate increases of 15% and 16%, respectively, the scale of shrimp farming could grow by 73%. Insect production shows the largest change, with slaughter numbers surging by over 900% (Table 2).
Table 2: Estimates of recent and forecasted numbers of broiler chickens, finfishes, shrimps, and insects slaughtered and alive at any time, with percentage change in the midpoint estimates.*
Forecast year: 2033 for all groups
B = billion; T = trillion
Square brackets show 90% credible intervals
Almost 6 trillion animals could be slaughtered in 2033
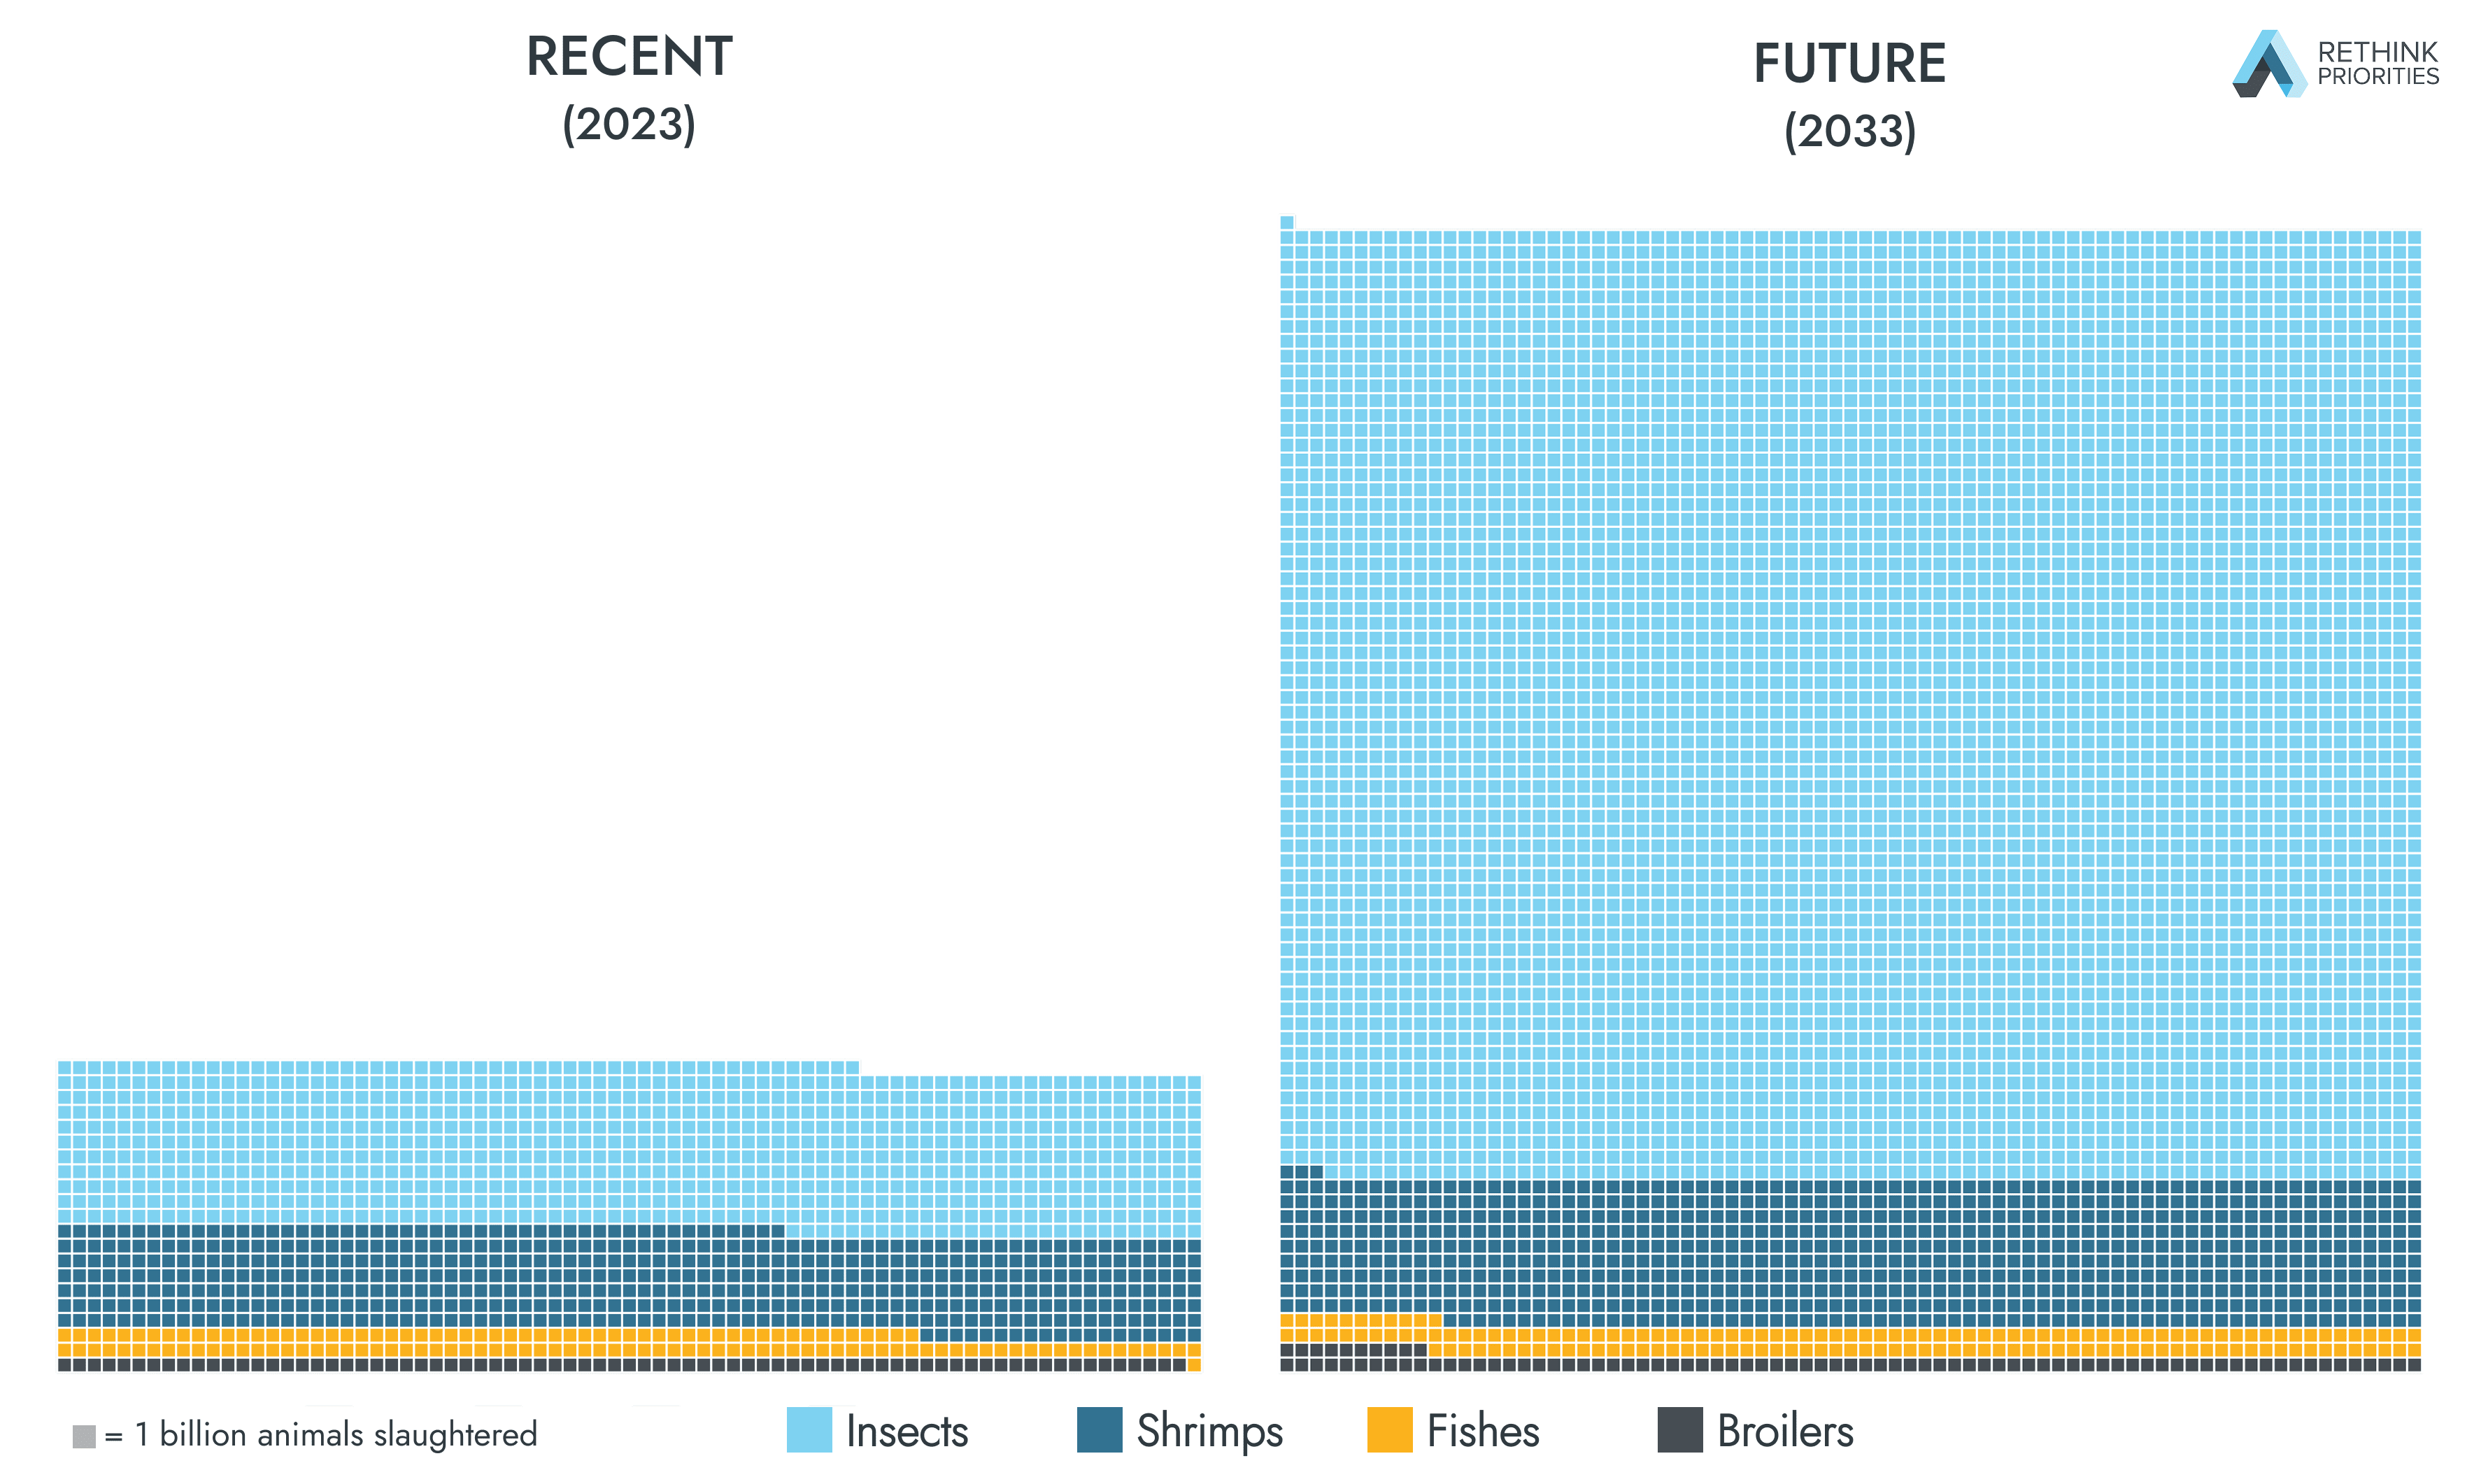
In 2023, around 1.6 trillion animals were slaughtered for food or feed. We project that by 2033 this number could be 5.9 trillion (Figure 3). Specifically, this represents an additional 11 billion broiler chickens,[4] 19 billion finfishes (90% subjective credible intervals: 12.3B; 25.8B), 230 billion shrimps (90% SCI: 158.4B; 327.5B), and 4 trillion insects (90% SCI: 1.7T; 13.3T).
Figure 3: estimated number of farmed insects, shrimps, finfishes, and broiler chickens slaughtered in 2023 and 2033. One square represents 1 billion animals. Numbers shown are midpoint estimates.
Meanwhile, the OECD-FAO Agricultural Outlook for the next decade forecasts only minor changes in land used for agriculture and suggests pasture land will decrease in many regions (p. 40). This correlation between rising slaughter numbers and shrinking pasture land implies that factory farms are more widespread in the future. Factory farms concentrate more animals per unit area, enabling higher production on less land. These conditions are generally associated with poor welfare.
Beyond an increase in the prevalence of factory farms, this trend could also suggest an escalation in how intensive practices are. The next decade could see both an increase in the number of farmed animals and a worsening of the conditions they experience.
The intensification of practices is echoed in the composition of global farmed animals: up to 95% of animals slaughtered in 2033 (among these four groups) could be invertebrates.[5] Our estimates suggest a shift towards smaller animals who can be reared at higher densities.
Today, most farmed animals are invertebrates and this majority will likely increase in the future
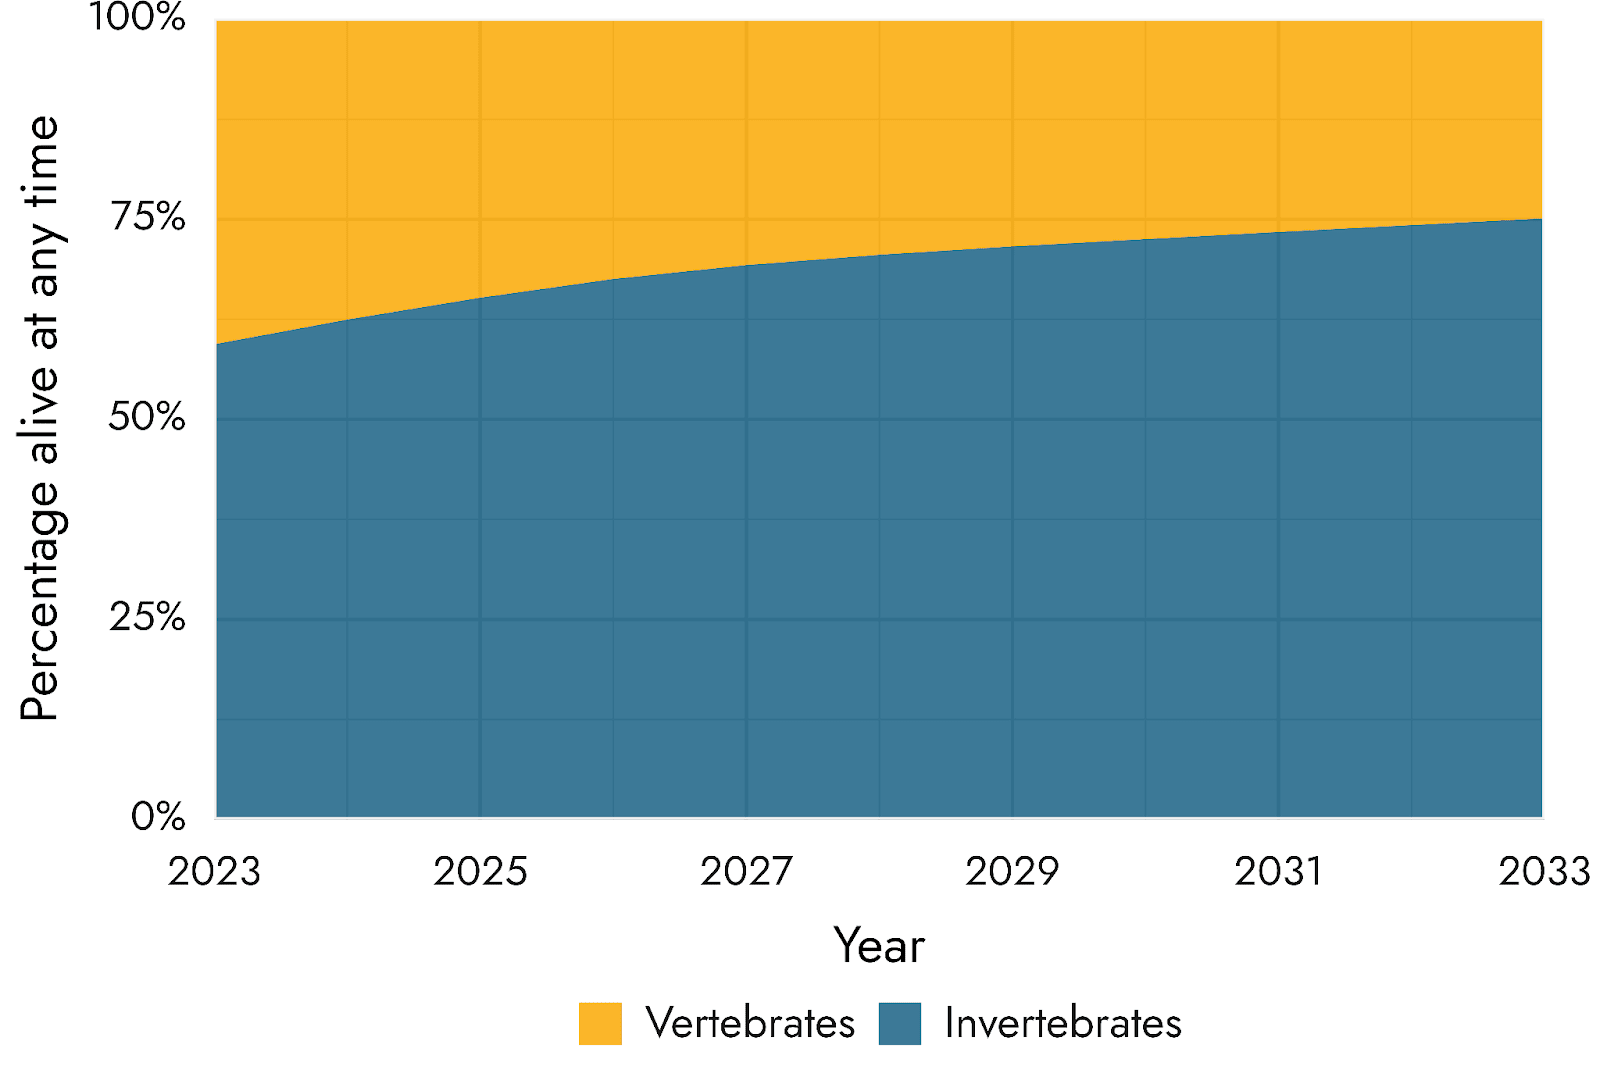
While slaughter statistics indicate that invertebrates warrant more attention, it could be argued that the metric alone is insufficient to evaluate the scale of suffering as it overlooks the time spent on farms. However, though insects have shorter lifespans, the scale of invertebrate farming is so large that invertebrates still dominate the number of animals alive at any time.
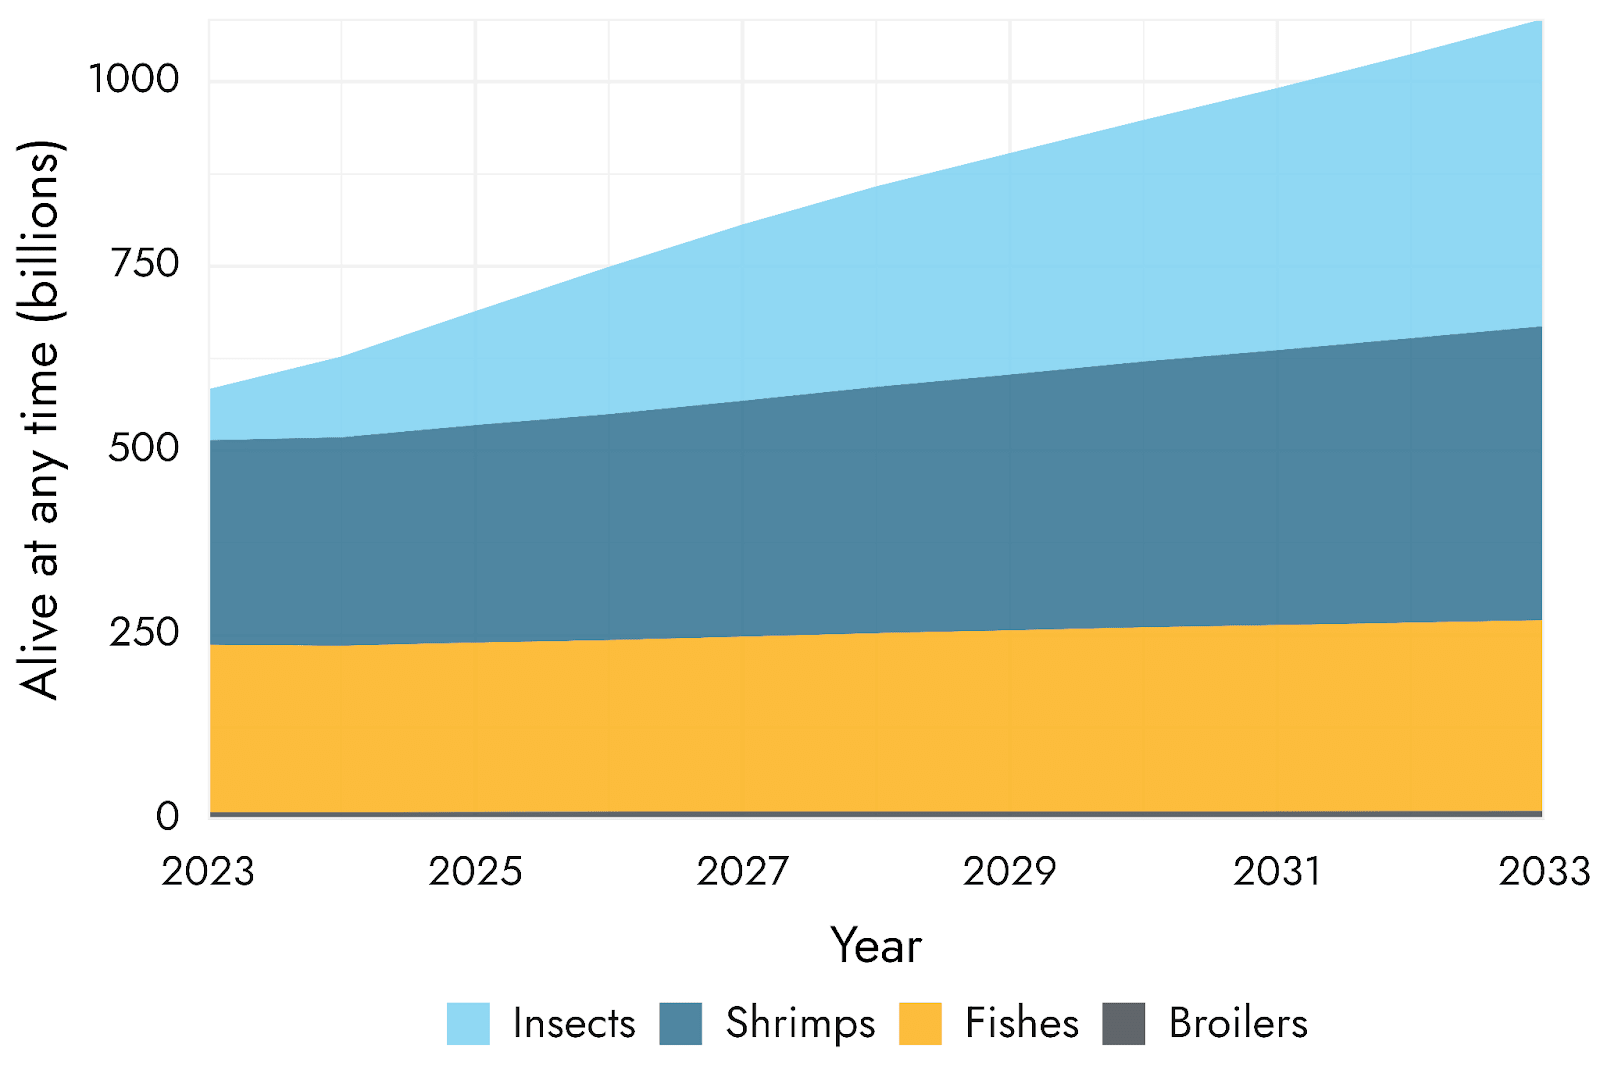
In 2023, invertebrates comprised over 50% of farmed animals alive at any time across the four major species groups we analyzed. By 2033, invertebrates could constitute three quarters (Figure 4).
Figure 4: Proportion of vertebrates and invertebrates alive on farms at any moment from 2023 to 2033. Vertebrates include broiler chickens and finfishes. Invertebrates include shrimps and insects.[6]
The predominance of invertebrates is not solely driven by insect farming expansion. Even excluding insects, invertebrates would remain the majority group due to the vast number of shrimps alive at any moment (Figure 5).
Figure 5: Midpoint estimates of the number of broiler chickens, finfishes, shrimps, and insects alive on farms at any given moment from 2023 to 2033.
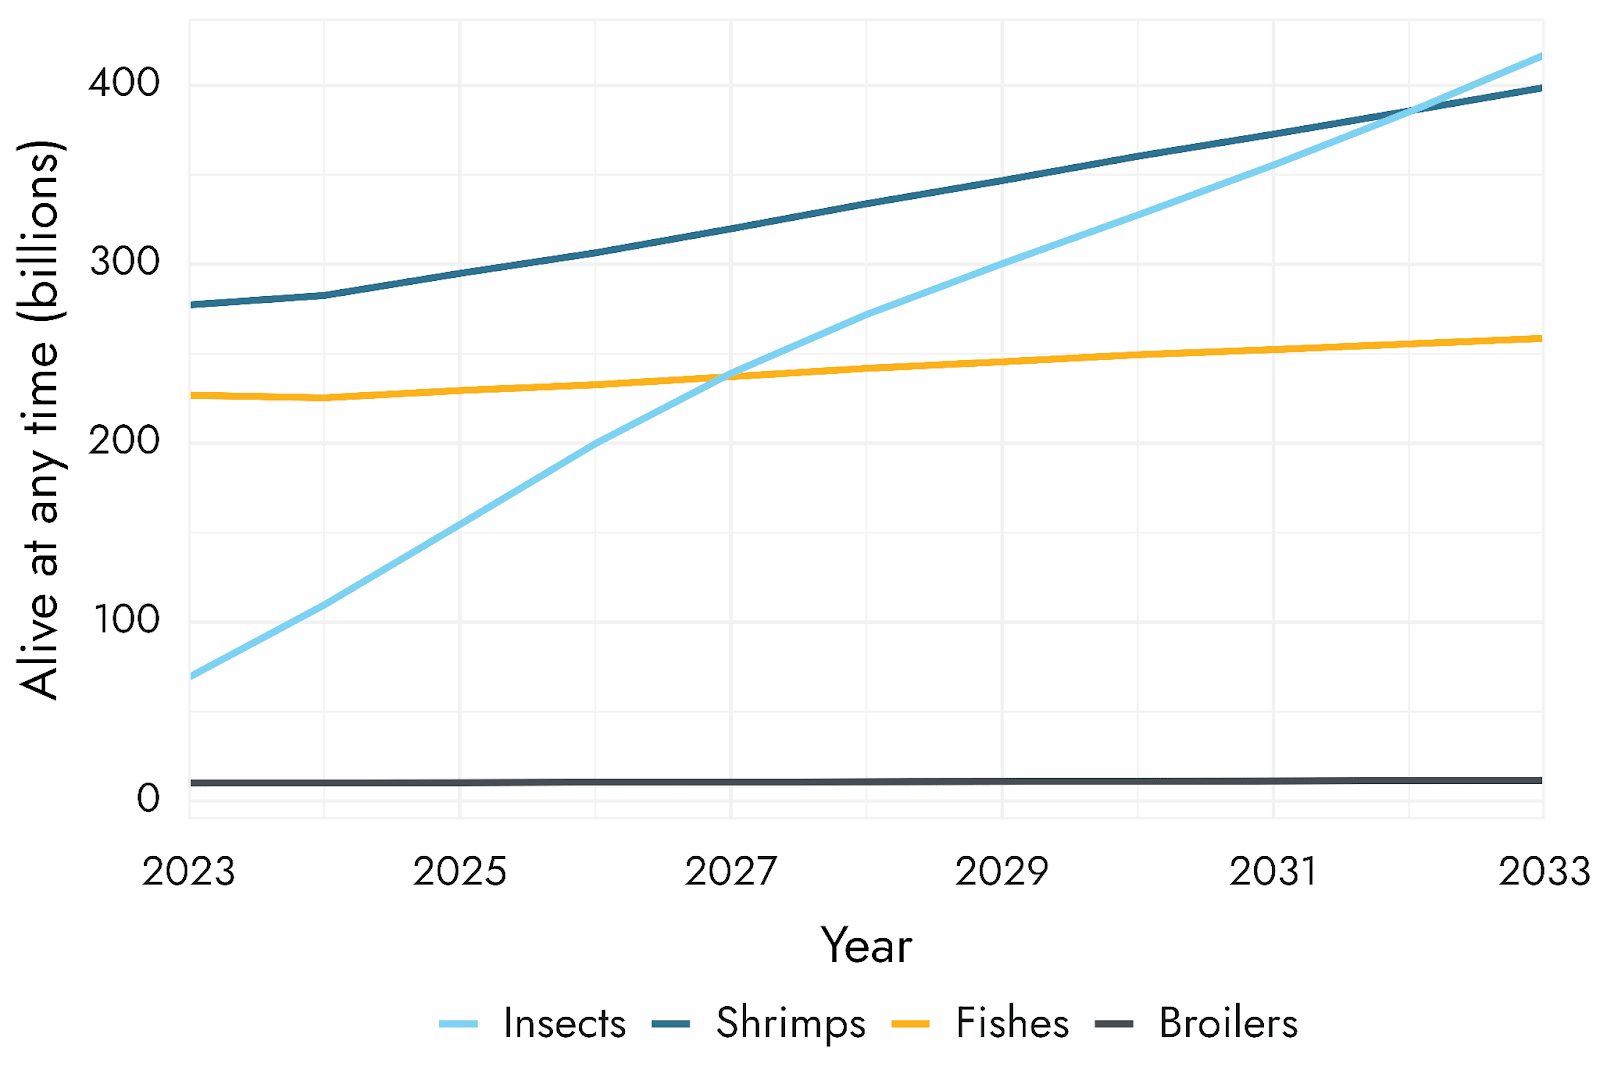
Shrimps, currently the most commonly farmed group (Waldhorn & Autric, 2023), could soon be outnumbered, as over the next decade the insect industry could raise more individuals at any given moment than any other group (Figure 6).[7]
Figure 6: Midpoint estimates of the number of broiler chickens, finfishes, shrimps, and insects alive on farms at any given moment between 2023 and 2033.
Insect farming could be the fastest-growing animal agriculture industry going forward, but its future is uncertain
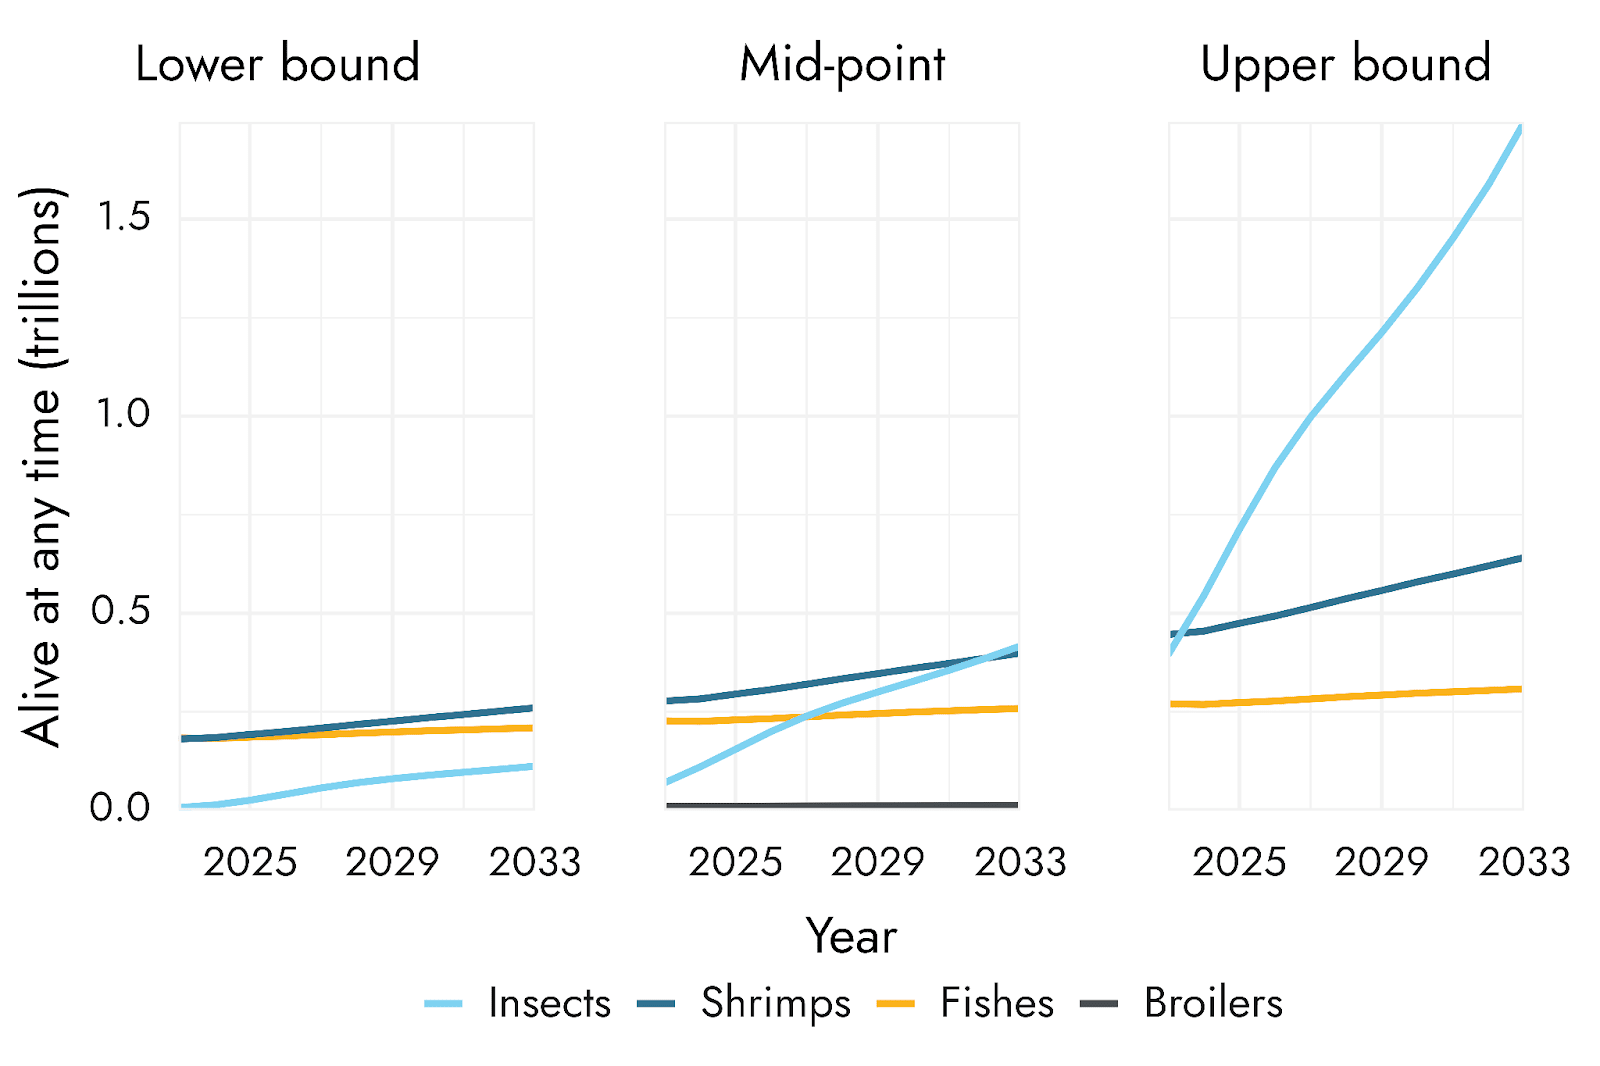
The results reported above largely focus on our midpoint estimates. However, these figures hide significant uncertainty about animal agriculture growth in the next decade. In particular, we are very uncertain about the future of black soldier fly and mealworm farming.
While our midpoint estimate is that 4.8 trillion insects will be slaughtered in 2033, our 90% credible intervals suggest that this number could range between 1.6 and 17.8 trillion. The number of insects alive at any time could vary from 127 billion to 1.9 trillion, with a midpoint estimate of 476 billion (Figure 7).
Figure 7: Lower bound, midpoint, and upper bound estimates for the number of broiler chickens, finfishes, shrimps, and insects alive on farms at any given moment from 2023 to 2033.[8]
The wide credible intervals are driven by uncertainty around the speed at which the insect farming sector scales up production. Over USD2B has been invested into insect farming businesses since 2014 (Shah, 2024). This is expected to result in significantly increased production. But the degree of growth through to 2033 is likely to depend on the types of business model that are successful. Production will likely be towards the lower end if most insect farming businesses fail to achieve profitability[9], and those that do, operate within a low-scale high-price niche. But production could approach the higher end if firms with lower-cost higher-scale business models are successful.
Implications for animal advocacy
The scale of farming is set to quantitatively and qualitatively change. Even if individual animal experiences on farms remain similar to current conditions, the rise in animals raised is likely to mean an overall increase in aggregate suffering. The nature of this suffering could also change with the emergence of insect farming, a group whose capacity for suffering we know little about. Animal advocates should therefore prepare for both a rapid expansion in the number of farmed animals and for this growth to bring new challenges posed by a shift towards animal groups with different welfare needs and biology.
Research into invertebrate sentience and welfare is crucial. There is increasing evidence that there is a non-negligible chance that insects and shrimps are sentient (Crump et al., 2022; Gibbons et al., 2022). If they are sentient, some farming practices could be causing significant suffering (McKay & McAuliffe, 2024; Barrett et al., 2023a; Barrett et al., 2023b). However, we currently know very little about the experiences of invertebrates on farms. This currently restricts opportunities to improve conditions for farmed insects and shrimps. Understanding invertebrates' needs is crucial to preventing harm.
The rise of insect farming could expand other animal agriculture sectors. Much of the recent investment into insect farming has been to support using insects as a feed ingredient for pets, aquatic animals and farmed pigs or chickens. While farmed insect producers are currently mainly selling to the pet feed market, rapid growth in insect farming has the potential to support the expansion of other farmed animal sectors.
Caveats
This report describes results from a short “back-of-the-envelope” style approach. Below, we describe the most consequential caveats to our results, but the list is likely non-exhaustive.
A key caveat arising from this approach is that our 90% subjective credible intervals, where provided, do not capture all known sources of uncertainty. Instead, due to time restrictions, they only capture sources of uncertainty that were included in the underlying estimates of recent slaughter and alive at any time numbers. We did not incorporate our uncertainty about any parameters we added beyond those provided by the sources. For example, we did not formally capture uncertainty around the OECD-FAO’s growth forecasts for chickens or aquatic animals because bounds were not provided for these estimates, nor did we model uncertainty in metrics we added ourselves, such as the lifespan of animals that die prematurely. A more comprehensive approach would have wider credible intervals for each animal group, and also capture correlations across species (e.g., rapid growth scenarios in insect farming potentially leading to faster growth in aquatic animals).
The results should be interpreted as rough estimations that can inform some aspects of resource prioritization, but should not be used for precise decision making. Barring our uncertainty about there being significant changes in the insect farming sector—as depicted by our wide credible intervals—we are slightly more confident in the rank-order of our results than we are in the specific estimates. This means that, while we are not sure where insects will place, we are more certain that shrimps will outnumber finfishes, who will outnumber broiler chickens. Conversely, the specific estimates we give should be treated with caution for a number of reasons.
Our forecasts for insects do not include some commercially important species such as silkworms, honeybees, and crickets. Exclusion of these species was based on data availability, time, and data analyzed in Shah (2024) suggesting most of the investment (and by extension, growth prospects) into insect farming was for black soldier fly larvae and mealworm production.
Our estimates do not account for potential changes in slaughter weights. For example, it is possible that some demand for meat can be partially met by increasing the amount of meat from each animal, which raises production without the need for more individual animals. Of course, higher slaughter weights present their own welfare concerns, but these are beyond the scope of the present report. It is important to note that changes in intrinsic characteristics of farmed species, including slaughter size but also in other factors like growth, could change the forecasted numbers.
In the fish model, in instances where species were missing data on harvest age and mortality rate, we used the median value of the species with available data. In practice, this meant 92% of species, which account for 22% of finfish production by volume, had median values for these metrics, rather than species-specific information. The Fishcount data our forecasts are based on use a similar approach for species missing estimated mean weights (around 65% of species). Our estimates for finfishes slaughtered and alive at any time are therefore made significantly uncertain by the limited available species-specific data.
The OECD-FAO Agricultural Outlook for finfishes covers “salmon and trout, shrimp, tilapia, carp, catfish (including Pangasius), seabream and seabass, and molluscs” (p. 243). While the forecasts are applied to FAO tonnage data that should cover most farmed fish species, it is unclear which species are used to estimate growth. Our results are likely sensitive to the breakdown of growth across species, and if commercially important species are missing from growth considerations, the forecasts could be an underestimate.
Acknowledgements
This report is a project of Rethink Priorities—a think-and-do tank dedicated to informing decisions made by high-impact organizations and funders across various cause areas. Hannah McKay did the analysis and wrote the report. Sagar Shah oversaw the project. Thanks to William McAuliffe for feedback, Shaan Shaikh for copy editing, and Urszula Zarosa for assistance with publishing the report online and dissemination.
|

Appendices
Appendices are avaliable here.
Full calculations are available in this spreadsheet.
References
References are avaliable here.
- ^
While we do not estimate and present the results for laying chickens alive at any time here, a very rough calculation suggests that the number in 2033 would be around 9 billion, just below the number of broiler chickens.
- ^
Our farmed insect scope excludes some commercially important farmed insects like crickets, honeybees, and silkworms.
- ^
It is important to note that the further into the future an estimate is, the more uncertain it becomes. It is possible that future events we have not accounted for will influence the speed of animal agricultural expansion.
- ^
Our forecasts for broiler chickens lack credible intervals because the FAO data our forecasts were based on do not report uncertainty—see Caveats section for more detail.
- ^
Note the share could be even higher if other commercially important farmed invertebrate species were included (like crickets, silkworms, and honeybees) in scope, although lower if growth in black soldier fly and mealworm farming is slower than implied by our mid-point estimates.
- ^
Proportions were calculated using our midpoint estimates.
- ^
According to our midpoint estimates. When factoring in our uncertainty, credible intervals for insects and shrimps overlap. See Appendix 2 for graphs with credible intervals.
- ^
There are no lower or upper bounds on our broiler chicken estimates (see Method section). Note that ‘Insects’ includes only black soldier fly larvae and mealworms.
- ^
Note that we did not update the Shah (2024) projections to take into account developments at Ynsect and Agronutris since publication. If we were to update the model projections, we would assume slightly lower future investment flows and a higher firm failure rate. Both of these would reduce production of farmed insects, but we do not believe the changes would be big enough to materially change our main take-aways.
- ^
For example, the most recent estimate for shrimp slaughtered and alive at any time was Waldhorn and Autric’s (2023) estimate for 2020. In this instance, we obtained tonnage data for 2020 to 2023 from FAO and calculated the growth rate between years. The growth rate between years for 2024–2033 was calculated from the OECD-FAO Agricultural Outlook forecasted tonnage.
- ^
The unpublished results are available in the calculation spreadsheet.
Ozzie Gooen @ 2025-05-09T20:55 (+10)
Happy to see this, but of course worried about the growth of insect farming. I didn't realize it was so likely to grow.
One small point: I like that this essay goes into detail on a probabilistic estimate. I'd find it really useful if there were some other "sanity checks" from other parties to go along with that. For example, questions on Manifold or Metaculus, or even using AI forecasters/estimators to give their takes.
This strikes me as a pretty good forecasting question (very precise, not too far away). I imagine it would be easy to throw it on Manifold and spend $20 or so subsidizing it.
Mo Putera @ 2025-05-10T12:14 (+6)
The closest I know of is the Metaculus question How many chickens will be slaughtered for meat globally in the following years? from 2022, which forecasts 82.2 billion chickens slaughtered in 2032, declining afterwards to 64 billion in 2052 and 9.1 billion in 2122 (with increasingly wide prob dists), as part of the Forecasting Our World in Data: The Next 100 Years project.
The 2023 forecast was a slight overprediction (78.5bn vs 76.25bn actual), which gives me a bit of hope that the rest of the curve will bend downwards faster than predicted.
Here's the distilled forecaster commentary for 2025 onwards:
2025: Forecasters generally expect that global chicken consumption will continue to grow in the next few years. Their expectations are based on extrapolation of the data from 2019, with the assumption that there will not be any major changes in consumer attitudes towards animal ethics, tastes, or disease outbreaks. Forecasters anticipate that meat alternatives, such as lab-grown or plant-based options, may start to have an impact on the industry by 2030, but are not expected to significantly change the data for 2025. Forecasters also acknowledge the potential for: (1) improved standards of welfare to decrease consumer preference for poultry and (2) genetic engineering to increase yields at lower cost. However, the feasibility, regulatory permissiveness, and consumer preferences for the latter trend remain uncertain.
2032: Overall, forecasters expect global chicken consumption to continue to grow over the next decade. While they do not expect a significant global cultural shift towards lower meat consumption on this timescale, they do anticipate a limited decrease in highly developed countries to be more than offset by significant increases in consumption in less wealthy countries, as the latter’s populations become wealthier. Forecasters expect the economic growth of the last decade to slow only slightly over the next, but some do expect annual global growth to stall at some point between 2032 and 2052. This would arguably lead to a stark reduction in chicken consumption.
2052: Forecasters expect that affluence and population increase will lead to a continuation of the trend of increasing chicken demand per capita and total chicken production. However, they also expect that cultured meat and other technological advances may have a material impact on meat consumption, particularly in highly developed countries. In fact, many predict that lab-grown or plant-based alternatives will dominate the market by this point. Beyond 2052, forecasters express much more uncertainty, but expect that meat alternatives and artificially grown meat will continue to replace the majority of chicken meat obtained by slaughtering chickens. They project that the rate of growth will slow as population growth slows, leading to a plateauing of chicken consumption while the cost of raising more chickens increases. Notably, they expect that ethical concerns will play only a minor role globally by this time.
2122: With a long-term horizon of 100 years, forecasters expect technological advances in meat alternatives to lead to a massive decrease in chicken consumption. They predict that, by 2122, global energy consumption will be pulled in two directions, there will be: (1) both a demand for better energy efficiency and lower consumption overall and (2) cheaper and more abundant electricity as renewables continue to fall on the cost curve. Therefore, it is highly likely that cultured meat will have been cost-competitive with traditional meat for decades. There are some forecasters who expect the global chicken population to be around half of its peak and, given the availability of cheap, high-quality cultured meat, there’s a chance that the number of slaughtered poultry may fall close to zero.
Vasco Grilo🔸 @ 2025-05-13T09:08 (+3)
Thanks for sharing! There were 27.2 billion chickens and 8.44 billion laying hens in 2023 according to FAOSTAT, which imply 18.8 billion (= (27.2 - 8.44)*10^9) broilers and male breeders of chickens. I guess the number of broilers is much larger than that of male breeders of chickens, and therefore estimate there were around 18.8 billion broilers in 2023, which is 1.86 (= 18.8*10^9/(10.1*10^9)) times your estimate of 10.1 billion (in Table 1). This does not affect your conclusions, but it would be interesting to know what explains the difference.
AxellePB 🔹 @ 2025-05-19T09:27 (+3)
I'm really curious to know what accounts for this significant difference in estimates (10.1 billion vs 18.8 billion). It's a big difference, and yet you are both relying on FAOSTAT data. Do you have an idea?
Vasco Grilo🔸 @ 2025-05-19T12:56 (+2)
Hi Axelle,
Rethink Priorities (RP) assumed 76.3 billion broilers were slaughtered in 2023, and FAOSTAT says 76.3 billion chickens were slaughtered for meat in 2023. Some of the chickens slaughtered for meat not being broilers (they could be laying hens, breeders, or male chicks) would contribute towards RP having overestimated the number of broilers.
I think my estimate for the number of broilers is higher than it should be due FAOSTAT overestimating the number of chickens. They say the following about livestock numbers (emphasis mine).
The data on livestock numbers are intended to cover all domestic animals irrespective of their age and the place or purpose of their breeding. Estimates have been made for non-reporting countries as well as for countries reporting incomplete data. However, in certain countries, data for chickens, ducks and turkeys do not yet seem to represent the total number of these birds [so I may have underestimated the number of chickens, and therefore ]. Certain other countries give a single figure for all poultry; data for these countries are shown under “Chickens”.
On the other hand, I would expect the vast majority of poultry birds to be chickens, so I do not think the above alone would explain my estimate being 1.86 times RP's.
Another consideration is that RP used a single value for the harvest age and mortality of broilers. In reality, they both vary, and the mean weighted by broilers slaughtered could be lower than what RP assumed, which would lead to a lower number of broilers alive.
Vasco Grilo🔸 @ 2025-10-20T19:13 (+2)
Hi Hannah and Sagar,
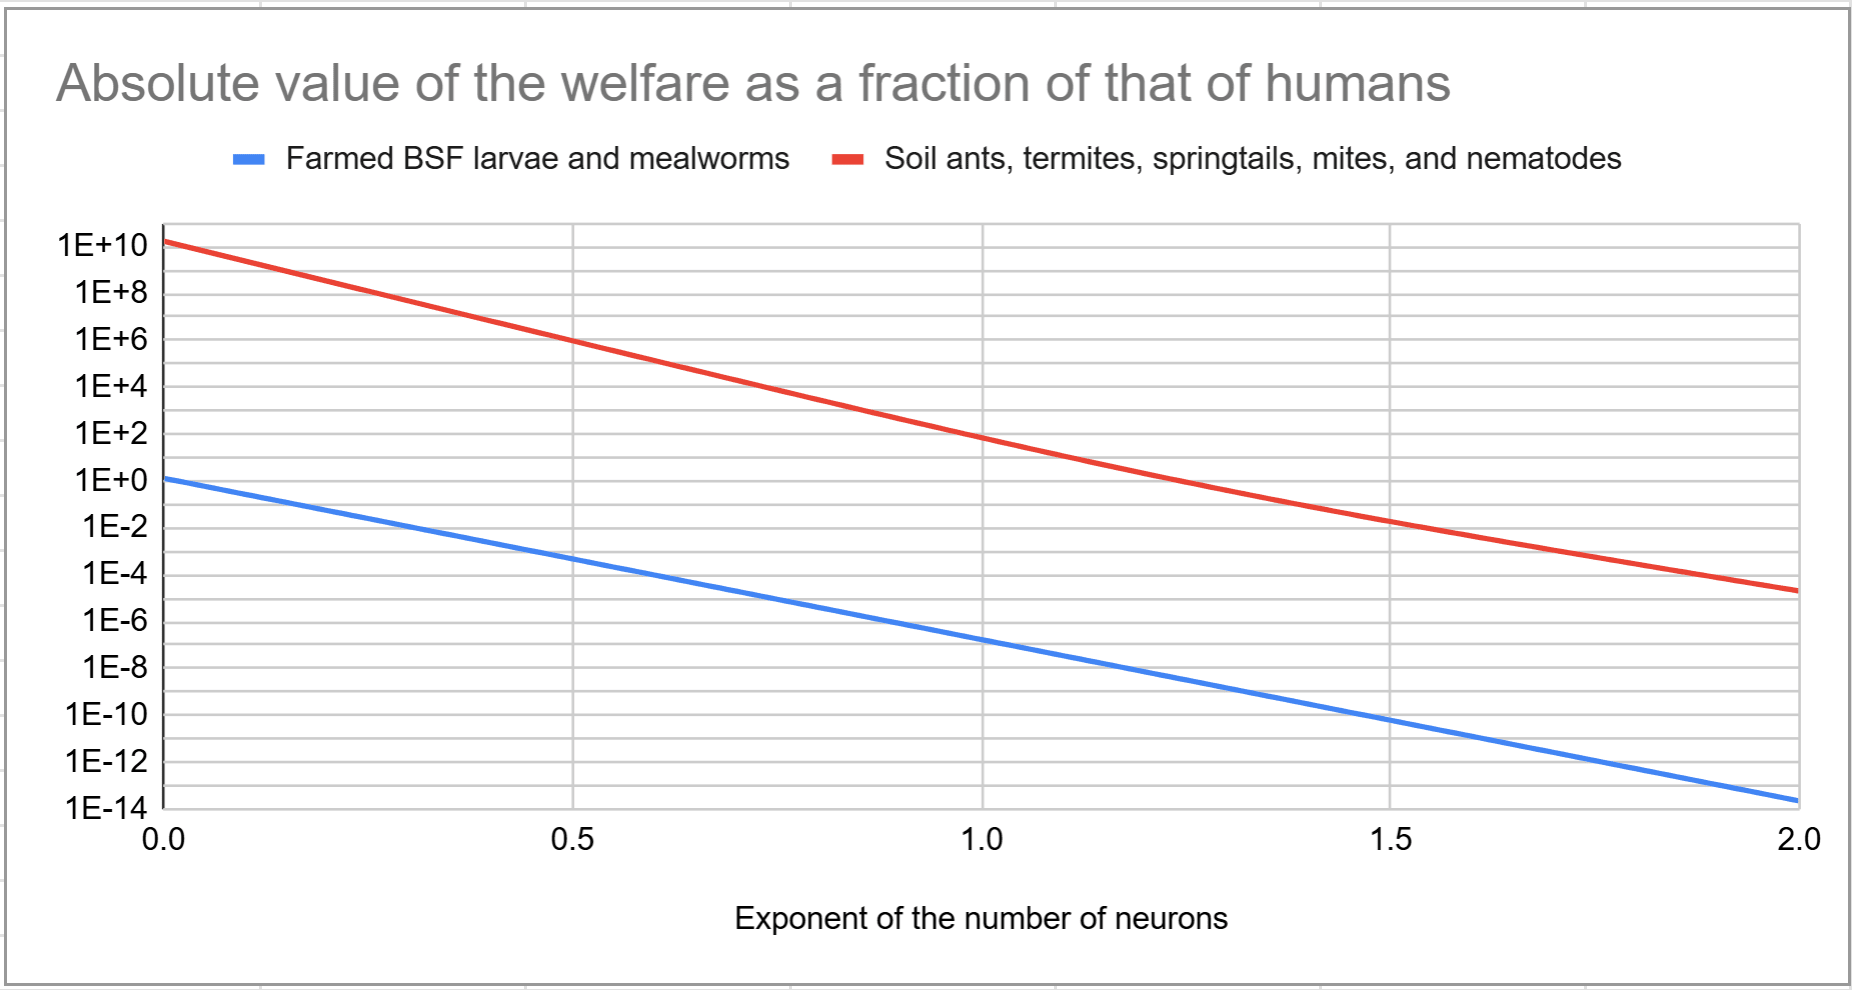
You may be interested in my post Total number of neurons and welfare of animal populations. I estimate soil ants, termites, springtails, mites, and nematodes together have 413 M (= 1.76*10^23/(4.26*10^14)) times as many neurons as farmed black soldier fly (BSF) larvae and mealworms together, and 2.03 billion (= -7.00*10^15/(-3.44*10^6)) times as much welfare in total for welfare per animal-year proportional to "number of neurons as a fraction of that of humans"^0.5. As illustrated below, the ratio is huge for other exponents besides 0.5.
Vasco Grilo🔸 @ 2025-06-25T11:30 (+2)
Hi Hannah, Sagar, and @William McAuliffe,
To which extent is Rethink Priorities (RP) open to considering the effects of animal farming on wild soil nematodes, mites, and springtails? I think it would be great to know how different forecasts for the growth of animal farming impact land use. For example, insect farming may increase cropland in modest growth scenarios where it mostly replaces plant-based feed, but decrease cropland in large growth scenarios where it is enabled by waste products, and therefore decreases other sources of feed.
AndrewRowan @ 2025-05-14T20:58 (+1)
I have a problem with reports that track all the farmed species, reporting numbers raised on the same chart. In terms of land animals, broiler chicken numbers dwarf pigs, bovines, goats and sheep, and a chart plotting all of them together hides far more than it explains. Now with the advent of insect and shrimp farming, broilers also virtually disappear on a chart plotting invertebrate and vertebrate species together. I can see plotting growth rates for all species on a single chart but only where the farming of a particular species has passed from early explosive growth to a slower growth trajectory. In fact, perhaps analyses of farmed animal populations should identify which species have passed from early-stage explosive growth into a slower growth stage reflecting a maturing industry.
I would also note that the FAO forecasts of 50% or more increases in animal product consumption by humans seldom address where the animal feed to raise twice as many animals might come from. The world currently uses around 70% of arable land to raise food for humans and farmed animals. The world would need to double crop yields per sqkm to produce enough feed for the additional animals. While crop yields are low in some parts of the world, it is hard to discern where the extra feed will come from to raise and slaughter twice as many animals a year!
Andrew Rowan
Hannah McKay🔸 @ 2025-05-20T12:30 (+1)
Hi Andrew Rowan, thanks for engaging with our work!
I agree that sometimes graphs where the smallest groups are difficult to see can make it hard to draw conclusions about those animals. That is one reason we moved the graphs with credible intervals to the appendix, as they made it even harder to see animals other than insects. However, for this report, our aim was to provide rough numbers to help with prioritisation, which makes showing the relative trends the most useful visualisation. The raw data is avaliable in the tables and linked methods spreadsheet if you want to examine the other groups more.
Your point about crop yields to support agricultural expansion is really important. This is currently one of the cruxes of how the farmed insect industry might grow – while farmed black soldier fly larvae could in theory eat any substrate, they currently are fed cereal and grains, which as you say could be a limiting factor for industry growth. On the other hand, if insect farming does expand, insects could be used as feed for the other farmed animal groups, which would make crop yields less of a limiting factor.