GWWC's 2025 impact evaluation (executive summary)
By Aidan Whitfield🔸, Giving What We Can🔸 @ 2026-06-30T11:35 (+86)
This post presents the executive summary from Giving What We Can’s impact evaluation for 2025. At the end of this post we share links to more information, including the full report and working sheet for this evaluation. We look forward to your questions and comments!
Executive summary
Giving What We Can (GWWC) is working towards a world without preventable suffering or existential risk, where everyone is able to flourish. We do this by making effective and significant charitable giving a norm among those who can — primarily through our flagship program: the 🔸10% Pledge, a lifetime commitment to give at least 10% of income to highly effective charities. Annually, our growing community of roughly 20K donors and pledgers records over $80M USD in charitable donations with GWWC.
As an organisation that advocates for effective giving, we think it is important to hold ourselves to the same standard. This report is our third impact evaluation of this type and examines the cost effectiveness of ourselves as an organisation in 2025.
Our headline findings and estimates:
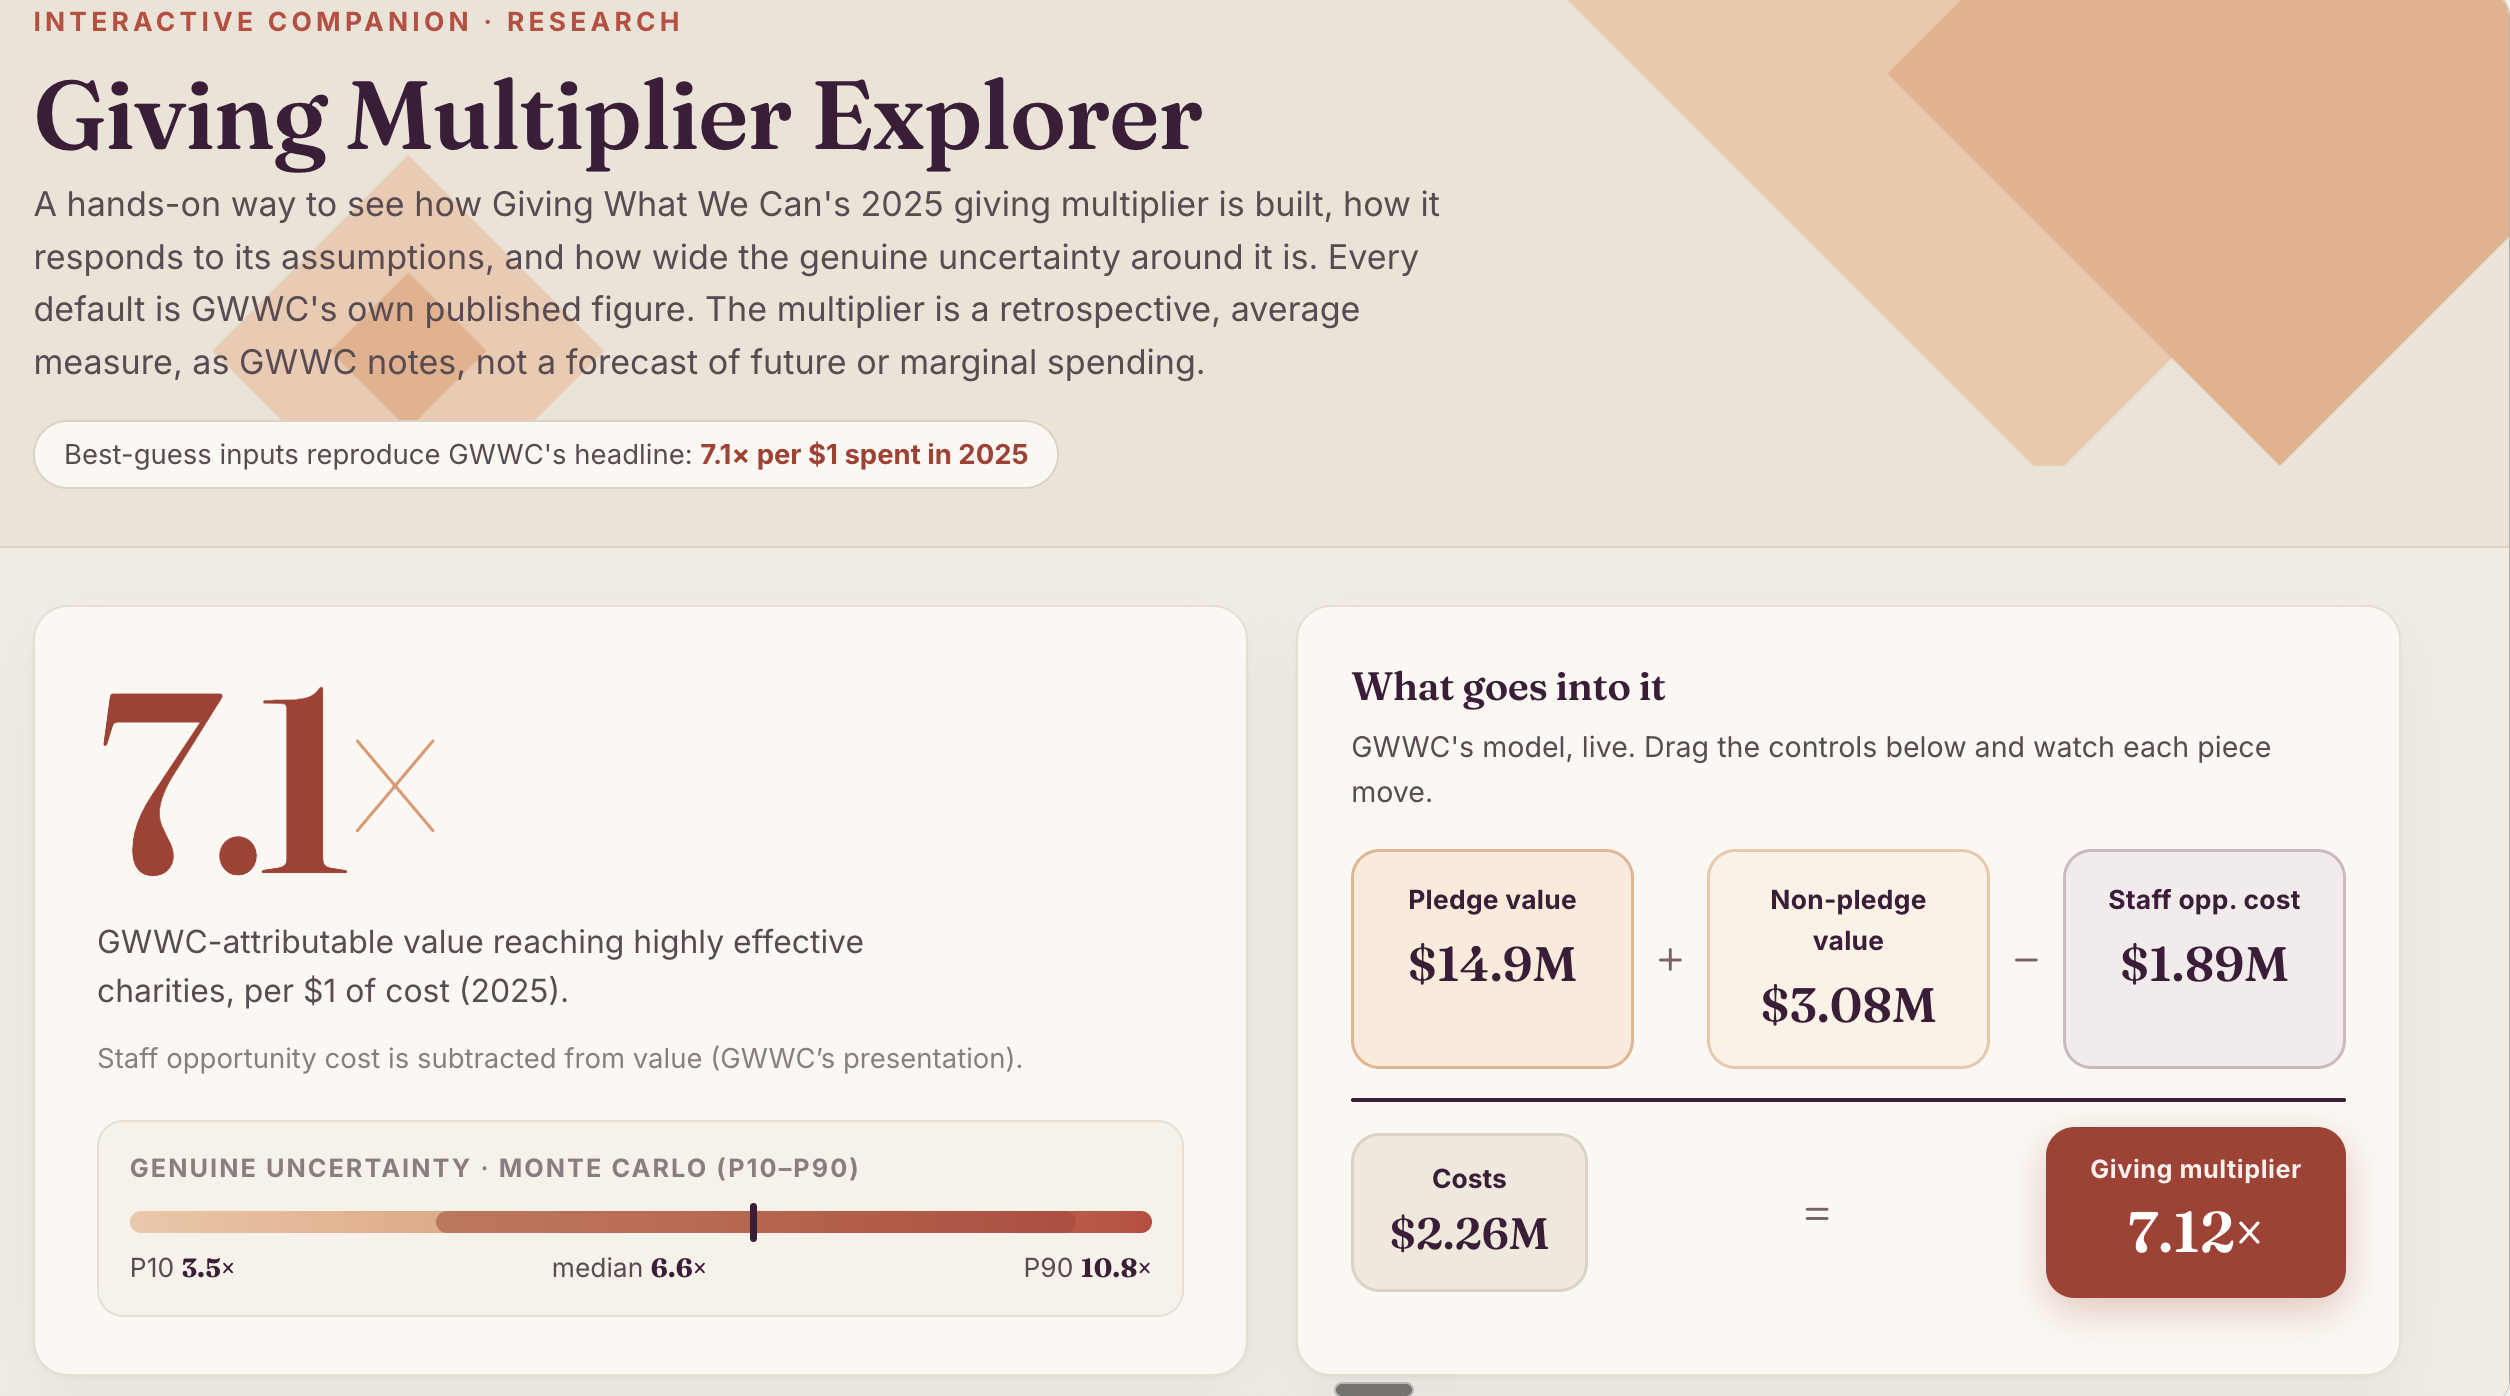
- Our 2025 giving multiplier was 7x — GWWC produced $16M in value for highly effective charities in 2025, at a cost of $2.3M to our funders — meaning for the average $1 spent, we caused $7 in donations to highly effective charities. This is up from 6x in our previous evaluation.
- This improvement was driven by significant growth — in 2025, new 10% Pledges grew 24% and new Trial Pledges grew 43%. The volume of pledge donations GWWC caused to go to high-impact charities increased by 35%.
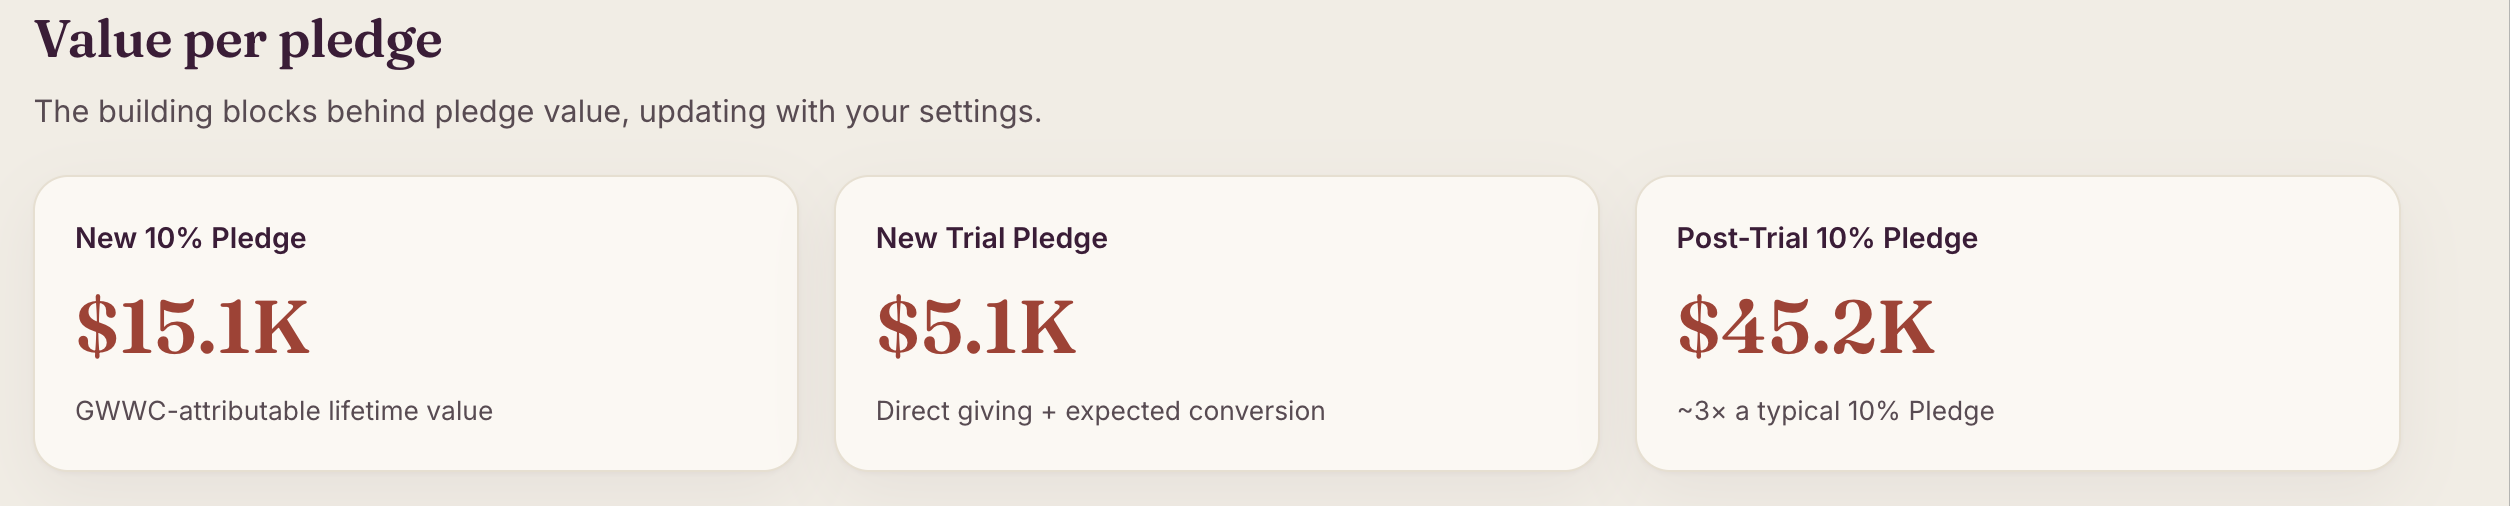
- The 🔸10% Pledge remains a strong driver of effective giving — the average new 10% pledger will donate roughly $100K over their lifetime. After adjustments, we estimate $15K of this is impactful giving attributable to GWWC's work — broadly stable from our previous estimate, despite major updates to our modelling.
- 🔹Trial Pledges are more valuable than we previously thought — our estimate has more than doubled to $5K per Trial Pledge, driven by our finding that trial pledgers who go on to take a 10% Pledge exhibit much higher retention rates than average 10% pledgers.
- Pledger retention is a significant lever for increasing our impact — 10% Pledge attrition is faster than we previously estimated, and pledgers who stay give more over time, making retention efforts more valuable.
- We have updated our guidance on Trial Pledge acquisition value — we now recommend that GWWC and pledge partners attribute $2K to the work of acquiring a new Trial Pledge (up from $1K). Our 10% Pledge acquisition guidance is unchanged at $10K.
- We have growing evidence that GWWC influences some very large pledge donors — while the largest volume of donations comes from donors in the $10–100K bracket, several pledge donors now giving at the $1M+ level report that GWWC affects the amount they give.
These estimates have important limitations: our multiplier measures average historical cost effectiveness, not future or marginal returns; we do not capture all of our impact; and our analysis relies on modelling and survey data that is inherently uncertain. We discuss these limitations throughout the report.
Where you can learn more
- Our full impact evaluation report — this includes a much more detailed description of our assumptions, considerations, methodology, and results.
- Our working sheet, where we combine our inputs to calculate our results.
- Our donation classification sheet, where we categorised pledge donation recipients to estimate our effectiveness coefficients and to assess pledge giving by cause.
Mo Putera @ 2026-06-30T14:42 (+15)
Yet another banger of a report! Awesome stuff.
I asked Claude to create an interactive dashboard version and to "make it similarly aesthetically pleasing":
Pledge values:
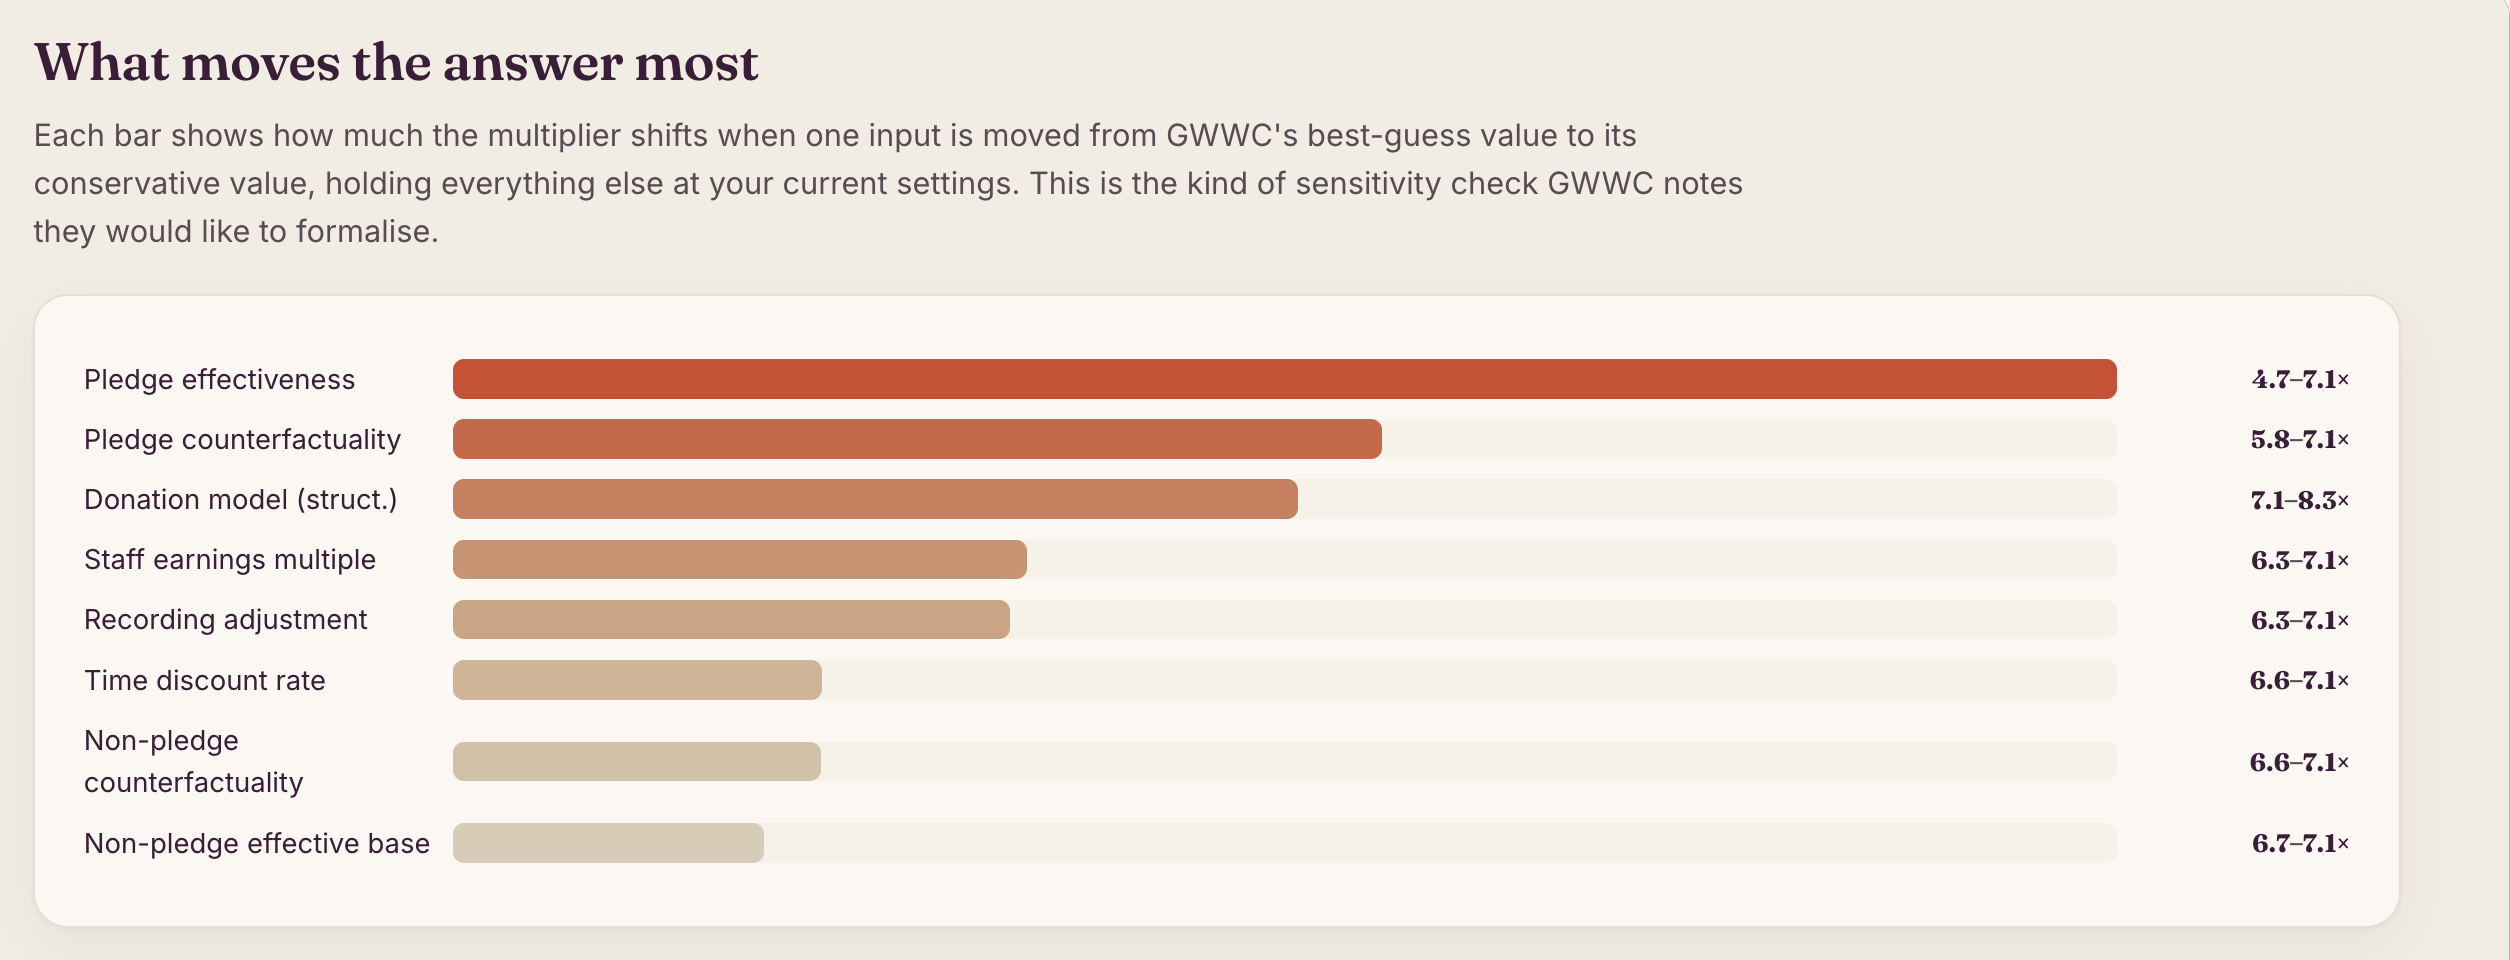
Sensitivities:
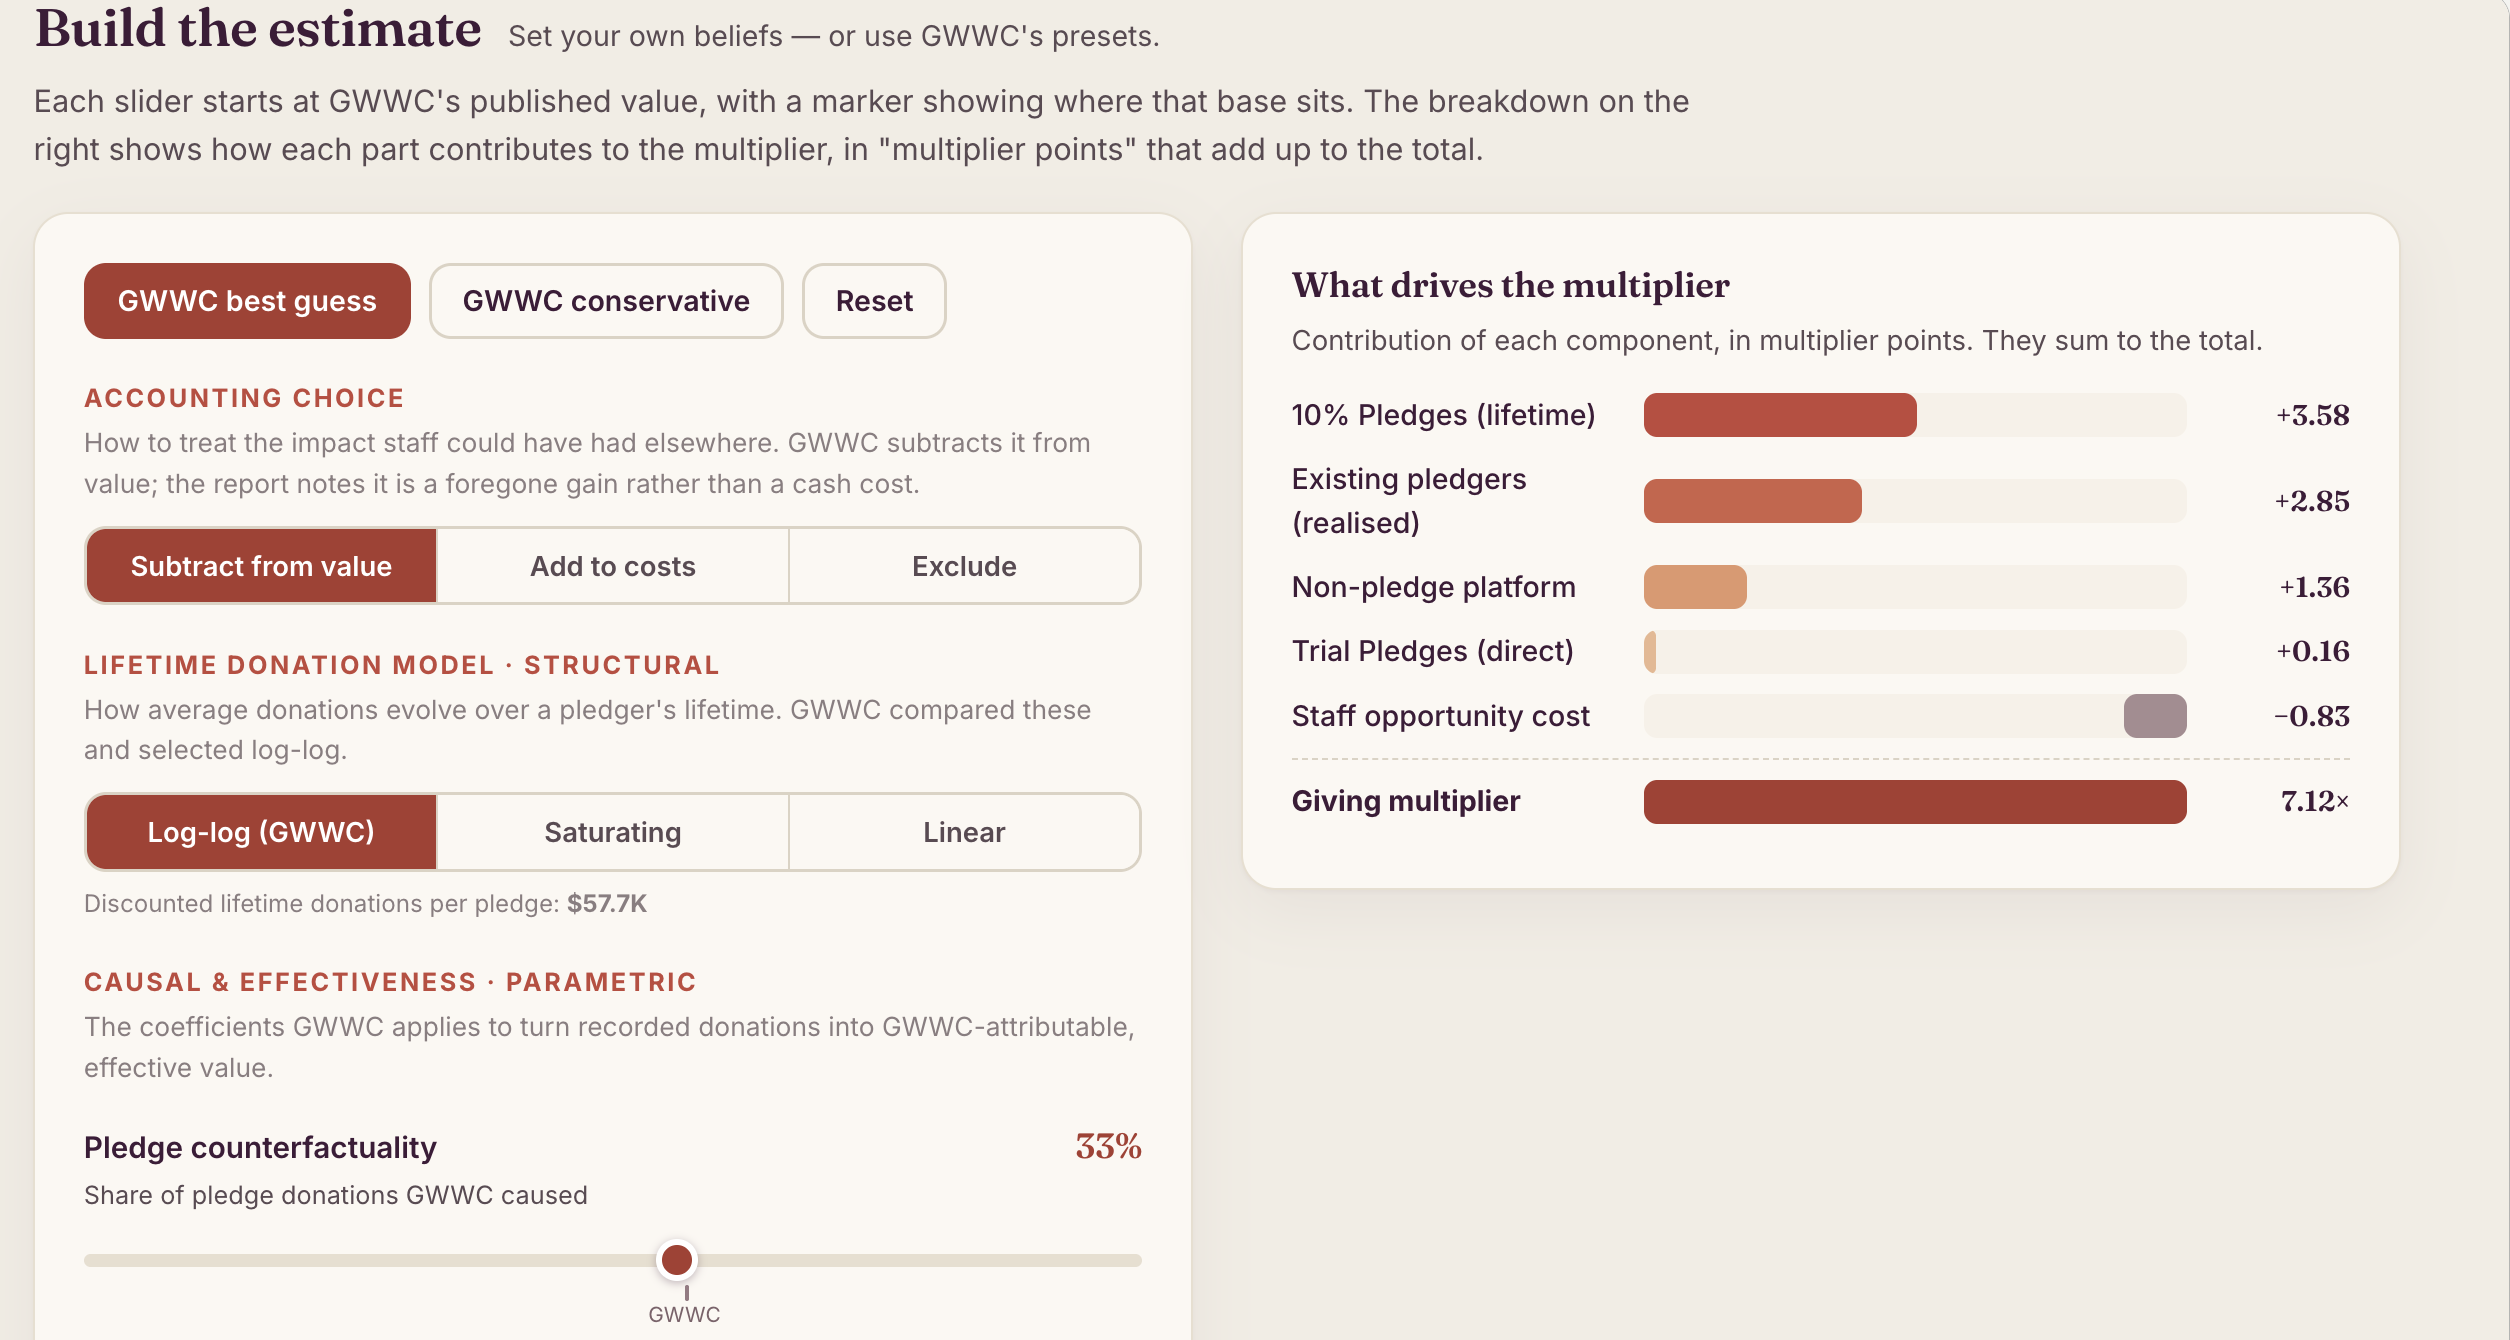
Build your own multiplier:
You should definitely trust the actual report over this dashboard, if you see something funny blame Claude...
Aidan Whitfield🔸 @ 2026-07-02T08:34 (+5)
Thanks, Mo! The dashboard is really cool - maybe we should even build something like this for next year's evaluation.
huw @ 2026-07-01T09:33 (+4)
(Just realising I am developing an eye for AI-generated graphics now, to complement my eye for AI-generated text, images, and videos. There’s something so familiar about this style.)
Mo Putera @ 2026-07-01T11:40 (+2)
It can't help it too. Here's the CoT from a microsite I asked Claude to build recently:
The frontend-design skill is warning me away from exactly the palette I was about to use—cream background, serif display, terracotta accent—which it flags as a common AI default. I need to reject that instinct and make a real aesthetic choice that's specific to this project, not a templated solution. ...
Yet the resulting aesthetics were still unmistakably Claudey. Aesthetics taste seems quite the bulwark.
Kestrel🔸 @ 2026-06-30T17:08 (+8)
Great job! Wonderful to see effective giving being so very back.
Also good to see 🔷 catching better metrics. I'd seen quite a lot of prior anecdotal evidence of it appearing significantly undervalued - many of the most engaged effective givers I know were 🔷 initially, which really didn't track with the very low value attributions given previously.
Vasco Grilo🔸 @ 2026-06-30T19:33 (+7)
Hi Aidan. Thanks for the update. This looks like a great analysis, as did the ones for 2020-2022, and 2023-2024.
We note that our multiplier will face pressure from the denominator in coming years. Our 2026 budget of
2.1M, reflecting planned investments in growth. Maintaining or improving our multiplier will require continued growth in the value we generate — through both new pledge acquisition and the realised donations of existing pledgers. We view the 2025 result as an encouraging signal that our strategy is producing returns, but sustaining this as we scale will require ongoing attention to both the volume and quality of our pledge work.
The increased spending in 2026 will be useful to get a better sense of the marginal multiplier. The multiplier on the total spending over 2026 being significantly lower than 7 (the multiplier on the total spending over 2025) would signal a marginal multiplier in 2026 significantly lower than 7.
Aidan Whitfield🔸 @ 2026-07-02T08:49 (+4)
Thanks Vasco! I think you are right that we should get a better sense of the marginal multiplier by seeing how the multiplier responds to investments we are making over the next few years. That said, I agree with @GV 🔸 that we might expect some lag between the investments and the returns - particularly for more 'top-of-funnel' work. As a result, our 2026 multiplier might not fully capture the impact of our investments.
Vasco Grilo🔸 @ 2026-07-02T11:32 (+2)
Thanks for the relevant nuance, @GV 🔸. The 2026 multiplier would ideally account for the donations of pledges made after 2026 as a result of work in 2026, but this may be difficult to model. It will probably be easier in the future when there is more data on how "top-of-funnel" work translates into future pledges.
GV 🔸 @ 2026-07-02T07:28 (+4)
Agreed! One nuance though: I'm not familiar with the "time-to-results" that we can expect from such investments, but it seems plausible to me that it takes >1 year for them to deliver. So, results could potentially not show up before the 2028 report.
Bentham's Bulldog @ 2026-07-02T17:20 (+3)
Awesome!