GiveWell’s money moved and web traffic in 2018
By GiveWell @ 2019-09-10T02:17 (+22)
GiveWell is dedicated to finding outstanding giving opportunities and publishing the full details of our analysis. In addition to evaluations of other charities, we publish substantial evaluation of our own work. This post lays out highlights from our 2018 metrics report, which reviews what we know about how our research impacted donors. Please note:
- We report on “metrics years” that run from February through January; for example, our 2018 data cover February 1, 2018 through January 31, 2019.
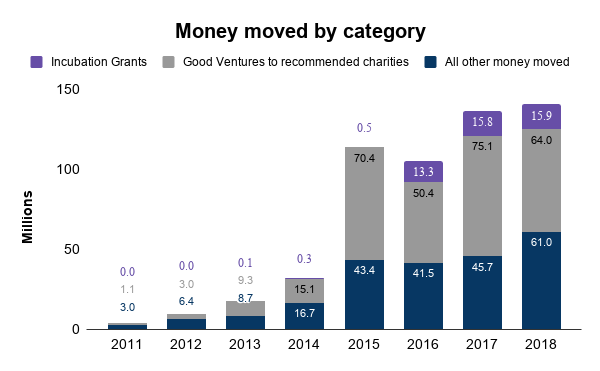
- In an effort to present a more comprehensive measure of our influence on charitable giving, this year’s metrics report includes GiveWell Incubation Grants in our headline “money moved” figure. In previous reports we have excluded Incubation Grants from this figure.
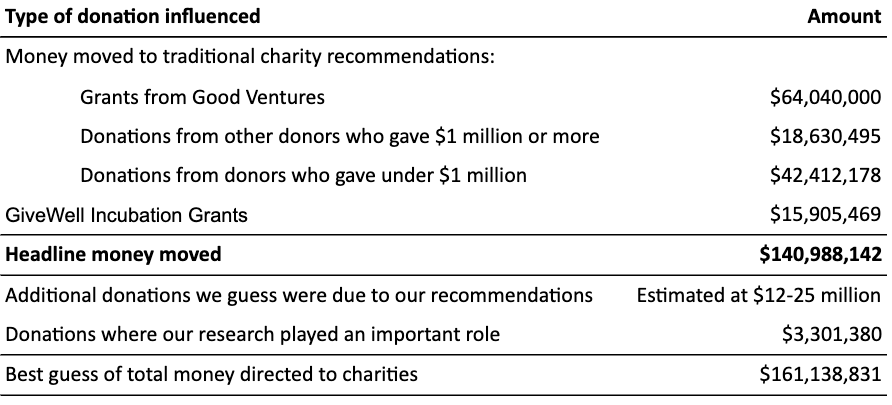
Summary of influence: In 2018, GiveWell influenced charitable giving in several ways. The following table summarizes our understanding of this influence:

Headline money moved: In 2018, we tracked $141 million in money moved to our recommended charities and via our Incubation Grants program. Our money moved only includes donations that we are confident were influenced by our recommendations.

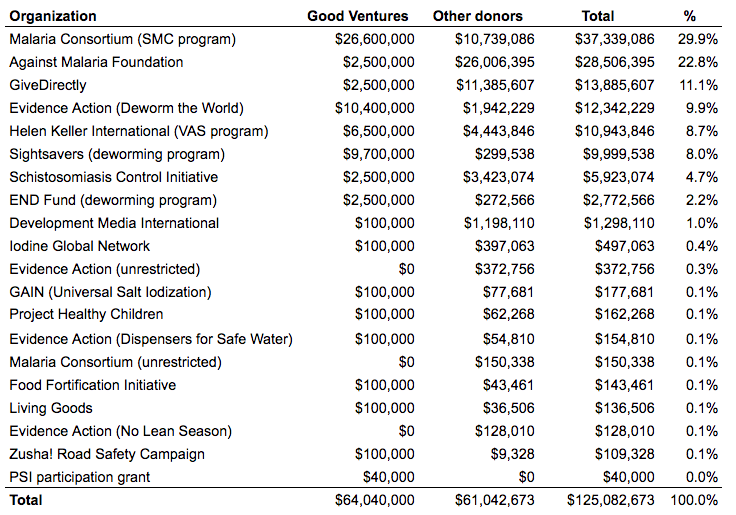
Money moved by charity: Our nine top charities, including Evidence Action’s No Lean Season which is no longer a top charity, received the majority of our money moved. Our eight standout charities received a total of $2.7 million. We also tracked $0.5 million in unrestricted donations to organizations that run programs we recommend and $15.9 million in Incubation Grants.

Money moved by size of donor: We have less reliable data on individual donors in 2018 than in previous years, primarily as a result of new European privacy regulations that have led some of our recommended charities to share less detailed data with us. We have estimated the number of donors in each size category we track. We estimate that the number of donors in most categories was roughly unchanged compared to 2017 and that the amount of money in most categories increased slightly. Notably, we saw a large increase in the amount donated from donors giving $1 million or more. In 2018, we estimate that 92% of our money moved (excluding Good Ventures) came from the 20% of our donors who gave $1,000 or more. Details on how we produced these estimates are available in the full report.
_2018.png)
GiveWell’s expenses: GiveWell’s total operating expenses in 2018 were $4.3 million.
Donations supporting GiveWell’s operations: GiveWell raised $12.4 million in unrestricted funding (which we mostly use to support our operations) in 2018, compared to $5.7 million in 2017. The eleven largest individual donors, plus Good Ventures, contributed 67% of GiveWell’s operational funding in 2018.
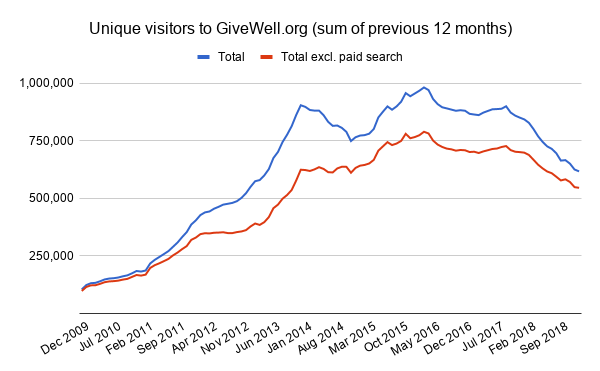
Web traffic: The number of unique visitors to our website declined 22% in 2018 compared to 2017 (when excluding visitors driven by AdWords, Google’s online advertising product).

For more detail, see our full metrics report (PDF).