A Study of EA Orgs’ Social Media
By Stan Pinsent @ 2023-01-09T09:59 (+86)
Summary
I collected data on the social media accounts of 79 EA-related organisations. Key findings:
- Orgs have far more followers on Facebook and Twitter than on Instagram. Facebook accounts typically have more followers than Twitter accounts, but this varies between cause areas
- A number of Longtermism- and Infrastructure-focused orgs have stepped away from social media since 2021
- On Facebook, posting regularly correlates weakly with having a larger following
- Overall, it appears that EA-aligned organisations should consider their cause area within EA when forming a social media strategy
Methodology
I checked the Facebook, Twitter and Instagram accounts of each of the orgs on this list of EA-related organisations and collected data on 1) the number of days since last posting and 2) the number of followers. See the footnotes for details on methodology[1] and limitations[2] [Footnotes are included in the main text because the forum is being glitchy].
You can find the full dataset here.
Data Overview
- 87% of the 79 organisations surveyed have an account on either Facebook, Twitter or Instagram
- Of the organisations on social media, only 58% had been active in the past week
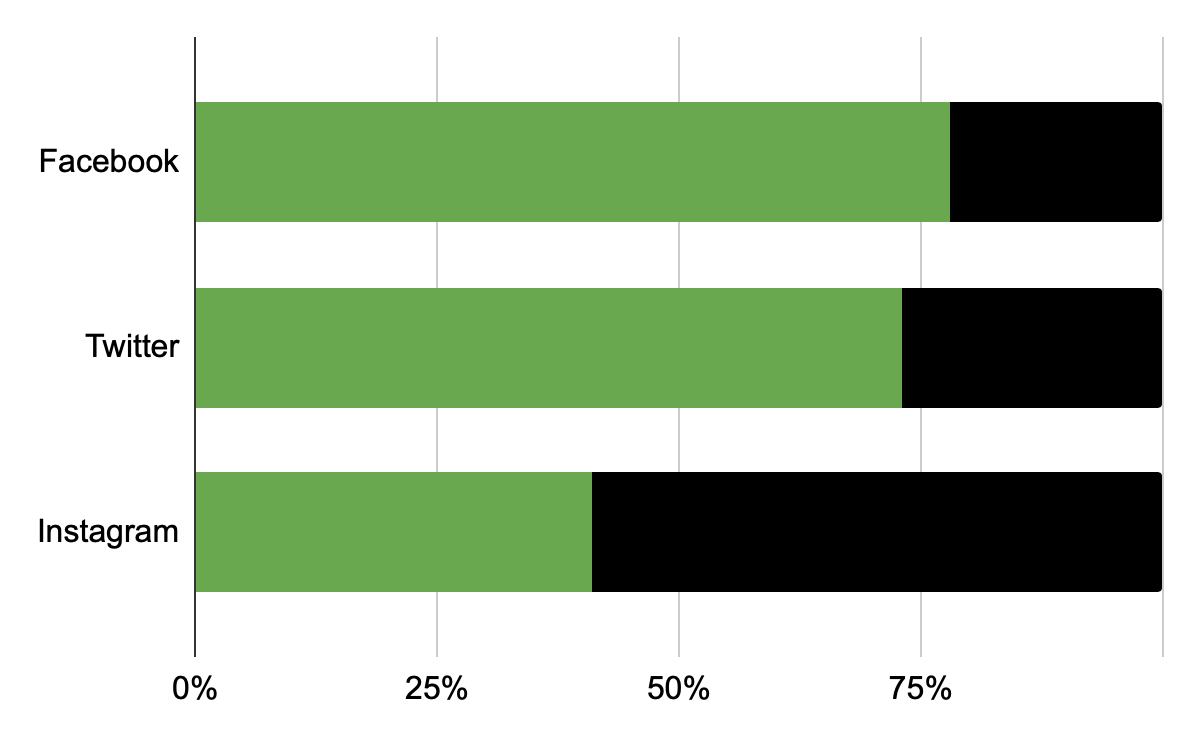
- Most of the organisations use Facebook and Twitter and less than half of them use Instagram:
There was a good spread of cause areas in the survey:
| Cause area | Number of organisations |
| Animal Advocacy | 12 |
| Longtermism | 15 |
| Global Health & Poverty | 18 |
| Infrastructure | 24 |
| Other | 10 |
| Total | 79 |
Orgs to Watch
A number of the organisations stood out for their aptitude on social media. Below are “ten organisations to watch”, with links to their respective accounts:
| Org | Cause area | Links | Reasons to watch | ||
| The Humane League | Animal Advocacy | Regular posts and diverse content. Strong on all platforms | |||
| Animal Ethics | Facebook powerhouse. Diverse Instagram content, cross-channel promotion | ||||
| Future of Life Institute | Longtermism | Harnessing clips and quotes from their podcast, highly active on all platforms | |||
| Sightsavers | Global Health & Poverty | 40,000 tweets and counting | |||
| GiveDirectly | Putting a human face on their work on Instagram | ||||
| Abdul Latif Jameel Poverty Action Lab | Regular, diverse Twitter content | ||||
| Evidence Action | Engaging visuals with every post | ||||
| 80,000 Hours | Infrastructure | Longer, regular but infrequent Facebook posts | |||
| High Impact Athletes | Eyeball-grabbing visuals on Instagram | ||||
| Our World in Data | Other | Making data sing on Instagram | |||
Follower Data
Facebook or Twitter? It depends on the cause area.
65% of organisations had more followers on Facebook than on Twitter. Comparing the median value of Facebook followers per Twitter follower within each cause area, we see significant variation (with the caveat that sample sizes are small).
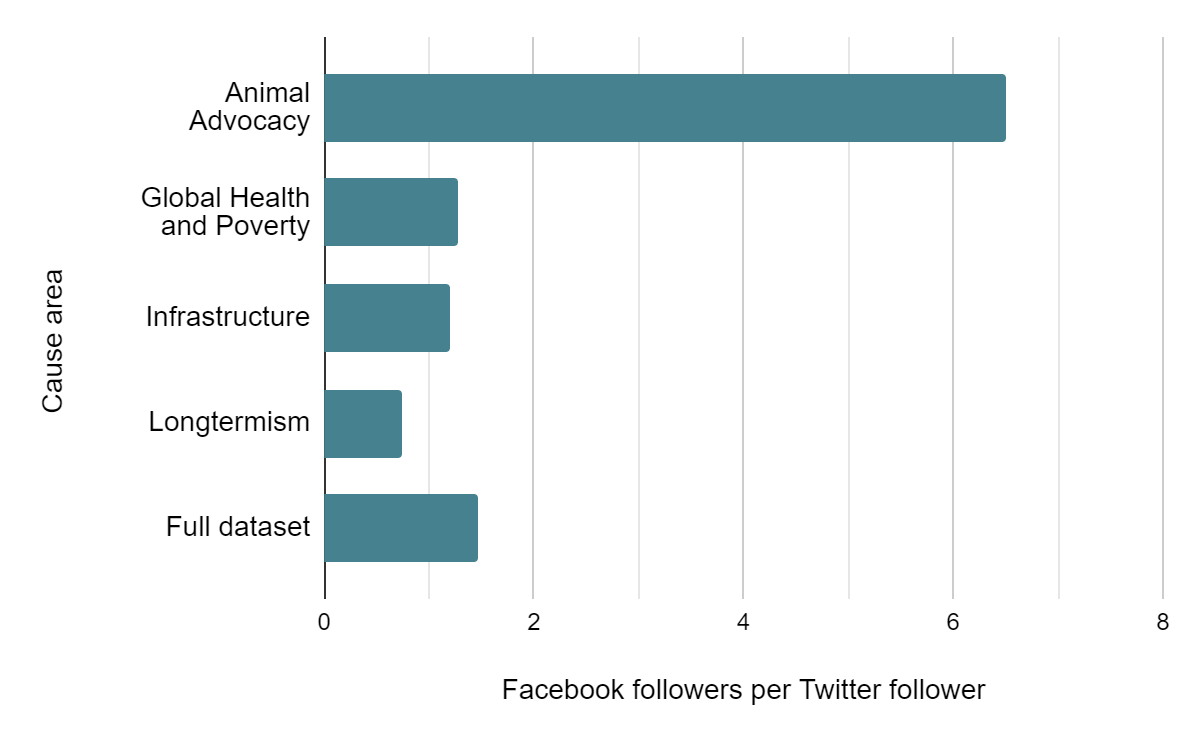
It appears that cause area has a strong correlation with which platform an organisation does best in: all Animal Advocacy orgs had more Facebook followers than Twitter followers, while 5 of 8 Longtermist orgs had the opposite trend.
Why such a difference between the cause areas? I have a few suggestions:
- Anecdotally, Facebook is better than Twitter for harnessing broad audiences with shared interests. Animal Advocacy orgs may have been able to snare the audiences of big groups like Greenpeace and the WWF (3.1M and 3.6M Facebook followers respectively). The other cause areas don’t have such big peers to poach from (Oxfam has 1.1M followers, and Longtermism barely exists beyond EA)
- It seems plausible that Twitter is simply more popular among Effective Altruists. This would explain why the Animal Advocacy movement, within which EAs are a minority, is an exception here (although EAs are also a minority in Global Health & Poverty)
- Some Longtermist and Infrastructure orgs have stopped using Facebook since 2021 and hence can expect to be weaker on the platform (see next subsection)
- Demographics. Twitter is more male than Facebook, and Longtermism is probably more male than than the other cause areas
I do not take the demographics argument too seriously, however: there is far more variation within cause areas than can be explained by age or gender or random variation. Take a look at the four “most followed” animal advocacy organisations:
Organisation | Facebook followers per Twitter follower |
| The Good Food Institute | 4.2 |
| Faunalytics | 6.5 |
| The Humane League | 17 |
| Animal Ethics | 55 |
The Facebook:Twitter ratio varies by a full order of magnitude!
What can we learn here?
- If there are organisations in your field with giant followings, Facebook may be the best platform to build a following on (research needed on this)
- I would tentatively suggest that the “more EA” your expected audience is, the more highly you should value Twitter.
- Learn from the best: check out the “ten organisations to watch” above
Some Longtermist & Infrastructure orgs are stepping away from social media
Below are shown orgs with a strong following that have not posted on Facebook for 90 days or more.
Organisation | Cause Area | Days since last FB post | Days since last Twitter post | Tweeting regularly? |
| Founders Pledge | Infrastructure | 120 | 3 | yes |
| Machine Intelligence Research Institute (MIRI) | Longtermism | 180 | 11 | no |
| Centre for Effective Altruism (CEA) | Infrastructure | 180 | 60 | no |
| Centre on Long-term Risk (CLR) | Longtermism | 630 | 600 | no |
| Future of Humanity Institute (FHI) | Longtermism | 690 | 60 | no |
These orgs appear to have consciously stopped using Facebook, and most no longer systematically use Twitter either.
Why? I have a few ideas:
- Orgs may be concerned that social media communicates a crude message. CEA have written about the "Fidelity Model" of communication, concluding that the dangers of low-fidelity channels may outweigh the benefits. [@Alishaandomeda gives a good counter argument to this conclusion, as does @Arepo, who indicates that CEA now plans to have more active involvement with the media]
- The above may be especially relevant for Longtermist orgs, whose research is rife with infohazards and easily misrepresented.
- Some Longtermist and EA Infrastructure orgs have secured funding through billionaires and regranting programmes. They don't need individual donors and thus have less incentive to build a mass following
The funding situation may have changed with the collapse of FTX, however: CLR admitted to a funding crisis in a recent appeal for donations - an appeal that will likely reach fewer people than if they had invested in building their audience.
Follower numbers are much lower for Instagram, but a few orgs are making the most of the platform
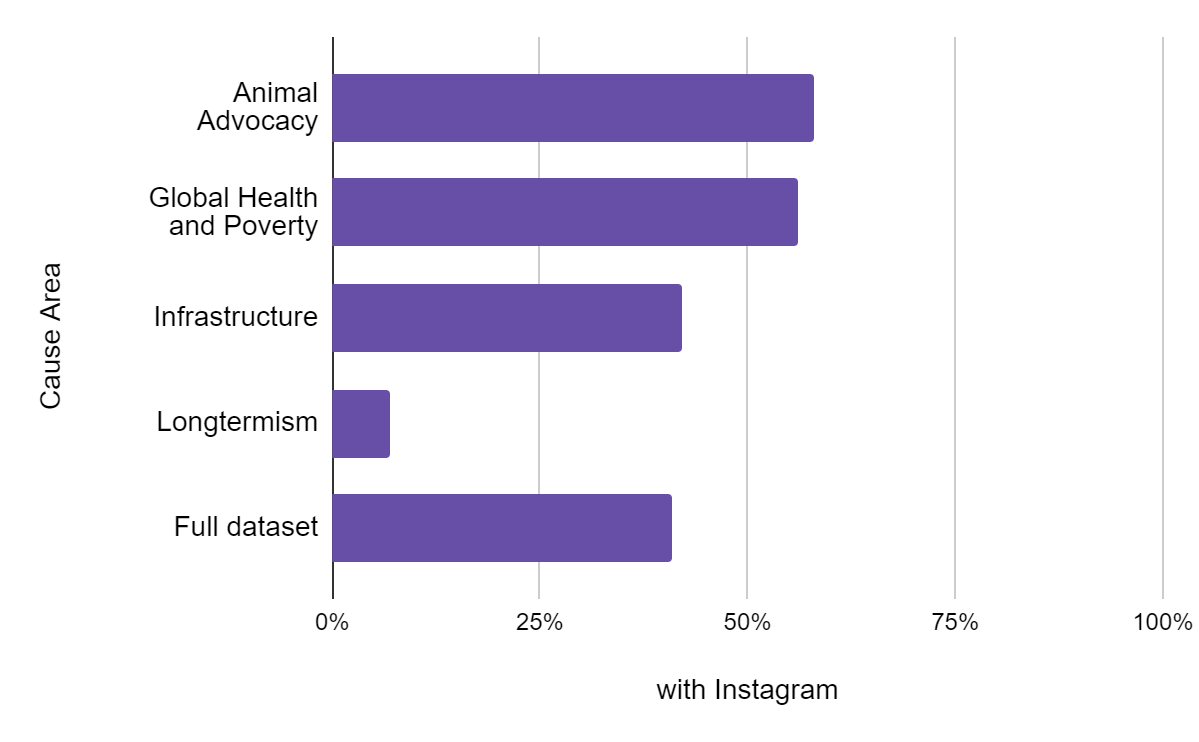
Most of the orgs on the list had Facebook and Twitter, but fewer than half had Instagram:
Animal Advocacy and Global Health & Poverty orgs were much more likely to be on Instagram, while only one of the Longtermist orgs was on the platform:
Organisations can be justified in feeling they have less to gain from Instagram: on average, orgs had 7.7 Facebook followers for each Instagram follower[3].
Why the difference between cause areas?
- Global Health and Poverty organisations are more likely to have large followings (>10k), so have more to gain from running an Instagram account
- Animal Advocacy and Global Health and Poverty organisations have more savvy competitors (like Greenpeace and Oxfam) and hence may feel a need to be on Instagram in order to keep up
- Animal Advocacy and Global Health and Poverty lend themselves more naturally to visual content, while AI alignment or EA infrastructure can be difficult to turn into engaging images.
There are, however, a few orgs that are making the most of Instagram. Go back to the “ten organisations to watch” above.
EA-Related social media is dominated by a few top brands (a trend that is strongest within Animal Advocacy)
In terms of follower count (total followers across the three platforms), each cause area is dominated by its top organisations. The table shows the follower count of the top 3 orgs in each cause area as a percentage of the total follower count for all orgs in the cause area.
| Cause area | % of followings attributable to top 3 orgs |
| Animal Advocacy | 96% |
| Global Health & Poverty | 55% |
| Infrastructure | 56% |
| Longtermism | 78% |
What can we learn from this?
- If you are an Animal Advocacy organisation looking for exposure, a mention or retweet from one of the top accounts in your field (The Humane League, Animal Ethics and The Good Food Institute) could be gold dust
- The same is true to a lesser extent for Longtermist orgs (look to Future of Life Institute, Machine Intelligence Research Institute and Future of Humanity Institute)
- In all cause areas the top 3 organisations are capturing more than half of the followings of the field. This is an “80/20” situation in which a small group of orgs wield most of the social media influence.
Regular posting is correlated with number of followers
Using "days since last post" as a proxy for regularity of posts, there is moderate correlation with following size (this part of the analysis uses Facebook data only).
Using the full dataset gives an Pearson correlation coefficient of -0.39 (with both axes logarithmic)[4].
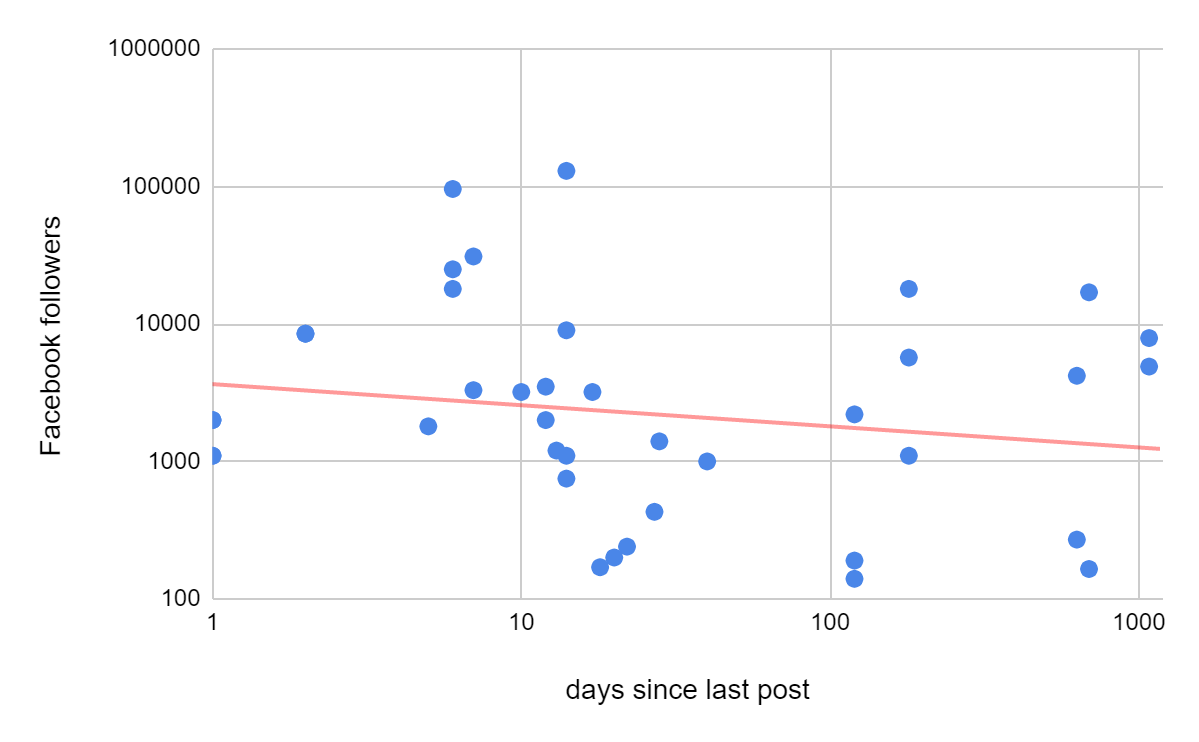
When we remove orgs that have not posted in the last 2 months the strength of correlation increases, with a Pearson value of -0.52. The gradient of the trendline becomes much steeper (see chart below). 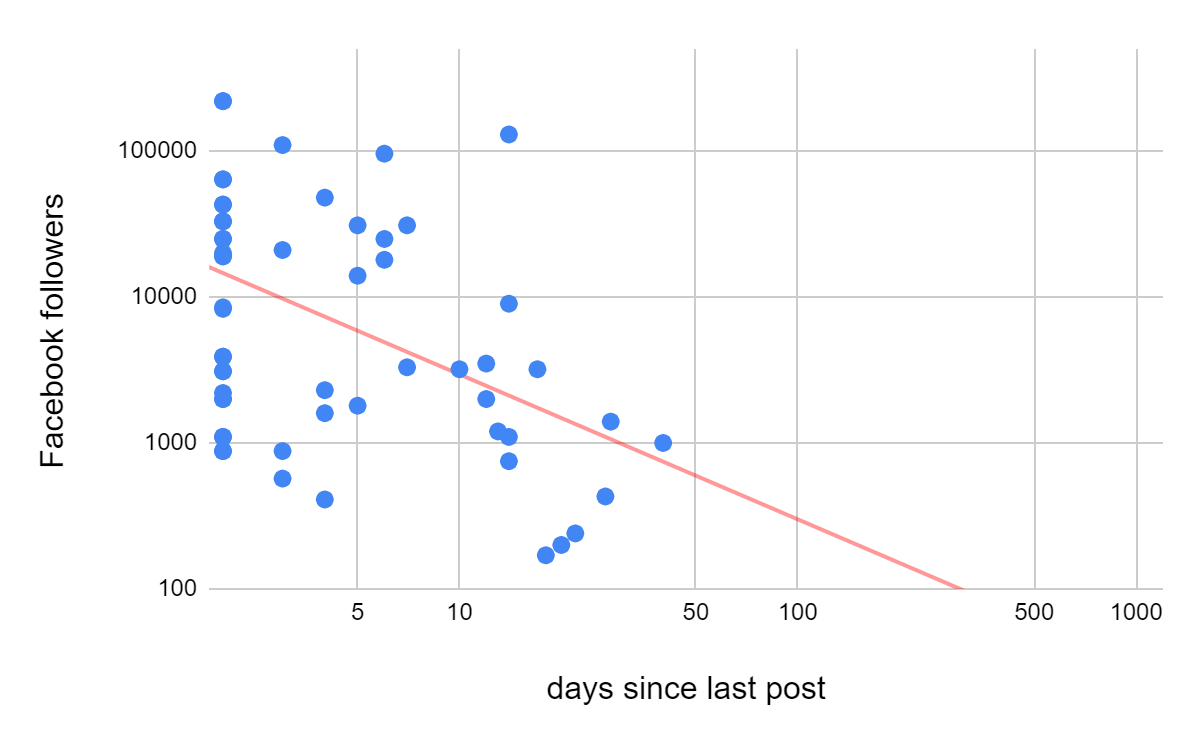
I think this chart better reflects the relationship between regularity of posts and size of following. Those organisations which have stepped away from Facebook (having built a following back when they were posting regularly) were clouding the picture.
What can we learn here? Not much. The data cannot prove the direction of causation, but it probably goes both ways: orgs with a large following have more incentive to harness their audience by posting regularly; orgs that post regularly will attract more followers. My advice to orgs would be:
- Posting regularly can be a way to grow your following, but
- Growing your following is not an end in itself. You should have a clear idea of what you want to do with your following. What message do you want to give them? What actions do you want them to take?
- Both 1) and 2) should inform what you post, and how regularly
Areas for Further Study
Sifting through the data has given me a few ideas for hypotheses, although this dataset is not able to support them. These hypotheses could be useful in informing future research:
- Hypothesis 1 - The social media engagement of EA-related orgs fits into three broad categories:
- Conscious engagement: planning and executing a strategy to get the most from social media platforms
- Conscious disengagement: deciding not to use social media because the risks and costs are deemed to outweigh the benefits
- Unconscious disengagement: personal aversion to social media or a lack of bandwidth leads to sporadic and ineffective engagement with the platforms
- Hypothesis 2 - Facebook engagement is declining, especially among younger people, and hence official accounts on the platform will be of diminishing value to EA orgs in the years ahead (although it may be that as Pages are becoming less powerful, Groups are becoming more so).
Acknowledgements
Thanks to @Alishaandomeda for providing useful feedback.
Footnotes
[Included in the main text because the Forum is being glitchy]
[1] Methodology:
- I did not include the 6 orgs from the list that appear to be no longer operational
- Days since last post was measured from 1500 UTC on 12 December 2022 and the age of posts more than 2 months old was rounded to the nearest 30 days
- Number of followers was recorded to 2 significant figures and checked on 23 December 2022.
[2] Limitations:
- The list of EA-related orgs dates from October 2020, so a number of newer orgs have been left out. It seems plausible that the newer orgs missed by the list would be more active on social media and have smaller followings than the ones included in this study. Given the declining importance of Facebook in the social media landscape, it also seems plausible that newer orgs will place less emphasis on Facebook engagement, and that this study might exaggerate the importance of Facebook.
- The study only examines Facebook, Twitter and Instagram usage at a fixed moment in time. It does not extend to:
- Engagement over time. For example, a repeat study in the future could track changes in followings and examine how closely this is correlated with regularity of posting
- Other social media platforms like Linkedin and Youtube.
- Asking orgs about their social media strategy. It would be interesting to reach out to orgs, especially those stepping away from social media, to ask them to explain their social media strategy
- The effect of paid promotions
[3] Of the 29 organisations with both Facebook and Instagram accounts, the median “Facebook followers per Instagram followers” score was 7.7
[4] Correlation: The correlation was weaker when the scales were not logarithmic, or when only one of them was.
Chart: Orgs with a post 0 days ago are not visible on the charts, but are included in the R² values.
GraceAdams @ 2023-01-09T21:45 (+12)
I'd be interested to see what you think of Giving What We Can's social media presence!
(I am Head of Marketing and produce most of the social media posts and content promoted via our social media. This is not a large focus of my role but something I am happy to receive feedback on.)
Stan Pinsent @ 2023-01-12T15:35 (+2)
I have sent some feedback via email. Thanks!
Sunnie Huang @ 2023-01-10T21:26 (+5)
Hi Stan, I manage Giving Green's social-media accounts. Really appreciate your analyses here and fascinating to see what works for other orgs. I'd love to see how these trends change, if it's not too much work to repeat!
I'm in the process of analysing our social data from the past giving season. Happy to share what I discover and compare notes. I'm at sunnie.huang@idinsight.org
Stan Pinsent @ 2023-01-12T15:35 (+1)
Yes please! I have sent an email.
Adam Steinberg @ 2023-02-14T09:56 (+3)
Would love to see a similar analysis for LinkedIn, for example. There are a decent list of groups, from 80K to GWWC, Founders Pledge to the project I work with, GWWC Charity Elections, that aim to target people as professionals, or in specific professions or professional contexts. It would be instructive to see what success EA has had engaging audiences through that platform, and how.
Lin BL @ 2023-01-11T01:14 (+1)
The data I would be most interested to see (if you plan to do further research on this) is of when people started following the page (rather than overall numbers of followers). I believe you mentioned this briefly in the limitations footnote.
A lot of people follow a lot of pages, and may have followed something years ago. If their interests change, but the page doesn't post, it seems relatively unlikely that someone will go out of their way to unfollow it. Perhaps they've even forgotten that they've followed it to begin with!
That was my first thought (intuition, no evidence) when you mentioned that the correlation between followers and date since last post was steeper when organisations that have not posted in the last 2 months were removed, i.e. this cuts out the 'followed this years ago and forgot, no new posts to remind me' followers.
Stan Pinsent @ 2023-01-12T15:44 (+3)
I would love to do that. Maybe I'll learn more data stuff, because I want to be able to scrub data so I can get more of it, faster. Any idea if that sort of data is even public?
I agree with you on engagement. It would be good to get better data on that, because number of followers is probably quite a poor proxy for engagement. Numbers of views, likes and comments are probably far better.