Q2 AI Benchmark Results: Pros Maintain Clear Lead
By Benjamin Wilson 🔸, johnbash, Metaculus @ 2025-10-28T05:13 (+55)
This is a linkpost to https://www.metaculus.com/notebooks/40456/q2-ai-benchmark-results/
Main Takeaways
Top Findings
- Pro forecasters significantly outperform bots: Our team of 10 Metaculus Pro Forecasters demonstrated superior performance compared to the top-10 bot team, with strong statistical significance (p = 0.00001) based on a one-sided t-test on Peer scores.
- The bot team did not improve significantly in Q2 relative to the human Pro team: The bot team’s head-to-head score against Pros was -11.3 in Q3 2024 (95% CI: [-21.8, -0.7]), then -8.9 in Q4 2024 (95% CI: [-18.8, 1]), then -17.7 in Q1 2025 (95% CI: [-28.3, -7.0]), and now -20.03 [-28.63, -11.41] with no clear trend emerging. (Reminder: a lower head-to-head score indicates worse relative accuracy. A score of 0 corresponds to equal accuracy.)
Other Takeaways
- This quarter’s winning bot is open-source: Q2 Winner Panshul has very generously made his bot open-source. The bot writes separate “outside view” and “inside view” reports, using a 6-7 step agentic approach, with Serper to run Searches and BrightData.com to scrape HTML. It then runs five final predictions using sonnet 3.7 twice (later sonnet 4), o4-mini twice, and o3 once.
- The best model was OpenAI’s o3: Metaculus ran many bots that used the same prompt but different LLMs. The one using OpenAI’s o3 finished first among these, and 2nd overall in the tournament.
- Models matter more than prompts: Metaculus’s simple in-house Metac Bots have continued to perform well. The Metac Bots that use the most up-to-date models have continually ranked in the top 6 in the last 4 quarters, and the best one placed 2nd this quarter. This implies that the most important factor for AI forecasting is the underlying model, more than scaffolding. These bots do a single internet search, run a simple prompt, forecast 5 times with that prompt, and submit an aggregation of these forecasts.
- Students and hobbyists performed well: Excluding Metaculus’s in-house Metac Bots, the top 3 bot-makers were hobbyists or students. Notably, they came just ahead of the startups and other commercial entities that competed.
- Aggregation and iteration are key: Based on the results of our bot maker survey, best practices include aggregating multiple forecasts and manually reviewing the bot’s reasoning on past questions to improve prompts and scaffolding for the next questions.
Introduction
In the second quarter of 2025, we ran the fourth tournament in our AI Benchmarking Series, which aims to assess how the best AI forecasting bots compare to the best humans on real-world forecasting questions, like those found on Metaculus. Over the quarter, 54 bot-makers competed for $30,000 by forecasting 348 questions. Additionally, a team of ten Pro Forecasters forecasted 96 of those 348 questions to establish a top human benchmark. Questions spanned many topics, including technology, politics, economics, the environment, and society. They covered different types of outcomes: Binary (“Yes”/”No”), Numeric (e.g., “$4.6M”, “200 measles cases”, etc.), and Multiple Choice (e.g., “Max Verstappen”, “AAPL”, etc.). See a full overview of Metaculus’s AI forecasting benchmark at the tournament home page and resource page.
Methodology
In order to test how well bots are doing relative to each other and relative to humans, we set up a forecasting tournament for bots and one for Pros. The Pro forecasts were hidden from bots to prevent them from being copied by bots. Each tournament launched a series of questions that were resolved sometime during the quarter, and asked participants to assign probabilities to outcomes. We then used our established scoring rule to evaluate participants. During the analysis, we aggregate the predictions of groups of forecasters to create ‘teams’.
Data Collection:
- Bot Tournament: 54 bot makers and 42 in-house Metac Bots (running different LLM models) participated in a tournament of 348 questions that were not annulled. Each week, we launched a set of ~50 questions, one at a time, every 2 hours. These questions stayed open for 2 hours, then closed before the next one launched. This ensured forecasting occurred at all times during the day (including night hours). Bots submitted their forecasts using our API. The tournament consisted of binary (58%), numeric (21%), and multiple-choice (21%) questions. Questions spanned an extensive range of topics, including geopolitics, economics, elections, sports, tech, etc. Botmakers were allowed to update their bots over time (e.g., incorporate a newer model, or iterate on prompts), but metac-bots stayed the same over the full quarter. More binary questions were resolved “No” (80%) than “Yes” (20%). This is common in the forecasting field; for example, 70% of Metaculus’s main feed questions resolve to “No.”
- Pro Tournament: 10 Pro forecasters predicted 96 (plus 4 that were annulled). Three of those had match-over problems, leaving 93 scorable questions with direct comparisons between bots and Pros. Metaculus selects Pro Forecasters for their excellent forecasting track record and their history of clearly describing their rationales. Pro questions were randomly sampled from each week’s bot questions (with some constraints to space out schedules). Pros had 2 days to forecast each question before it closed. The Pro tournament was private and hidden throughout the tournament, which prevented bots from copying the Pros’ forecasts. Pros, however, could see each other’s forecasts and could communicate in the comment section of each question.
- Metac Bots: Metaculus ran 42 in-house Metac Bots. Each used the same prompt but used a different LLM to forecast, and occasionally a different method for doing research. In general, these bots do an internet search, run a ~30-line prompt, forecast 5 times with that prompt, and submit an aggregation of these forecasts. Each bot’s name indicates which model and research provider it used. For instance, “metac-gpt-4o+asknews” uses GPT-4o as a model and AskNews as a research source.
Scoring: For a deeper understanding of scoring, we recommend reading our scoring FAQ. We primarily use spot peer scores and head-to-head scores in this analysis.
- Peer Score: The Peer score compares the relative performance of a forecaster (or team) vs. all others on a question, over the whole question lifetime. Unlike Baseline or Brier scores, it adjusts for the difficulty of a question based on the performance of others. The score is zero-sum (i.e., the sum of all participants’ peer scores is 0). A higher score indicates greater relative accuracy. A score of 0 corresponds to average accuracy. For reference, the average Peer score for the Metaculus Community Prediction (a recency-weighted median of all forecasters) is 12.9. The community prediction has ranked in the top 10 on the global site leaderboard over every 2-year period since 2016. So, a score of 12.9 is a very good peer score when competing against Metaculus users. This is a decent comparison point for the AI tournament. However, it's worth noting that the bots are not “the average Metaculus user” and a good score in the AI tournament is different than on the actual site due to the skill level of competitors.
- Spot Peer Score: Spot Peer scores are the same as peer scores, except evaluated only at a single point in time, using the forecasters’ standing predictions at that time (rather than averaging scores over the question lifetime). On the main Metaculus site, spot peer scores are often evaluated when the community prediction is revealed to participants. For the bot and Pro tournaments, Spot Peer scores were evaluated when questions closed.
- Head-to-Head Score: Head-to-head scores are the same as spot peer scores, except they compare only two participants. For example, if comparing the bot team and Pro team, the head-to-head score is (for a question that resolves Yes).
- Weights: Some bot questions were given weights in order to counteract possible correlated resolutions between questions. This doesn’t apply to pro/quarterly cup questions, which all have a weight of 1. If you see below a score for a bot tournament question, then that score has been multiplied by a weight between 0 and 1 inclusive.
Team selection and aggregation: In the analyses below, we sometimes aggregate a group of forecasters to create a “team”. To aggregate predictions, we take the median for binary predictions, the normalized median for multiple choice predictions, and an average (aka mixture of distributions) for numeric predictions. This is the same as the default aggregation method for the Community Prediction shown on Metaculus, except the Community Prediction also weighs predictions by recency. Note that occasionally a member of a team misses a question, and thus is not included in the team aggregate prediction for that question. Below is how the compositions of the teams were decided:
- Bot Team: We took the 348 tournament questions, then removed the 93 questions that were also asked to the pros, to get 255 bot-only questions. We compute the bots’ Spot Peer Scores on these questions, and rank the bots in a leaderboard by the sum of their scores. The top 10 bots from this leaderboard are our bot team. We exclude the Pro questions to avoid look-ahead bias in the Pro-bot comparison. By using the bot-only questions to determine the team, we effectively run a “qualification tournament” to choose bot team members (similar to how the pros were chosen based on their performance on past tournaments).
- Pro Team: The Pro team includes all 10 pros who participated in the Pro tournament.
Miscellaneous notes on Data Collection:
- Very bad numeric forecasts can be rejected: Numeric questions have an upper and lower bound that forecasters on the site are generally expected to forecast within. To ensure numerical stability (and non-astronomically-negative scores), our API rejects predictions that put no or very little probability mass in bounds. This quarter, the prompt used for Metaculus’s in-house Metac Bots did not include a mention of what the upper and lower bounds are. Occasionally, some “Metac Bots” would forecast out of bounds in this way (especially those running lower-quality models), and it is expected that some participants encountered this error as well. Our forecasting user interface does not let humans make forecasts that bad either, so in this sense, they’re on equal footing, but it does mean that bots are not punished for their very worst numeric forecasts (we’ll see that they still largely underperform humans on numeric questions anyway).
- o3-mini and o3-mini-high ran on the same account: By mistake, the in-house Metac Bots running o3-mini and o3-mini-high were both using the same account on the site (i.e., o3-mini-high’s account). We suspect that since o3-mini-high takes longer to forecast, o3-mini-high made the last forecast on each question. Thus, this account most likely represents o3-mini-high’s forecasts generally. However, we aren’t able to confirm this easily.
- Other small data anomalies: 1) Each metac bot missed some questions on the site due to various factors like provider outages, poorly formatted responses, etc. 2) There was a bug in the multiple choice parsing code that a large percentage of competitors and metac-bots were using. We relaunched the 8 affected questions. 3) For Metac Bots that did not use AskNews and instead used a research-enabled LLM to get their research report (e.g., Perplexity), the full question JSON was passed to the research LLM’s prompt. In previous quarters, only the question text was passed to the prompt.
This analysis generally follows the methodology we laid out at the beginning of the tournament series, but now uses a simplified bot team selection algorithm we started using in Q1 (as described above).
How do LLMs Compare?
To compare the capabilities of different LLM models, Metaculus ran 42 bots, all with the same prompt. This prompt has stayed generally the same over all four quarterly benchmarks. There were some minor updates to the prompt in Q1 to support numeric and multiple-choice questions. See the section on code/data for links to the template bot code and prompts.
Using the results from the benchmark, we simulated a tournament where these bots competed only against each other (no other participants). This tournament took all the questions from the bot tournament and removed the forecasts of non-metac-bot participants. The bots’ spot peer scores and 95% CI against each other are shown below. The first graph shows the top 12 bots, while the second is zoomed out to show all participants.
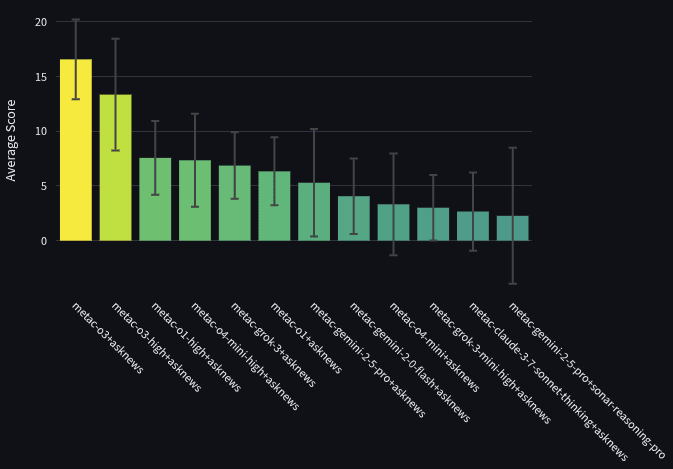
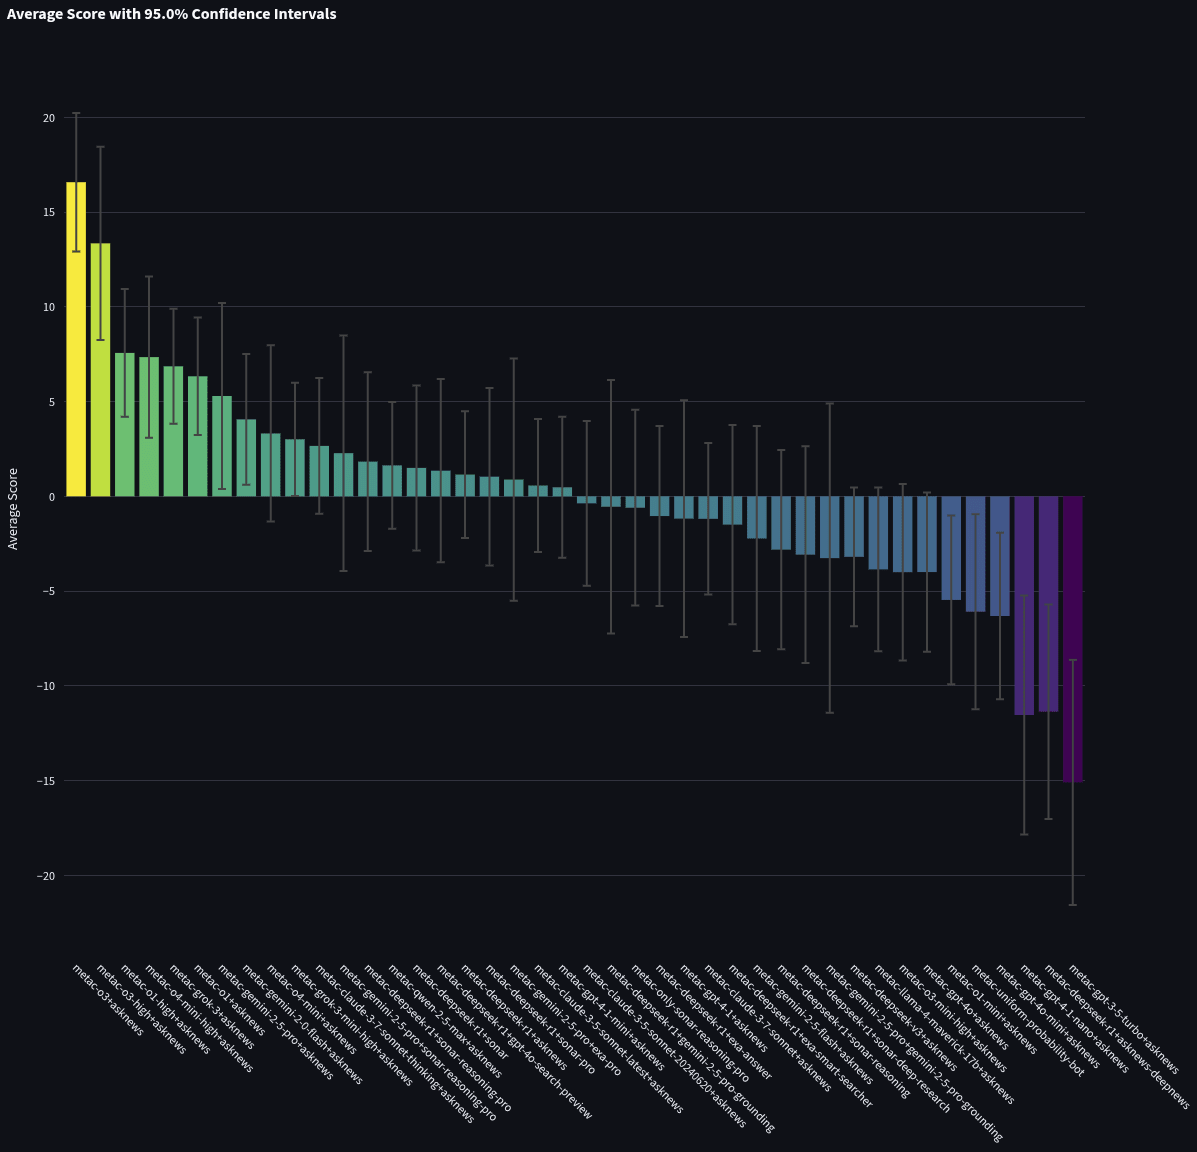
Each bot’s name indicates which model and research provider were used. For instance, metac-gpt-4o+asknews uses GPT-4o as a model and AskNews as a research source. You can see code for each model in the “Code and Data” section of this piece.
- OpenAI’s o3 is the best model: The bot powered by o3 significantly outperformed even the next best non-o3 model. It’s possible that the prompt worked better for o3 than other models, but some of our other research shows that prompt engineering has less of an impact with stronger models.
- Cost-effectiveness goes to o4-mini and DeepSeek-R1: The most cost-effective models would be o4-mini-high and DeepSeek-R1.
- Best search is uncertain: We benchmarked different search providers with both Gemini-2.5-Pro and DeepSeek-R1. Only a few variations were tested with Gemini-2.5-Pro, and more were tested with DeepSeek-R1. The best search model for Gemini-2.5-Pro was AskNews, with Perplexity’s Sonar-Reasoning-Pro in second. The best search model for DeepSeekR1 was Perplexity’s Sonar-Reasoning-Pro with Perplexity’s Sonar in second and AskNews in third. Most of these bots have score error bars that overlap a lot, so we can’t say much about which model is best.
- Thinking is a mixed bag: It seems that adding more reasoning tokens sometimes helps forecasting and sometimes does not. In favor of thinking, o1 with reasoning set to “high” did better than regular o1. Sonnet 3.7 also did better with thinking than without. However, OpenAI’s o3 with reasoning set to “high” did worse than regular o3.
Which Bot Strategy is Best?
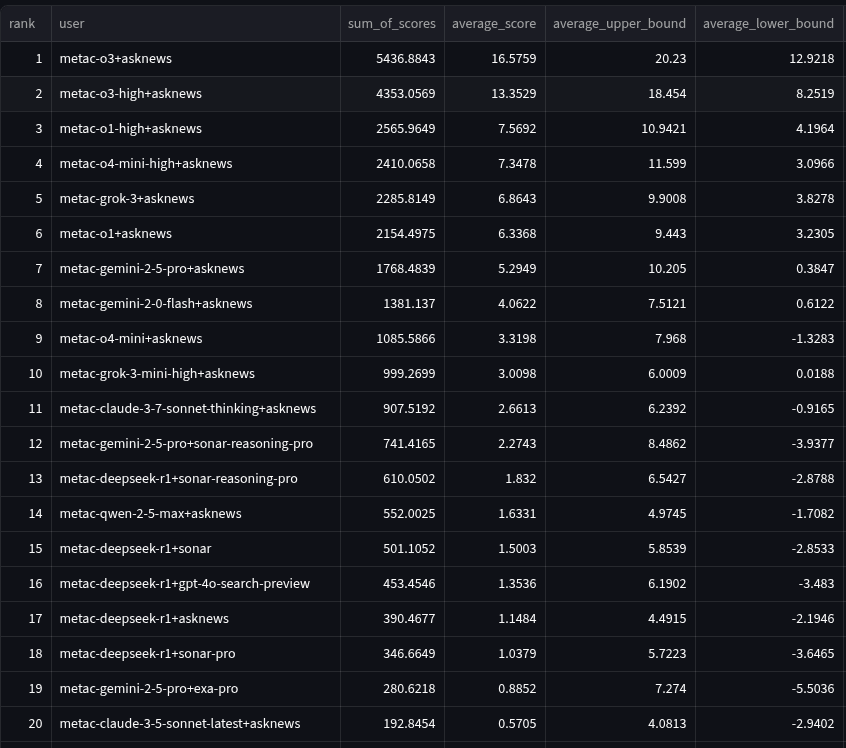
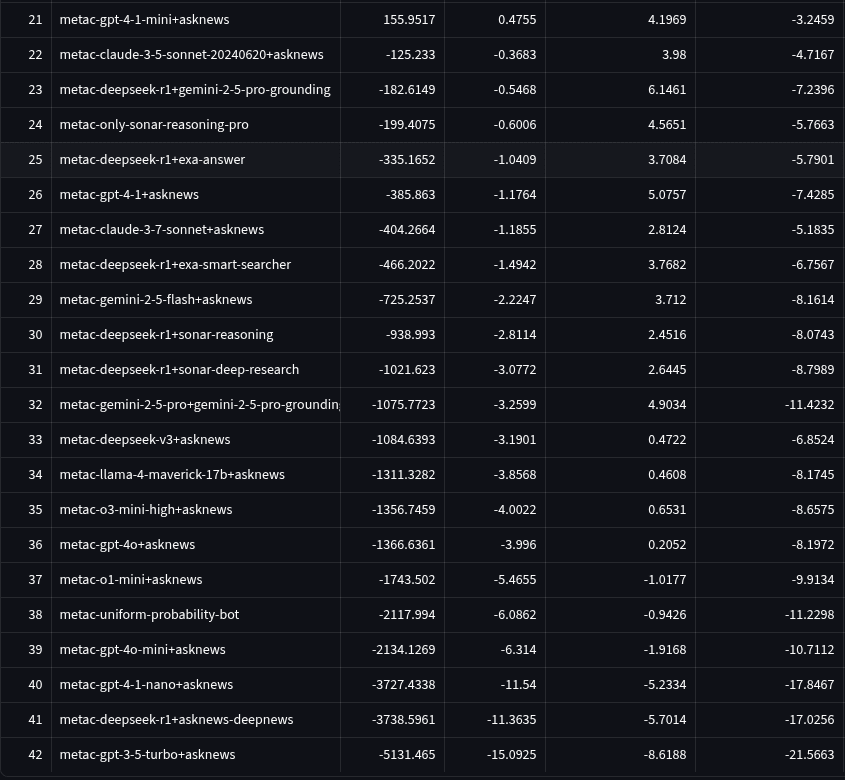
Let's take a look at the bot-only tournament. This tournament pits all the bots (both bot-makers and in-house Metac Bots) against each other and does not include any humans. You can see the full leaderboard here. Since there are 96 bots, let's first focus on the bots that topped the leaderboard. Below are the average scores of the top 10 bots when ranked by the sum of their spot peer scores. We rank by sum of spot peer scores to reduce the noise caused by bots that got high averages by getting lucky on only a few questions.
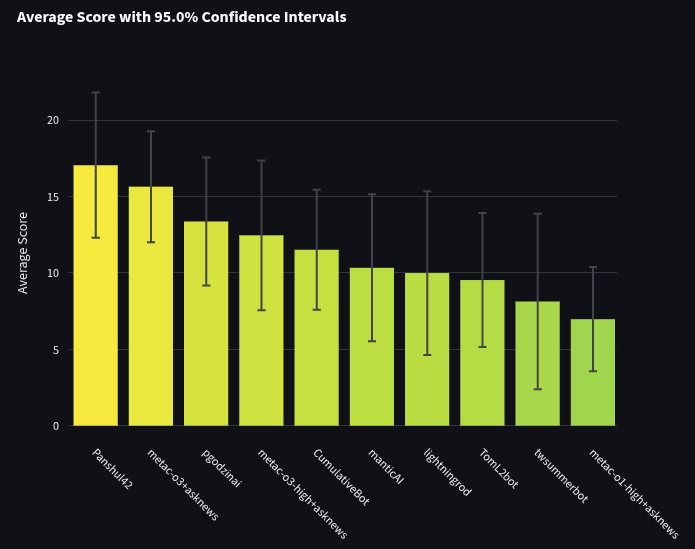
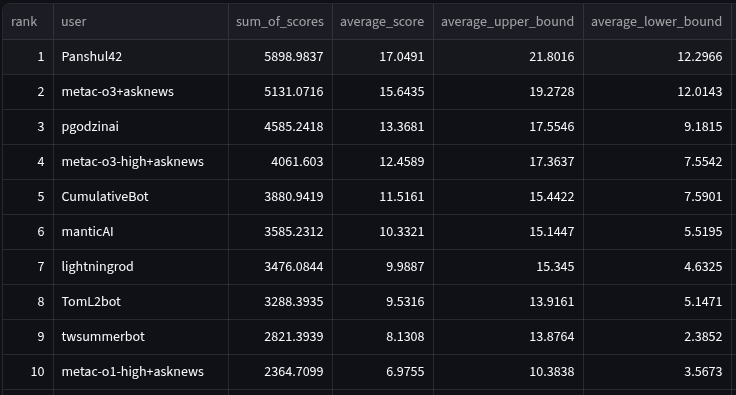
The best bot was made by bot maker Panshul42. Panshul has very generously made his bot open-source. You can review his code and prompts in full here.
We interviewed Panshul about his bot and asked for his description of how it forecasts questions. The bot starts by running multiple research reports. One report specifically looks for the outside view (historical rates), while the other focuses on the inside view (situation-specific factors). Originally, he ran these reports using Perplexity and deepnews, but switched to using a 6-7 step agentic approach that included using Serper to run Google Searches and BrightData.com to scrape HTML. He then runs 5 final predictions using sonnet 3.7 twice (later sonnet 4), o4-mini twice, and o3 once. In development, Panshul mostly manually reviewed his bot’s outputs and used his judgment to improve things. However, he also benchmarked his bot’s predictions against the community prediction (e.g., see here and here) on Metaculus using ~35 questions each time.
The second-best bot was one of Metaculus’s template bots, metac-o3. metac-o3 used AskNews to gather news and OpenAI’s o3 model to forecast. Links to its code are included in the “links and code” section. Here is a link to an example of its research and reasoning. For reference, here is the prompt that metac-o3 (and the other metac bots) used for binary questions:
You are a professional forecaster interviewing for a job.
Your interview question is:
{question_title}
Question background:
{paragraph_of_background_info_about_question}
This question's outcome will be determined by the specific criteria below. These criteria have not yet been satisfied:
{paragraph_defining_resolution_criteria}
{paragraph_defining_specifics_and_fine_print}
Your research assistant says:
{many_paragraphs_of_news_summary}
Today is {today}.
Before answering you write:
(a) The time left until the outcome to the question is known.
(b) The status quo outcome if nothing changed.
(c) A brief description of a scenario that results in a No outcome.
(d) A brief description of a scenario that results in a Yes outcome.
You write your rationale remembering that good forecasters put extra weight on the status quo outcome since the world changes slowly most of the time.
The last thing you write is your final answer as: "Probability: ZZ%", 0-100
Our template bots have reached the top 10 in all four tournaments over the last year. metac-gpt-4o (fka mf-bot-1) placed 4th in Q3 2024, metac-o1-preview (fka mf-bot-4) placed 6th in Q4 2024, and metac-o1 placed 1st in Q1 2025. metac-gpt-4o’s ranking has been sliding over time, as better models enter the competition, getting 17th of 44 in Q4 2024, 44th out of 45 in Q1 2025, and 82nd out of 96 in Q2 2025.
Most participants did not use o3 in their forecasting during Q2 due to its cost (or at least when we offered LLM credits, few requested it).
From the above, we conclude that the most important factor for accurate forecasting is the base model used, with additional prompting and infrastructure providing marginal gains.
Here is the zoomed-out full leaderboard. Like the chart above, this graph is ordered by the sum of spot peer scores, which is used to determine rankings on the site (i.e., so the 1st bar shown took 1st place), and the y-axis shows the average spot peer score.
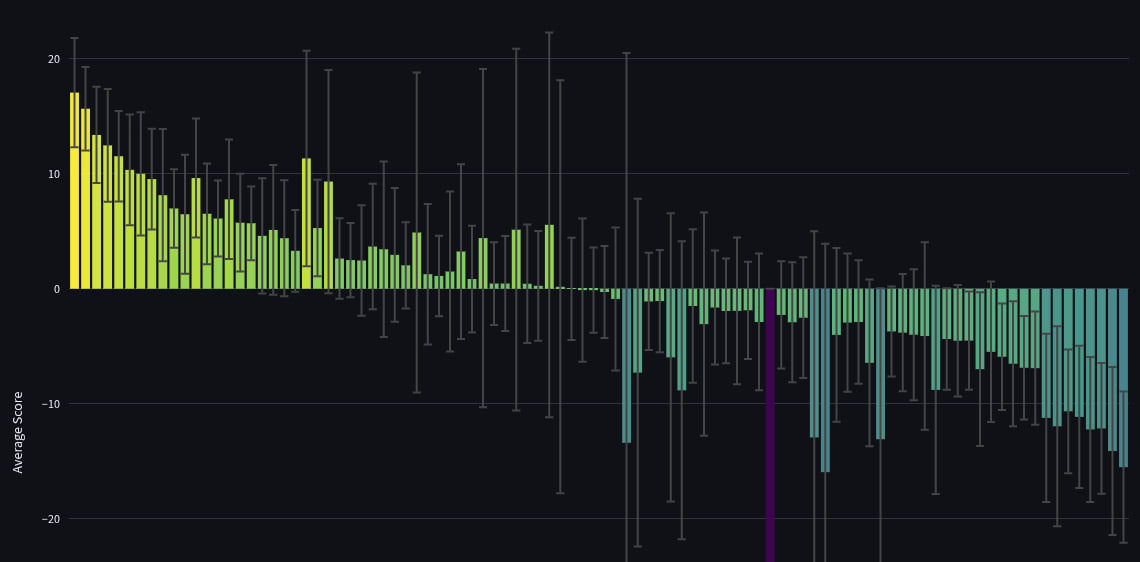
You’ll notice that some bots (e.g., goodheart_labs in 22nd, and slopcasting in 24th) have an average peer score that would have given them a rank in the top 5, except they didn’t forecast on enough questions (and consequently have much larger error bars). Of course, they may just have gotten lucky with their few forecasts, which is why we use the sum of peer scores to determine rankings: it incentivizes forecasting on more questions, which reduces our uncertainty (i.e., gives tighter error bars).
Are Bots Better than Human Pros?
To compare the bots to Pros, we used only the 93 questions that were identical in the bot and Pro tournament and that were not annulled. We then aggregated forecasts of the “bot team” and the “Pro team” (see methodology section above).
The bot team that was chosen is:
- Panshul42
- pgodzinai
- metac-o3+asknews
- metac-o3-high+asknews
- manticAI
- TomL2bot
- CumulativeBot
- twsummerbot
- metac-o4-mini-high+asknews
- lightningrod
We then calculated the head-to-head scores of the two teams, along with 95% confidence intervals using a t distribution. The average bot team head-to-head score was -20.03 with a 95% confidence interval of [-28.63, -11.41] over 93 questions.
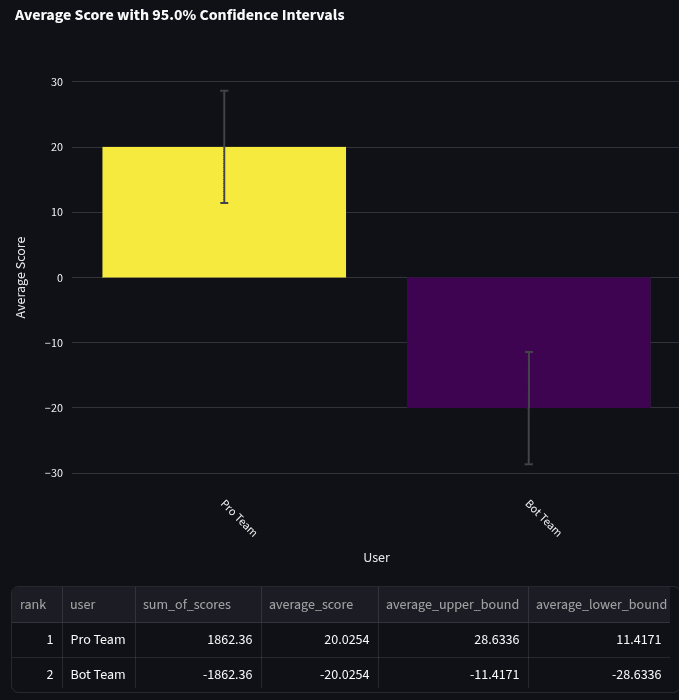
The negative score indicates that the bot team had lower accuracy than the Pro team. A one-sided t-test demonstrates that pros significantly outperformed bots (p = 0.00001).
Below is an unweighted histogram of the head-to-head scores of the bot team.
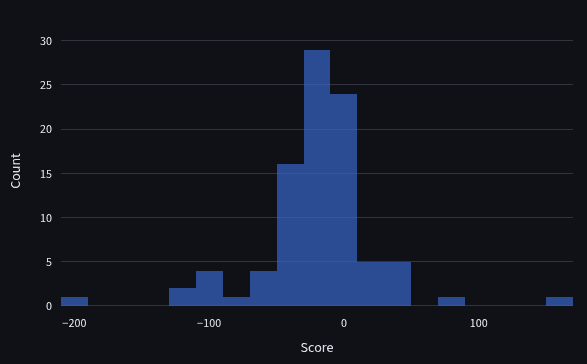
The distribution of scores is generally symmetric with a small left lean and fat tails on both sides. Scores in Q2 were slightly more concentrated on 0, but generally fit the same shape as previous quarters.
Additionally, each individual Pro beat every individual bot. We simulated a tournament where both pros and bots competed together as individuals on the 93 overlapping questions. Below is this leaderboard ordered by sum of spot peer scores. The top 19 participants are shown. Average spot peer scores are shown on the y-axis.
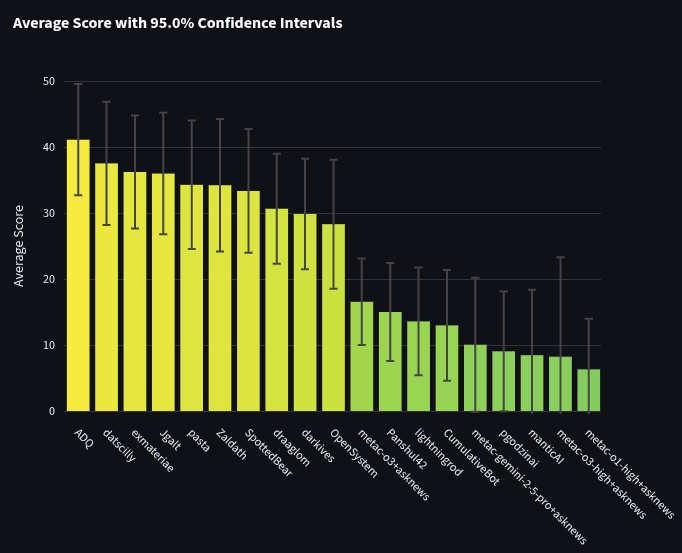
You’ll notice that if pros and bots competed together, all 10 pros would take 1st through 10th place (with metac-o3 getting 11th place).
Binary vs Numeric vs Multiple Choice Questions
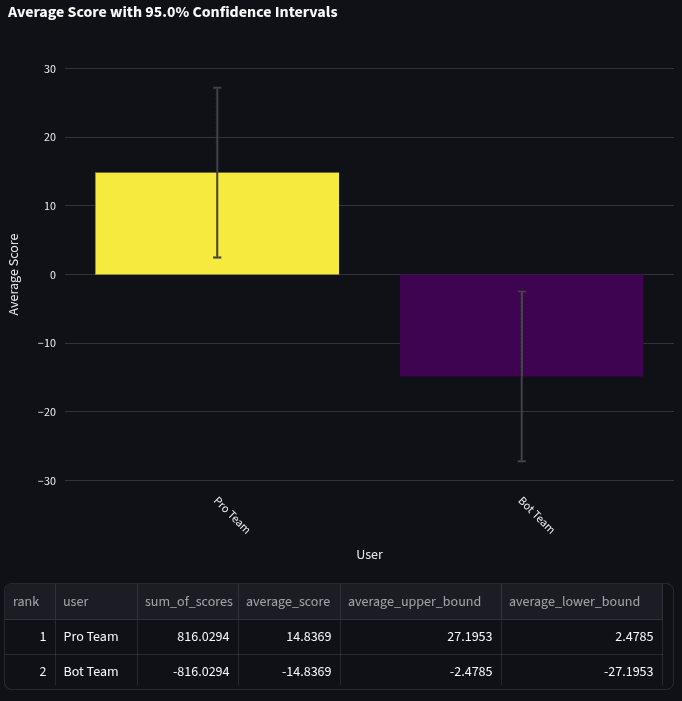
We also took a look at how bots did on each question type. When comparing the bot team and the Pro team on head-to-head scores, generally, bots did a lot worse at multiple-choice questions (score: -32.9) than at binary (score: -14.8) or numeric (score: -23.2). We also found that bots were worse at multiple-choice in Q1. Generally, the sample sizes in these comparisons are fairly small, so hold these conclusions lightly.
Here are the average head-to-head scores for the 55 binary questions:
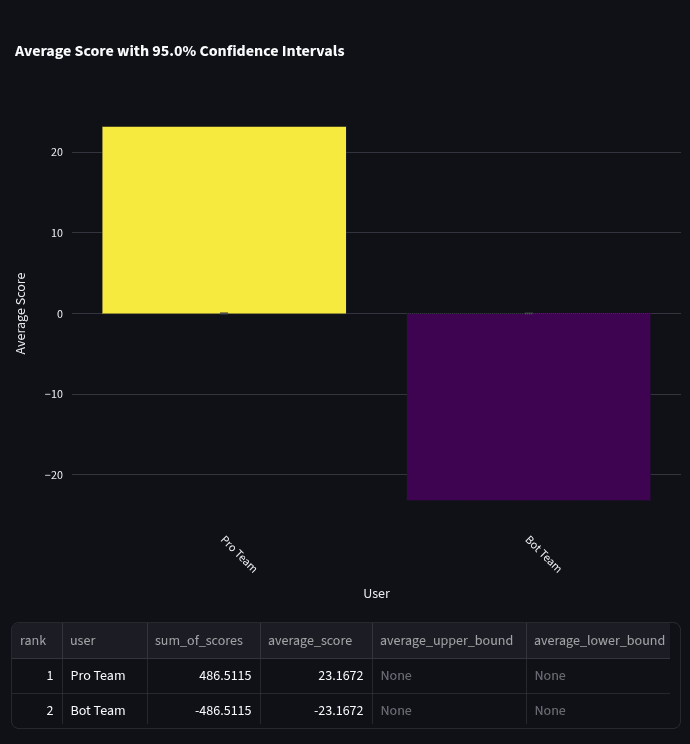
And here are the average head-to-head scores for the 17 multiple-choice questions:

And here are the average head-to-head scores for the 21 numeric questions (we do not include confidence intervals because our low sample size and a failed Shapiro test prevent us from validating the assumption of normality):
Team Performance Over Quarters
Now, let's compare how the bot team has done relative to the Pro team over the last 4 quarters. Below is a graph of Pro team vs bot team head-to-head scores over 4 quarters with 95% confidence intervals.
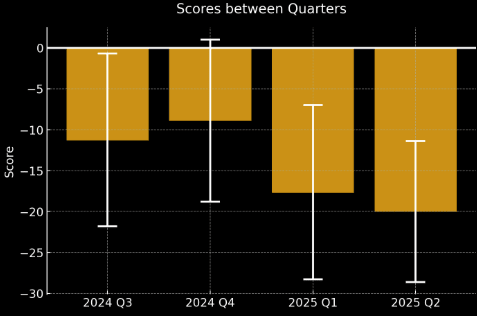
The values in the graph above are:
- 2024 Q3: -11.3 [-21.8, -0.7]
- 2024 Q4: -8.9 [-18.8, 1]
- 2025 Q1: -17.7 [-28.3, -7.0]
- 2025 Q2: -20.03 [-28.63, -11.41]
Since the confidence intervals do not overlap with 0 (which would indicate equivalent performance), we can see that in most quarters the Pro team handily beat the bot team (except for Q4). However, we cannot discern any trend regarding whether bots are improving relative to pros due to the overlapping confidence intervals between quarters. For instance, the true spot peer score of the bots (if we ran on a lot more questions) might be -15 throughout all three quarters. Unfortunately, we just do not have enough questions to state the direction that bots are trending in (despite having enough sample size to show that pros are better than bots).
One theory for the decrease in score from between Q3/Q4 and Q1/Q2 is the introduction of multiple-choice and numeric questions. As noted above, these were difficult for bots, and Q3 and Q4 only had binary questions.
Another theory is that the Pro team has gotten better. They have had a while to practice as a team with each other, and practice improves performance. One other factor is that they have access to better AI tools that can speed up their own research process. Though the pros we asked said that learning to work together as a team, and borrowing each other’s forecasting patterns, were more helpful than AI tooling.
Additionally, we have seen that the metac-gpt-4o bot started in 4th of 55 in Q3, 17th of 44 in Q4, 44th of 45 in Q1, and 82nd of 96 in Q2. Assuming that metac-gpt-4o can act as a control, this is evidence that bots have gotten better over the quarters. Though we have also seen metac-sonnet-3.5 go from 13th of 55 in Q3, to 42nd of 44 in Q4, to 34th of 45 in Q1, to 54th of 96 in Q2. This trend is much noisier. Some factors to consider:
- Ranks are not a great way to measure this progress since they are sensitive to the number of new competitors that have joined late (since every new competitor starts at the middle of the leaderboard with 0 pts), and some competitors will drop early given early bad performance.
- There have been slight changes in the underlying gpt-4o model over time, which would normally improve performance (though perhaps it’s hurt performance).
- metac-gpt-4o saw slight prompt changes over the quarters. In Q3, it used perplexity for its news. In Q4, it used AskNews. In Q1, it had a minor prompt change for binary forecasts and started handling numerics/multiple-choice questions.
Therefore, we believe that there is weak evidence that bots have gotten better on binary questions between quarters, and got worse in Q1/Q2 due to multiple choice questions. At the same time, pros have been improving, thus resulting in an increased gap between bots and pros. But generally (and statistically speaking), we can’t be sure of much about how bots have changed over time.
Bot Maker Survey
At the end of Q2 2025, we sent a survey out to bot makers who won prizes. Winners were required to fill in this survey as part of receiving their prize. There were a total of 19 completed surveys from botmakers, with 7 of them ranking in the top 10 (there were 96 bots in the tournament). Below are some insights from this survey.
Best practices of the best-performing bots
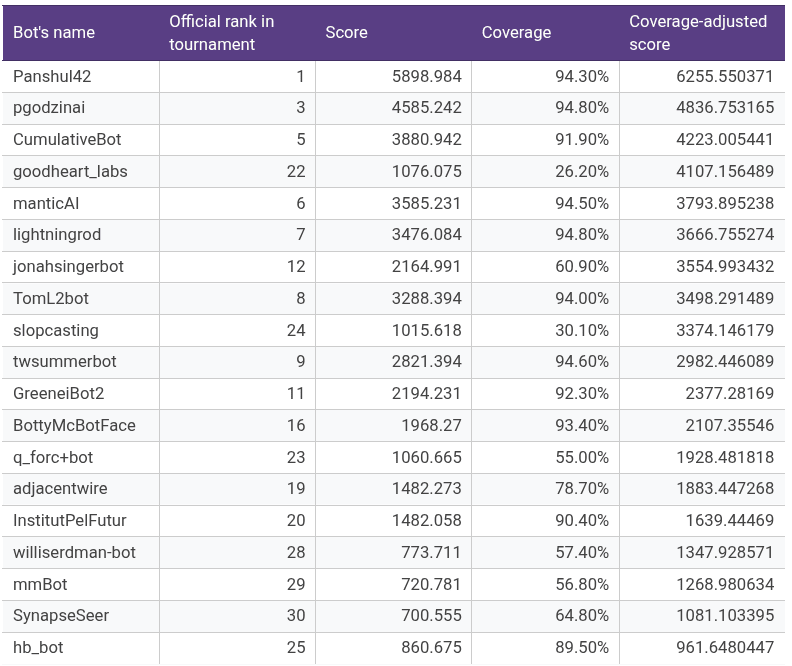
To compare the bots on an apples-to-apples basis on forecast accuracy, we divided the total score by coverage to arrive at what we call a coverage-adjusted score. From a methodological standpoint, this was necessary because a few bots (e.g., goodheart_labs and slopcasting) arrived late to the tournament but had very good scores in the time that they were present. The scores and official rankings of the botmakers are as follows (sorted by coverage-adjusted score):
We wanted to explore the difference between average coverage-adjusted scores on a couple of points. We chose some questions we were interested in testing the effectiveness of. Among the questions in the survey, we asked participants to check a box if they used code to “Take the median/mean/aggregate of multiple forecasts”, if they did “Significant testing via manual review of bot outputs (more than sanity checks)”, if they did “Testing via custom question creation/resolution”, and if they researched questions with “AskNews”. We then calculated the average score of those who said yes and no, took the difference, and found the upper and lower bounds using a 95% confidence interval. Please note that the sample sizes on these are small, and do not meet the n > 30 check for normality often required for meaningful bounds, so take these results with higher uncertainty.
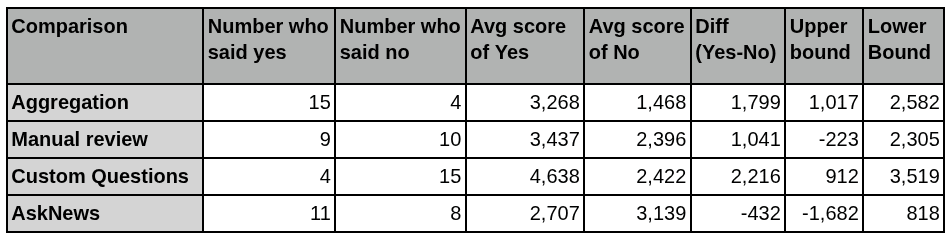
The largest positive effects come from testing one’s bot via the creation and resolution of custom questions. Botmakers who did this had a higher coverage-adjusted score of 2,216 points on average, as compared to botmakers who did not engage in this practice. (95% confidence interval = +912 to +3,519). However, after talking with one of the participants who checked this box, we realized that there might be ambiguity about what “Testing via custom question creation/resolution” means. We were interested in whether any bot makers created their own questions that are not hosted on Metaculus. This would include creating, resolving, and scoring LLM-generated questions. We think at least one participant may have interpreted this as “testing on questions outside of the AI benchmarking tournament with a custom set-up, even if using pre-existing questions on Metaculus”. Though we also know at least one participant interpreted it as it was intended. We are unsure about the others.
The second largest positive effect came from aggregation, which is taking the median or mean of multiple forecasts, rather than just one LLM forecast. Botmakers who did this had a higher coverage-adjusted score of 1,799 points (95% confidence interval = +1,017 to +2,582).
The third highest positive effects came from doing significant testing via manual review of bot outputs (beyond sanity checks). Botmakers who did this had a higher coverage-adjusted score of 1,041 points (95% confidence interval = -223 to +2,305). In his advice to bot makers, our winner Panshul42 suggests that in development, one should “Measure performance not just by accuracy metrics, but also by how well the LLM reasons.” A lot of the advice that bot makers shared (see relevant section below) echoes the importance of this theme.
One practice that did not make a demonstrable difference for botmakers was the use of AskNews. The AskNews result confirms what we found in earlier sections of this analysis regarding our in-house Metac Bots (i.e., that there was no clear “best search” option that stood out statistically between any of AskNews, Exa, Perplexity, etc). However, anecdotally, two of the most dominant bots, Panshul42 and pgodzinai, used AskNews for research. On the other hand, other high performers such as CumulativeBot, goodheart_labs, and lightningrod did not.
It is also notable that the top 3 botmakers were all either students or individual hobbyists, with #1-ranked Panshul42 putting in a total of 41-80 hrs (coverage-adjusted score of 6,256), #2 pgodzinai 16-40hrs (coverage-adjusted score of 4,837), and #3 CumulativeBot with 41-80hrs (coverage-adjusted score of 4,223). The next three participants were commercial entities: goodheart_labs (coverage-adjusted score 4,107), manticAI (coverage-adjusted score 3,793), and lightningrod (coverage-adjusted score 3,667).
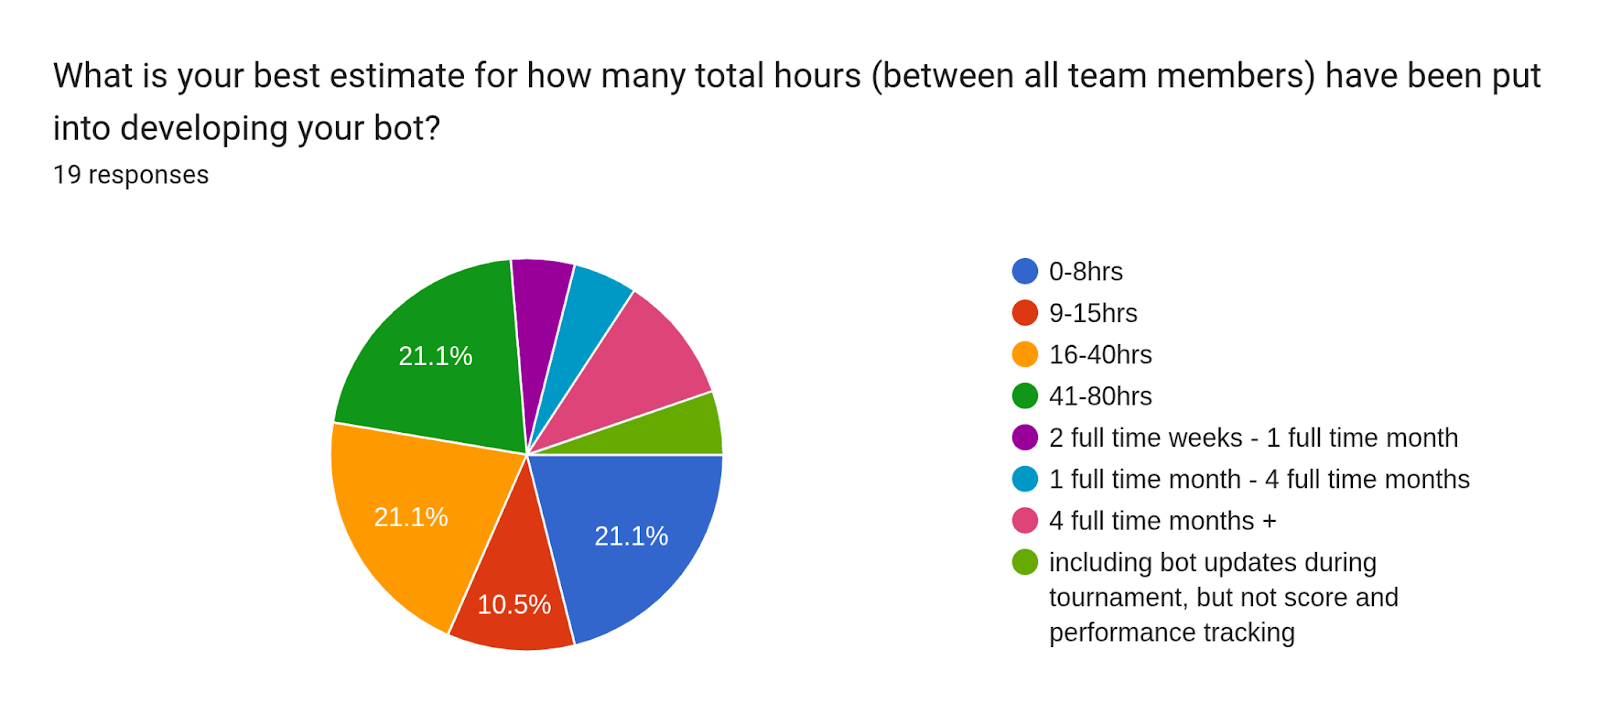
Time spent on developing one’s bot had a fairly weak correlation of only 0.20 with coverage-adjusted tournament score. As part of the survey, botmakers selected a multiple-choice option for how many total hours (between all team members) have been put into developing their bot. We used the midpoints of time estimates and converted them into hours (e.g., 16-40 hours converted to 28 hours). We also converted 1 month to mean 160 work hours. We looked at time spent and its correlation with tournament score. Below are the responses we got (Note: one person responded with a custom “other” field)
LLM calls per question had a correlation of 0.40 with a bot’s coverage-adjusted score, which is typically considered weak to moderate. This makes intuitive sense that more LLM calls per question would help due to it providing the model with more chances to research, engage in Fermi-style reasoning, aggregate multiple models, etc. However, it may be that the real reason for the mild correlation is that more calls are needed in order to properly aggregate forecasts, which we found to create some of the largest positive effects.
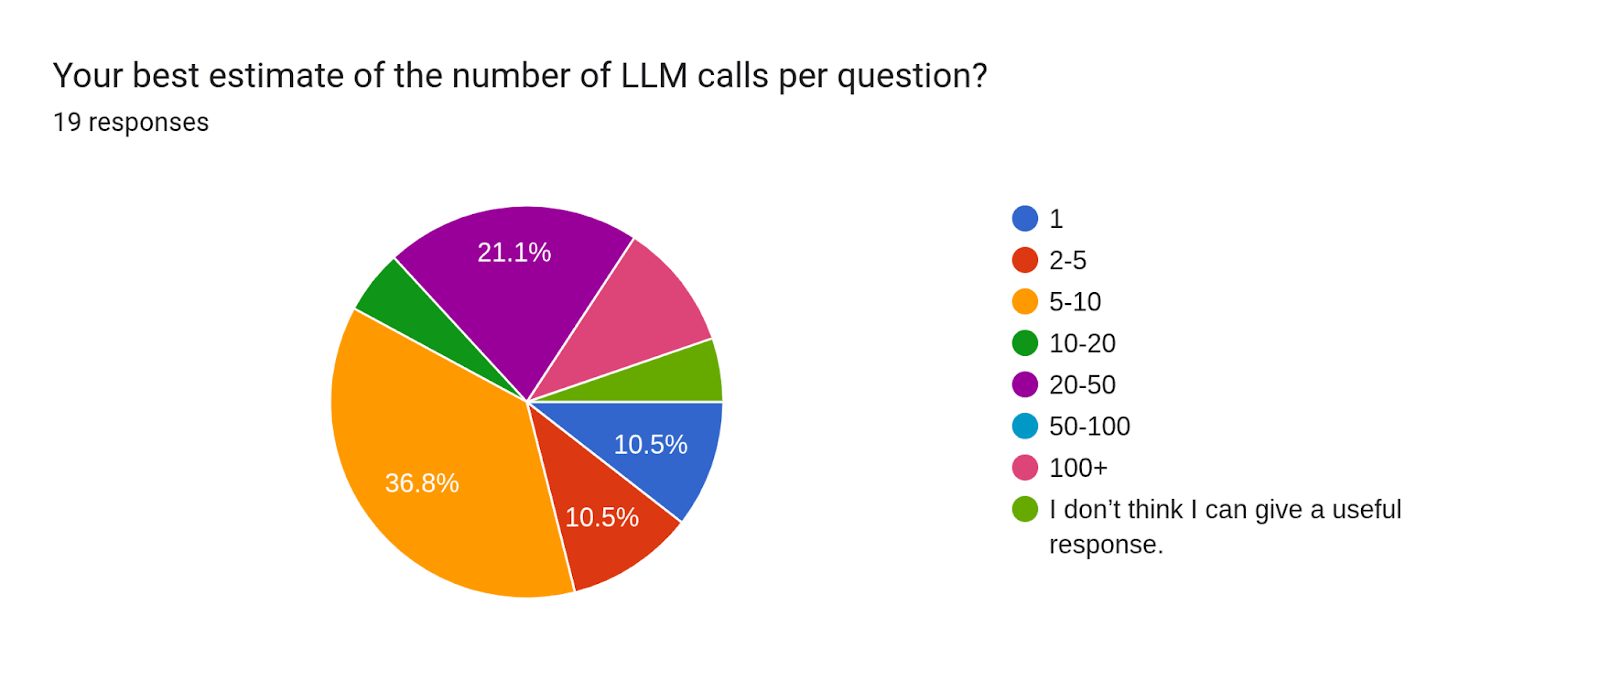
Remember that these results use a relatively small sample size. Additionally, correlation does not necessarily mean causation. We suggest that people should hold trends and takeaways tentatively.
Other Survey Results
In the survey, we asked “Which LLM model(s) did you use to make your final prediction/answer?”. The results show that o3 was used the most. Nine participants used only a single forecasting model, and three of these used o3 as their only forecasting model. The ten others aggregated forecasts of multiple LLMs, often from multiple providers.
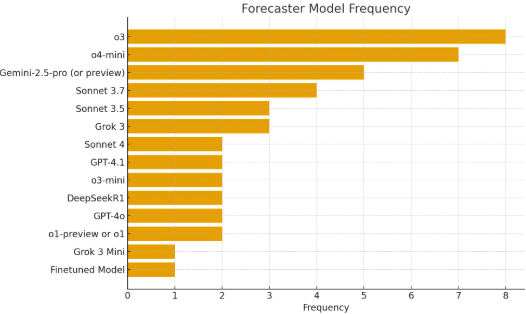
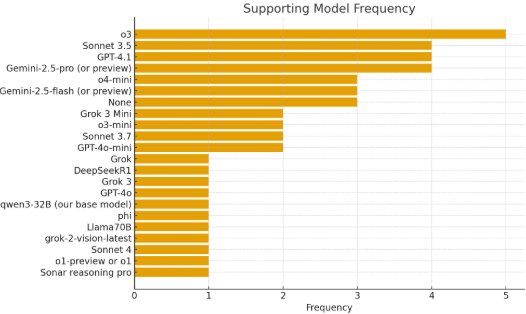
In a similar vein, we asked “Which LLM model(s) did you use in supporting roles (i.e., not final predictions)?”. Again, o3 was used most often.
To explore trends in research providers, we asked, “How did your bot research questions?”. AskNews was the most common, with different versions of Perplexity being the second most common.
- AskNews: 11
- Perplexity-sonar-reasoning-pro: 4
- Dynamic web scraping w/o computer use (HTML, Javascript, rendering, screenshots, etc): 4
- Perplexity-sonar-pro: 3
- Gpt-4o-web-search: 3
- Exa: 3
- Perplexity-sonar: 3
- Static web scraping (Only HTML): 2
- Grok: 2
- Google/Bing/DuckDuckGo Search API (or equivalent like Serp API): 1
- Anthropic web search: 1
- Gemini-2.5-grounding: 1
- Polymarket API: 1
- Urlbox: 1
- Open perplex: 1
- Adjacent News: 1
- Computer Use Model + Web Browser: 0
And here are some other stats:
- 3 participants said they used “LLM finetuning” in the development of their bot. 6 did “Testing via pastcasting (questions that have already resolved)”. 5 did “Testing against community prediction on prediction platforms”. Testing against the community prediction usually involves evaluating your bot’s expected score on questions while assuming the site’s community prediction is the true probability.
- Only 1 participant said they “Used a fine-tuned LLM for prediction” as one of their actual forecasting strategies.
- 7 participants included “Checking for forecasts on similar Metaculus questions or prediction markets”
- 10 of the 19 participants hadn’t participated in the Q1 AI benchmarking tournament the quarter previously, and so were relatively new (though some had participated in quarters previous to Q1).
How did scaffolding do?
Over the last four quarters of AI benchmarking, we have been interested to know whether prompt engineering and other scaffolding (e.g., computer use tools, code execution, etc) help bots with forecasting, or if the base model is the most important aspect.
One way to measure this is to compare the performance of bots to the Metaculus house bot that is most equivalent to them (i.e., used the same LLM model). Metaculus bots use a minimal amount of prompting and scaffolding. We asked each bot maker which LLMs they used for their final forecast and which LLMs they used in a supporting role (like research).
Let's first look at our top bot. Panshul42 performed well. He did much more scaffolding than the Metaculus bots and had a sum of spot peer score of 5,899 in the tournament. He used a combination of o3 and o4-mini for his supporting roles; o3, o4-mini, Sonnet 4 for his final predictions; and a wide combination of sources for his research bots, including AskNews, Perplexity-sonar-reasoning-pro, search engines such as Google/Bing/DuckDuckGo, and static web scraping using HTML. Panshul42 beat the comparable Metaculus bot, metac-o3+asknews, which had a score of 5,131. However, it’s also notable that Panshul42 did not beat metac-o3+asknews within a 95% confidence interval, and the error bars for average spot peer score overlap considerably (see graphs in the previous section comparing top bots). So in this case, scaffolding may have an effect, but not a large enough one to be noticeable.
We note that most participants who requested credits for the competition did not request OpenAI’s o3 model due to its cost at the time. Thus, it’s useful to run this comparison for other models as well.
In general, we did not see many bots beating their respective metac bot (at least when an apples-to-apples comparison could be made). One stands out, though. TomL2bot used Gemini-2.5-pro and achieved a tournament score of 3,288 (8th place) as compared with metac-gemini-2-5-pro+asknews, which had a score of 1,535 (18th place). Error bars have some overlap here with TomL2bot having an average spot peer score of 9.53 [95% 5.15 to 13.91] and metac-gemini-2-5-pro+asknews with an average score of 4.59 [95% -0.41 to 9.6]. Tom was a previous employee at Metaculus and created the original prompts for the in-house Metac Bots. During development for his TomL2bot, he did significant testing via manual review of bot outputs (more than sanity checks). He spent a total of 41-80 hours on bot development, capped his bot’s predictions at a maximum and minimum (to avoid large point losses from occasional AI overconfidence), and took the aggregate of multiple forecasts from his bot. He attempted to have his bot look for comparable Metaculus question predictions to compare to when forecasting, but found this did not help. His bot was fairly simple and focused especially on engineering the final prompt.
There are a number of potential conclusions that could be drawn from this. Generally, it seems model quality has more of an effect on forecasting accuracy than scaffolding does, while scaffolding has benefits on the margin. Though these results could also mean that there are a lot more bad prompts and bad forecasting structures than there are good ones. We might just need to try more approaches until we find the prompts or methods that create a huge difference. We lean towards the first conclusion, but still have hope for innovations in areas that bots have not tried.
Advice from Bot Makers
Bot makers were asked, “What should other bot makers learn from your experience? “. Here is their advice:
Bot A: multiple context providers, make sure you can process the resolution criteria links that may not otherwise be indexed
Bot B: Add lots of sanity checks. Grok 3 Mini is pretty good.
Bot C: Our biggest loss was screwing up millions [units] on a CDF question, so make sure to robustly test different question types. I still think there is a lot of ground to be covered in different prompts, layering of models, combining forecasts, etc.
Bot D: Keep up with model releases
Bot E: 1. Definitely scrape any links referenced in the article - took us a few days to realize this, and it was definitely a major disadvantage during that time. 2. Our approach was very research-heavy on outcome-based RL for LLMs - we've posted research on this: https://arxiv.org/abs/2505.17989 and https://arxiv.org/abs/2502.05253
Bot F: More news helped by bot (I used ask news and deep news). Using multiple runs of o3 was helpful (until it ran out of credits). I think it is promising to keep bots simple and use the best models.
Bot G: Failed: I tried to get Metaculus question predictions, but this didn't help.
Bot H: The Metaculus bot template is pretty good - info retrieval, reaping the benefits of aggregation (which I didn't do enough of), and LLM selection is more important than prompt engineering beyond it. This was a test run for me, as I joined late, so I don't think I have much to add.
Bot I: The reasoning models have come a long way. I would say that getting a bot to do pretty good reasoning is not too difficult at this point. The main bottleneck is in getting all of the necessary information, accurately, to the bot so that it has the information needed to make a good forecast.
Bot J: Things that worked well: Paying up for the highest quality LLMs for evaluation. Using a number of them from different sources (Gemini, Claude, GPT, DeepSeek, Grok) and choosing the median. Requesting research from multiple news sources. Minor prompt tuning. Things that didn't work well: tuning the model mix based on questions with early resolution. Not putting enough time into prompt optimization and evaluation of the research quality. Promising directions: Fix the things that didn't work. Use more sophisticated model blending. Use models to curate the news. Have model do evaluation and use self improvement based on progress in the competition to date. Suggestions for others: Use of highest quality LLMs is key.
Bot K: What worked: - o4-mini: Multi-run o4-mini easily beats single-run o1, which won the Q1 challenge. My direct comparison was o1 with one run versus o4-mini with 5 runs with the same prompts. My impression is that o1 with 1 run is equivalent to o4-mini with 2 or 3 runs. - Metaculus bot template was a success. In my view it was a starting point for best practices and tested tools. - Multi-scenario prompts. - Same forecasting core for all question types. - Integration of superforecaster and professional forecaster strategies. - Manual review/tracking of bot responses in-tournament: diary, errors, outliers, similarity to community. - In-tournament bot updates based on evidence.- Scaling prompt complexity and structure to smart intern analogy. - Late entry into the tournament instead of waiting for the next tournament. - Recognition that scoring is relative, and that the bot community evolves during tournament. 97% of Binary question bot runs produced a technically valid forecast. - Metaculus Bridgewater Human tournament participation provided insight into the general -Metaculus forecasting environment and idiosyncrasies.
What didn’t work: - Strong LLM with a single run is not a good idea, too volatile (though there were no failed runs) - Median aggregation reduces forecast precision. - Prompting the LLM for 1% precision was generally ignored. The LLMs like to forecast in 5% or 10% increments. - High failure rate of individual runs (about 30%) for Numeric and Multiple Choice questions. ...Usually due to errors similar to this example: Values must be in strictly increasing order [type=value_error, input_value=[Percentile(value=27.9, p...e=25.3, percentile=0.9)], input_type=list]
Bot L: We are continuing to build out Adjacent a real-money, play-money, forecasting, and LLM prediction platform aggregator combined with a news database. Anyone looking to build on top of it can reach out for access right now. We felt like we should have spent more time in the prompt engineering and find building a agentic wargame bot could be interesting for future tournaments. We also only used 3.5 and likely could have incorporated multiple models for various steps and generally better models. I also think potentially taking our database of Polymarket, Kalshi, Metaculus, etc. questions and finetuing something could be interesting.
Bot M: It is essential to use a good news source (in my case, AskNews) and model (in my case, GPT-4.1) rather than the prompt itself.
Bot N: I had tried to study which questions my bot did well on last quarter (binary No predicted questions) and which ones it didn't do well on (binary Yes predicted, multiple choice). I then decided to use the same model for binary and numeric questions, but avoid submitting binary questions that the model predicted Yes on (>50%) to avoid positive bias that was a major issue. In the end it wasn't a great idea to avoid submitting that subset, as the bot was simply out-scored by bots that simply answered them correctly. After ~2 weeks in, I saw poor performance of the new LLM (o4-mini-high) on multiple choice questions, so I disabled the forecasting on that question type. I think this may have been a mistake too given that it seemed to have performed decently on the leaderboard. Also I didn't do ensembling (only 1 LLM prediction per question) which probably didn't help. Essentially, If I had simply upgraded model to something like o4-mini-high or better on all question types and didn't overthink it, as well as leave ensembling on, it probably would've done much better.
Bot O: Nothing additional I can think of to add compared to Q1
Bot P: Sanitizing LLM output is hard. (In one of the first versions of the bot I tried to get the last llm to assign weights to each prior reasoning and then tried to calculate a weighted sum, but the LLM rarley used the format I specified, and even then it was hard to do for someone without professional programming experience.) Including the scoring and prediciton best practices (overconfidence, long tails) as part of the prompt helped mitigated inaccurate forecasts, lack of research/data and overconfidence due to i.e. "wrong" research
Bot Q: It's really important to experiment with different techniques to gain an intuition about what works and what doesn't. Build out an end-to-end sample and try applying what you've learnt and observe how it impacts performance. Measure performance not just by accuracy metrics, but also by how well the LLM reasons. Analyze failure cases, identifying if it was primarily due to lack of relevant information or reasoning issues (e.g., not paying attention to the resolution timeline). Generally, some reasoning issues can be fixed with prompting, but systematic ones need better models to be overcome.
Links to Code and Data
Below are links to code and data you may be interested in:
- Actual Q2 Metac Bot code that was run during Q2. You can export this bot from the forecasting-tools Python package.
- Exa Smart Searcher (Custom Wrapper) snapshot that was used in the exa-smart-searcher bot
- Panshul42’s Open Source Bot. In case of code updates, make sure to find/review a commit near the end of Q2 for reproducibility. Panshul’s LinkedIn can be found here.
- Original forecasts and Scores for each simulation
- Q2 Bot tournament with all bot questions, forecasts, and comments
- Pro tournament with all Pro questions, forecasts, and comments
- Code for this analysis, if you want to recreate the results locally.
- We often share data with researchers. If you are interested in running analyses on specific Metaculus data, please reach out to us at support@metaculus.com.
Future AI Benchmarking Tournaments
We are running more tournaments over the next year, like the one described in this analysis. See more at metaculus.com/aib. Email ben [at] metaculus [dot] com if you have any questions about this analysis, how to participate, or anything else.