The Copier Line: What ForecastBench's Market Scores Actually Measure.
By Dominus @ 2026-08-21T13:37 (+1)
Figures as of 11 August 2026. The leaderboard updates nightly. The method for recomputing every number here on any date is given in full, and the code is linked: [link]
Opening
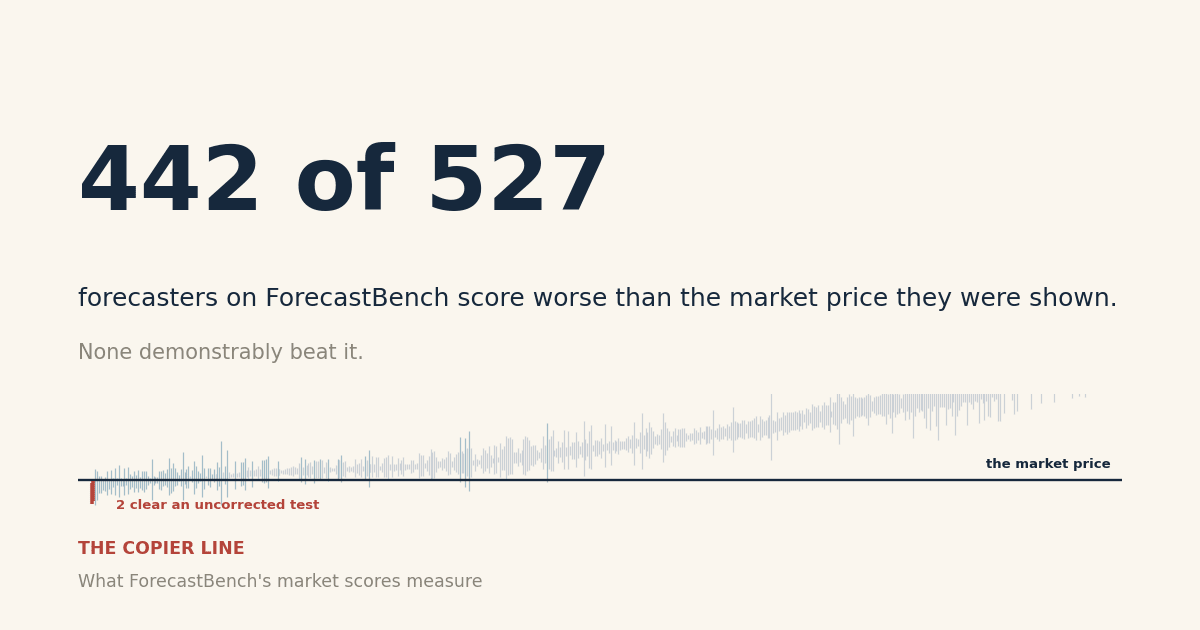
ForecastBench had tested 527 forecasters as of 11 August 2026. Of the ones with enough resolved market questions to test, 442 scored worse than the price they were handed. None beat it, once you account for having run 527 tests at once.
Two come close. They are the two the argument was already about: Cassi-2026-05-10 and the superforecaster median. Those are the ones this piece is about.
In July, the Forecasting Research Institute (FRI) published a report claiming AI models have reached parity with superforecasters on ForecastBench. Under its second heading, it went further and named an AI system that ranked above superforecasters on market questions for the first time.
FRI's reason for caring about market questions is that they demand judgment about novel, one-off events, which makes them the harder test of human-like forecasting skill. On that framing, an AI clearing the superforecasters there is a big result.
Good Judgment replied three weeks later. The human scores came from a single elicitation in July 2024, and running a continuously improving machine against a two-year-old human snapshot is not a fair race.
The sharper point in that reply was a correlation. One model's predictions sat at 0.994 against the market prices it had been shown. A number that high is consistent with a model that reads the price and adjusts, rather than one forecasting on its own.
The Financial Times ran a third test, AI against both the market and human superforecasters on Federal Reserve rate decisions. The AI drew level with the market. The FT read that as AI lacking the judgment to spot where a market is wrong.
So everyone now treats market questions as the real benchmark, and nobody has published what a market question score actually measures. What follows asks that question of 423,396 resolved market forecasts, using the benchmark's own scoring rule.
Tldr
- Of 527 entries, 442 score significantly below the market price at a 5% false discovery rate across all 527 tests. Zero survive the same correction in the other direction.
- Two clear an uncorrected test: Cassi-2026-05-10 (−0.0220, CI −0.0403 to −0.0055, exact bootstrap p = 0.004) and the superforecaster median (−0.0173, CI −0.0354 to −0.0016, p = 0.017). Both were named in advance by other people, which is why it is fair to read them uncorrected.
- The scoring rule implies a zero point. A forecaster submitting the price it was shown scores 70.93 on the Brier Index. Superforecasters sit 4.67 above it, Cassi 5.67.
- The published index is not comparable across dates. The superforecasters' adjusted score has been −0.0173 since July 2024, and their published index still fell 4.7 points in four months because the rescaling anchor rose 36.9%.
Two different nulls and 527 tests
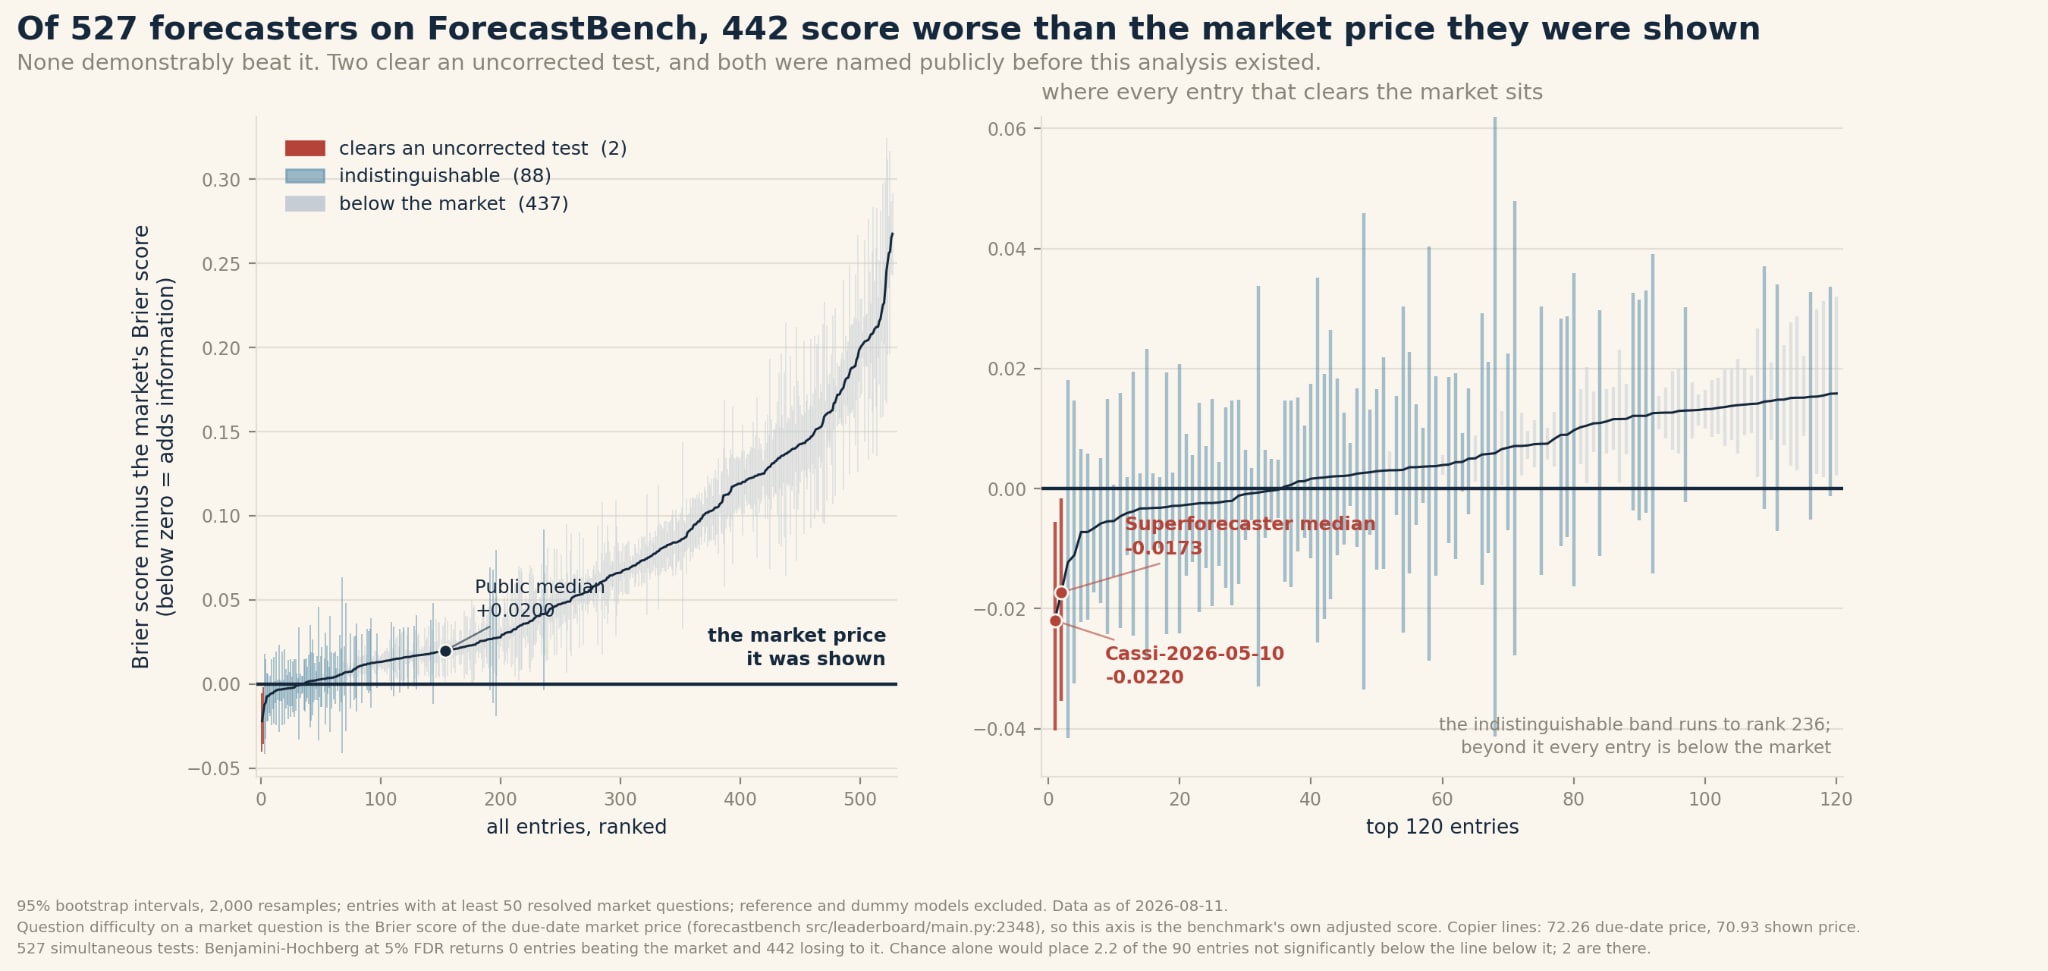
Figure 1. Of 527 forecasters on ForecastBench, 442 score worse than the market price they were shown. None demonstrably beat it.
FRI reports a bootstrap one-sided p-value of 0.41 for Cassi against the null that it is equally accurate as superforecasters, with 0.16 and 0.15 for xAI's submissions and 0.14 for Google DeepMind's. FRI itself notes that many of the confidence intervals overlap substantially, which makes the results more consistent with parity than with clear AI outperformance.
That test asks whether an AI matches the superforecasters. This one asks whether either matches the price both were shown. Both findings can hold at once, and they answer different questions.
The second test carries a cost the first does not. Running it once per entry means running it 527 times, and a two-sided 95% interval falls entirely below zero 2.5% of the time when the true edge is exactly zero. Of the 527, 437 sit significantly below the market on the uncorrected test, so their true effect is not near zero. That leaves 90 whose edge could plausibly be nothing. If none of those 90 had any edge at all, chance alone would put 2.2 of them below the line. Two are there.
Benjamini-Hochberg at a 5% false discovery rate returns zero discoveries in the beats-the-market direction and 442 in the other. The honest reading is that no entry on this board demonstrably beats the price it was shown, and the great majority demonstrably lose to it.
Cassi and the superforecasters stay interesting for a separate reason. This search did not select them. FRI's July post named Cassi. Good Judgment's reply named the superforecasters. Testing those two is a hypothesis someone else registered three weeks in advance, which is why their exact bootstrap p-values of 0.004 and 0.017 are worth reporting. They are also the only two that come close. The next strongest sits at 0.035, and nothing else clears 0.05.
What counts as a market question?
Each round carries 500 questions, 250 market, and 250 datasets, so market questions are half of every round. Market questions come from Infer, Manifold, Metaculus, and Polymarket. Dataset questions are generated from ACLED, DBnomics, FRED, Wikipedia, and yfinance.
Every question carries freeze_datetime_value, the source market's price on the day the question set was built, ten days before the forecast due date. Forecasters see that value in their prompts. Market questions take one forecast, dataset questions up to eight.
There are three scoring boards. The preliminary board scores dataset questions only. The tournament board adds market questions and produces the overall score, and it is the board the parity commentary cites and the board used in the parity comparison. The baseline board holds forecast files without freeze values.
The two boards use different difficulty adjustments. Across five consecutive days of published fixed-effects files, 0 of 2,987 market question fixed effects changed on the tournament board and 2,987 of 2,987 changed on the baseline board.
The switch is at main.py:3373-3377. Baseline gets TWO_WAY_FIXED_EFFECTS, tournament gets MARKET_BRIER.
FRI confirmed the reasoning when I asked. Tournament models have tools and scaffolding, so the market price on the forecast due date is the appropriate reference to score them against. Baseline models are handicapped in that respect, so their market questions get two-way fixed effects instead. They also said they plan to retire the baseline leaderboard.
Everything below concerns the tournament board.
How the market score is computed
Everything after this section depends on it. All of it is in src/leaderboard/main.py in the ForecastBench repository, MIT licensed.
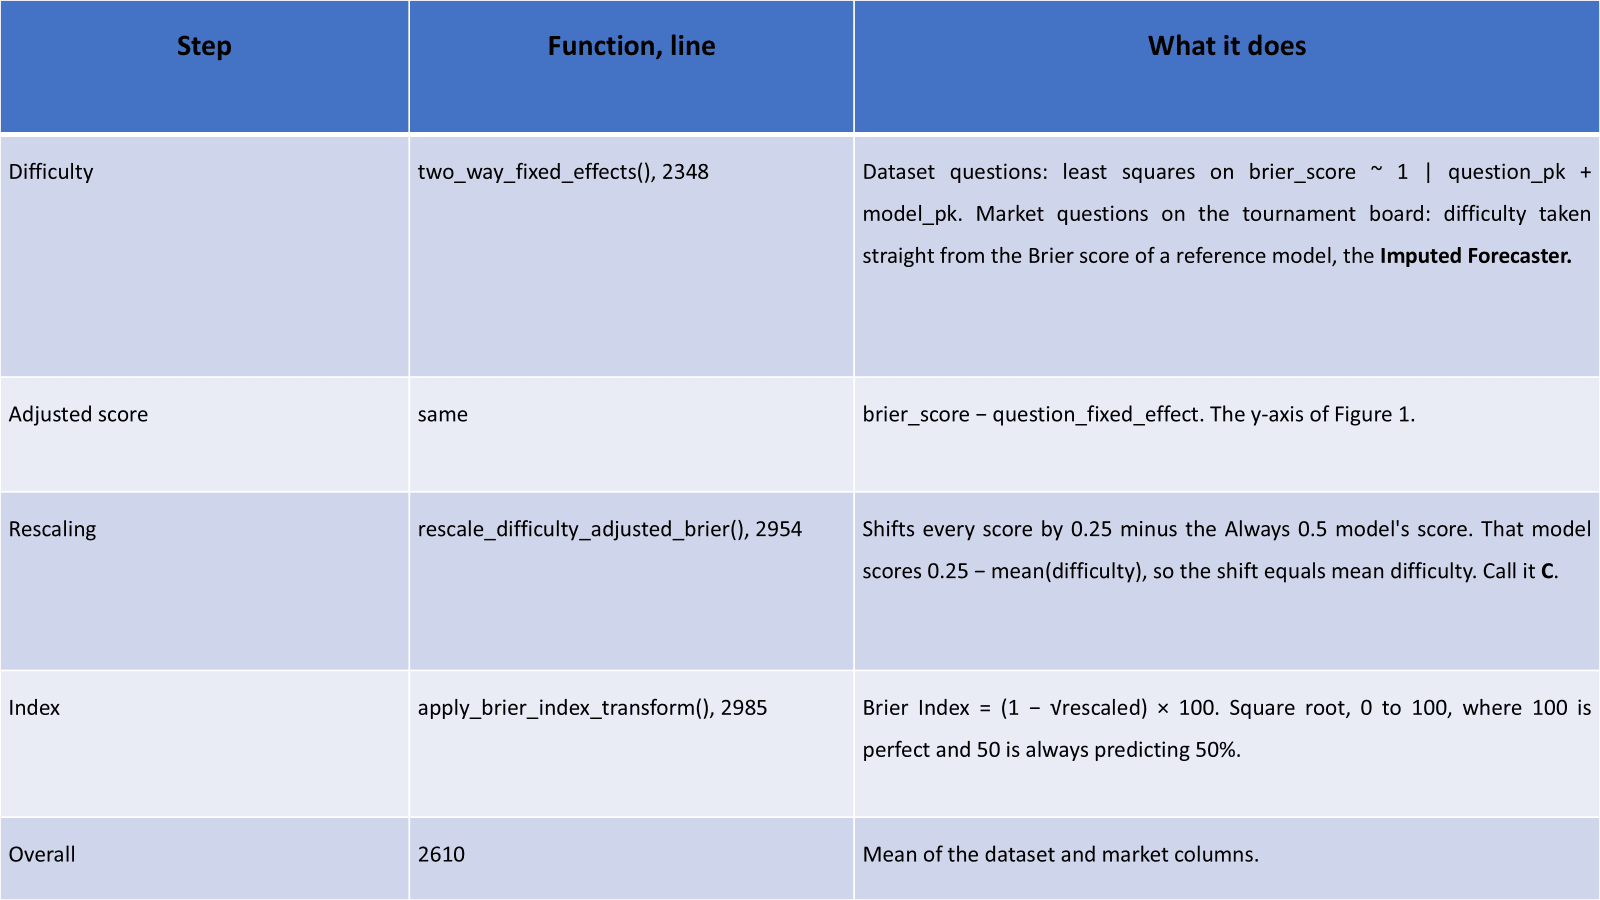
The Imputed Forecaster's forecast equals market_value_on_due_date on 100% of resolved market rows, correlation 1.0000. Market question difficulty is the squared error of the market price on the forecast due date.
The overall column is a straight mean, so the superforecasters' 57 resolved market questions carry the same weight as their 521 dataset questions.
The superforecasters' adjusted market score is −0.0173, and C is 0.076935, so their rescaled score is 0.059635 and (1 − √0.059635) × 100 = 75.58, against a published 75.6.
Data and methodology
Forecast data. The processed forecast sets published at forecastbench.org. 2,065 files across 33 rounds, 423,396 resolved market-question forecasts across 572 entries. Imputed forecasts are excluded throughout. Models need 95% coverage to appear on the leaderboard, and missing forecasts are filled at 0.5.
Question fixed effects. FRI's daily published files, 2026-08-07 to 2026-08-11, both boards.
Leaderboard history. 239 git revisions of leaderboards/csv/leaderboard_tournament.csv, 121 of them after the metric change below.
The bootstrap. For each entry with at least 50 resolved market questions, resample its questions 2,000 times and take the 95% interval of the mean adjusted score. Reference and dummy models are excluded, which leaves 527 of the 531 that clear the question threshold. A forecast counts as "copied" when it falls within 0.5 percentage points of a price, the threshold FRI used when reporting GPT-4.5.
The metric break
The leaderboard file reports raw Brier scores until 2026-03-04 and the Brier Index afterwards. Lower is better in one and higher in the other, and the two differ by roughly an order of magnitude. Anchoring a series across that date is a trap of a familiar kind. The file looks continuous, the column names do not change, and the values move by a factor of a thousand at a single commit. Every series here starts 2026-03-04.
Two market prices
market_value_on_due_date is the price on the forecast due date. The freeze value shown in prompts is ten days older. Over 3,175 resolved market questions where both are known, the due-date price scores a Brier of 0.0767 and the freeze value 0.0843. The benchmark measures difficulty using information better than any participant received.
That distinction sets the range of the copier line below, and it limits what can be inferred about behaviour. A forecast resembling the due-date price is consistent with a model using the freeze value it was given, and equally consistent with one pulling a live price at submission. External entries do not publish their prompt conditions. Every claim here about copying is a claim about resemblance to a price and says nothing about mechanism.
The copier line
Market question difficulty is the market's own Brier score. So a forecaster submitting a price verbatim scores zero on the adjusted scale, and its index is (1 − √C) × 100. Two prices give two lines.
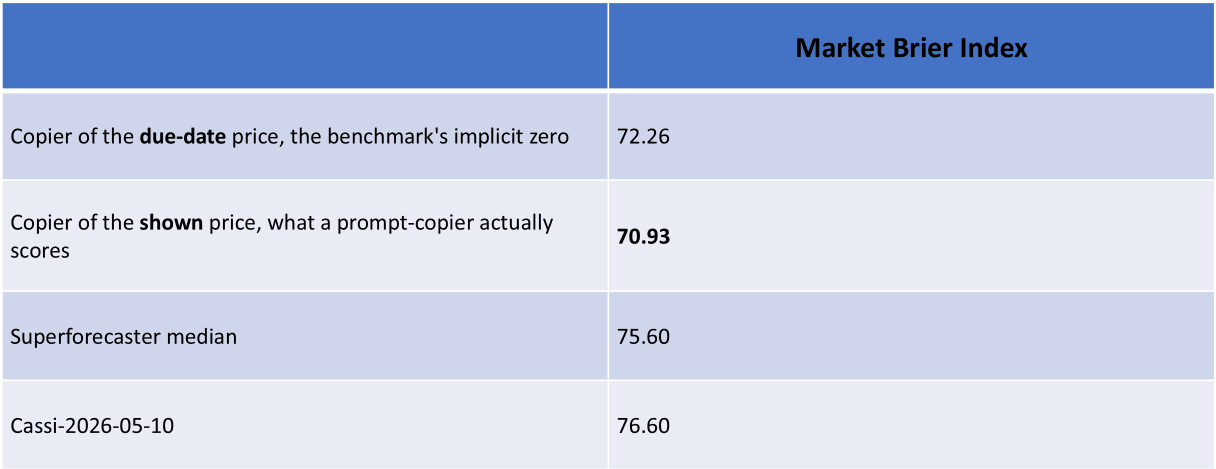
Both rows are on the full question pool. The due-date line is (1 − √C) × 100 at the published anchor C = 0.076935, which is 72.26. The shown-price line carries forward the price penalty measured on the 3,175 questions where both prices are known, δ = 0.084268 − 0.076674 = 0.007594, giving (1 − √(C + δ)) × 100 = 70.93. Computing both on the 3,175-question subset alone gives 72.31 and 70.97, a 1.33-point gap on the full pool against 1.34 on the subset.
Scoring against a reference forecast is old. The Brier Skill Score does it, Metaculus's Peer Score does it, and FRI's own addendum weighs both as alternatives before settling on the difficulty-adjusted Brier. The point here is narrower. Setting the market weight to 1 already makes the published market column a skill score against the market price, and the zero point that implies has never been drawn.
No participant saw the due-date price, so the due-date line is unreachable by copying. The shown-price line at 70.93 is the behavioural zero, the score for adding nothing to what was in the prompt. Superforecasters sit 4.67 above it, Cassi 5.67.
Against the shown-price line, 204 of 273 leaderboard entries, 75%, score at or below it. Against the due-date line, 239 of 273, 88%. Both counts compare published index values directly and need no name matching. Both lines move with C and have to be recomputed per date. The due-date line stood at 76.31 in April.
Figure 1's bootstrap is the stricter version of the same test, and it gives the harder number: two entries of 527.
What the freeze value buys
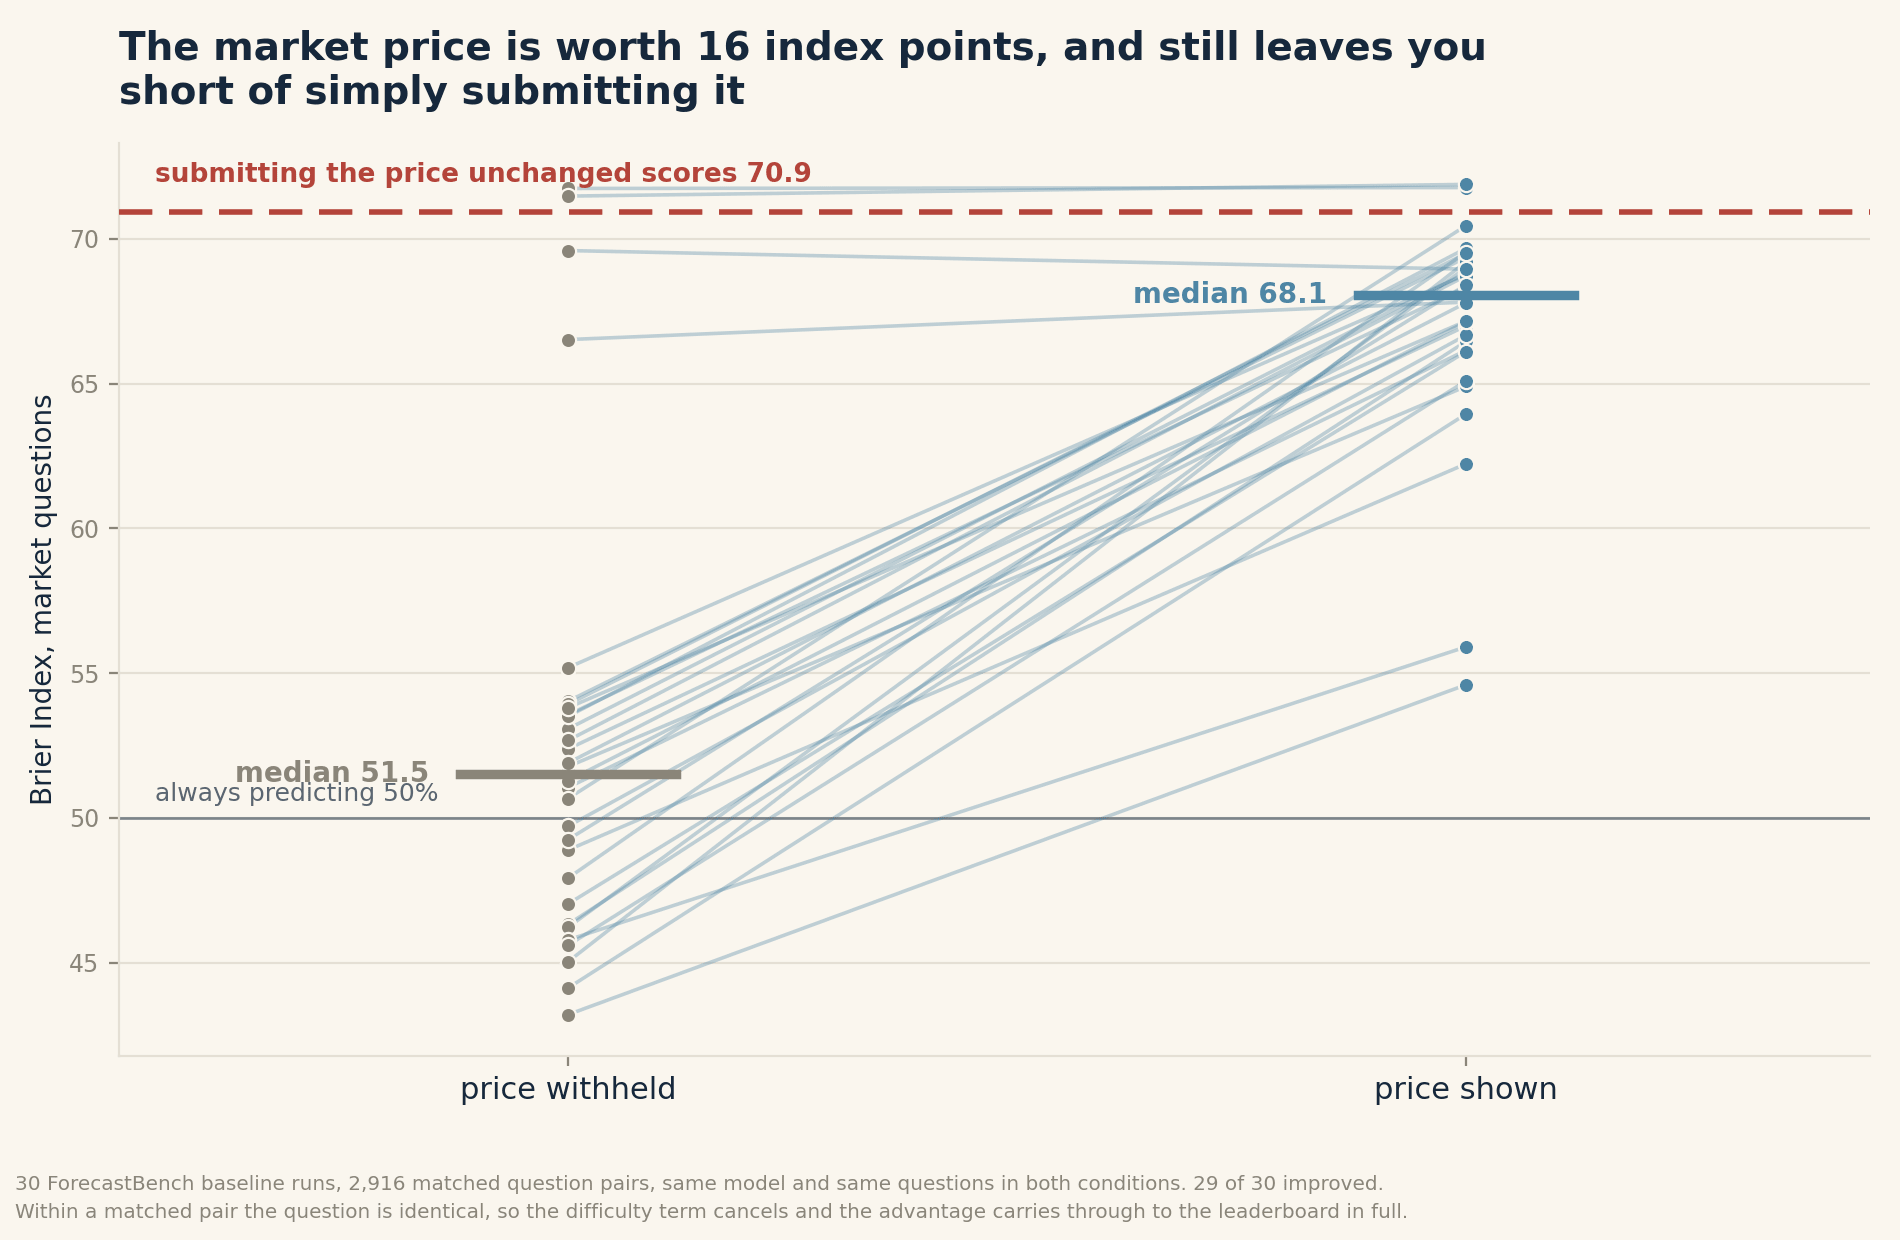
Figure 2. The market price is worth 16 index points and still leaves you short of simply submitting it.
ForecastBench runs its own baseline models twice on identical question sets, once with the freeze value in the prompt and once without.
Within a matched pair the question is the same, so the difficulty term cancels, and the paired difference in adjusted score equals the paired difference in raw Brier. The advantage carries through to the leaderboard in full.
Across 2,916 matched pairs over 30 runs, the median improvement per run is 15.66 Brier Index points, and 29 of 30 runs improved. The two medians in the table differ by 16.55, a slightly larger number, because the median of the paired differences is not the difference of the medians. The paired figure is the right one for a design where every run appears in both columns.

Without the price, ForecastBench's own baseline models score 51.5, close to the 50 that always predicting 50% would score. Given the price, they reach 68.1, still below the 70.93 they would score by submitting that price unchanged.
Among the 531 forecast sets with at least 50 resolved market questions, including reference models, 77 correlate with the market price above 0.95 and 9 above 0.99. Among top-30 entries, the share of forecasts within half a percentage point of the market price reaches 67% for red-lizard, 58% for blue-turtle, 47% for green-plant, 45% for blue-croc, 42% for the voicetree-axiom entries and 41% for big-green-leaf. Those are anonymised external submissions whose prompt conditions are unpublished.
The humans had the price too. The human question set carries freeze_datetime_value on all 90 of its market questions, and superforecaster rationales use it. One reads, "I think the current market price of 36% is about right." Another describes updating toward a crowd consensus more confident than the forecaster's own view.
Everyone started from the same anchor. Figure 1 shows who added to it.
The published index is not comparable across dates.
This section has a shelf life. FRI has announced a fresh superforecaster round for autumn 2026, which retires the specific numbers below. The mechanism outlasts them.
Thirty-nine superforecasters forecast once, on 2024-07-21. On the 57 market questions from that round that have resolved, none imputed, their raw Brier is 0.0830 against the market's 0.1003. Their adjusted score is the difference, −0.0173, and every term in it is frozen. Their forecasts are fixed. Their questions' difficulty is the market's Brier, fixed once a question resolves. Confirmed: no market question fixed effect changed across five consecutive days of published files.
Their published index moved anyway. Inverting the transform recovers the anchor.
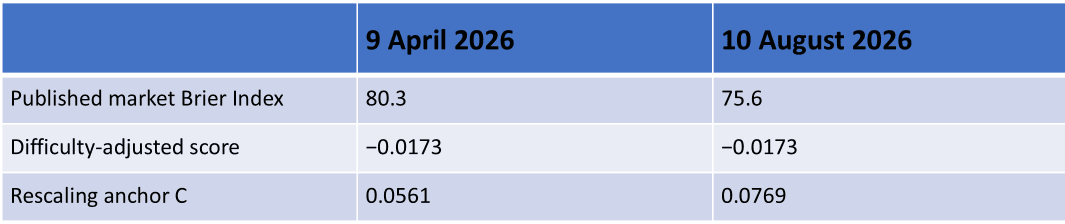
Inverting a published number is weak evidence on its own. C should equal the mean market question fixed effect, which FRI publishes daily. Measured from the 2026-08-11 file, 0.076935. Implied from the leaderboard, 0.0768. Two unrelated sources agreeing to one part in ten thousand.
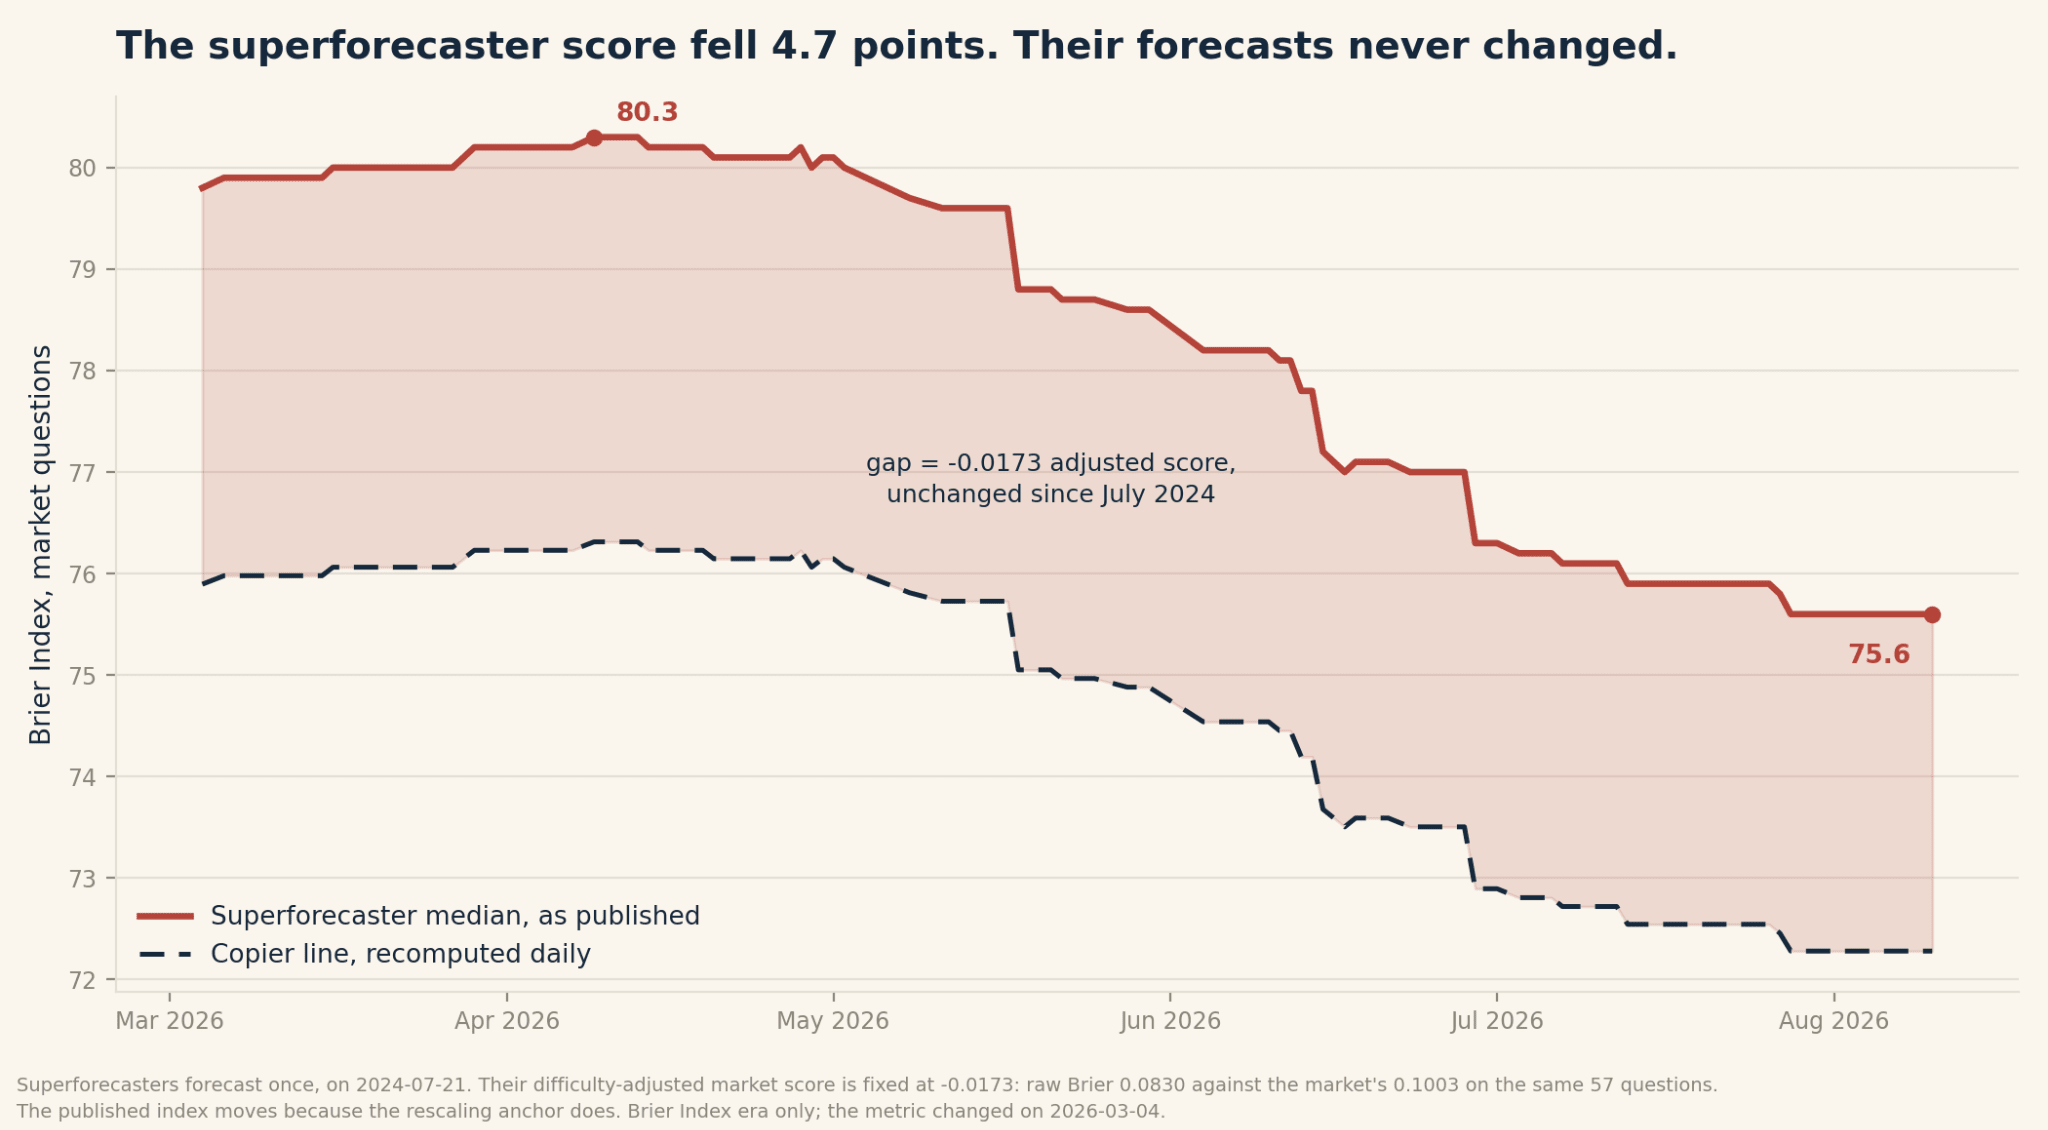
Gaps compress as well as levels. On 9 April the due-date line stood at 76.31 and the superforecasters at 80.3, a margin of 3.99. On 10 August the line is 72.26 and they are at 75.6, a margin of 3.34. The adjusted score is identical on both dates. The index gap fell because the pool got harder.
Good Judgment's April figures of 80.3 against 75.8 were correct when published. The board now reads 75.6 against 76.6, first crossing 2026-06-29.
Extending FRI's work
FRI validated the difficulty adjustment by simulation, reporting a Spearman correlation of 0.91 against ground truth for the difficulty-adjusted Brier score, against 0.81 for Peer Score, 0.78 for absolute Brier Skill Score and 0.64 for standard Brier. Their scenarios include sampling questions with above-median and below-median divergence between market difficulty and forecaster difficulty.
Two checks on the live data, in the same spirit. The humans answered 57 questions from one round. AI entries answered pools of up to 3,076 across 33 rounds. Those sets are disjoint.
Platform mix.
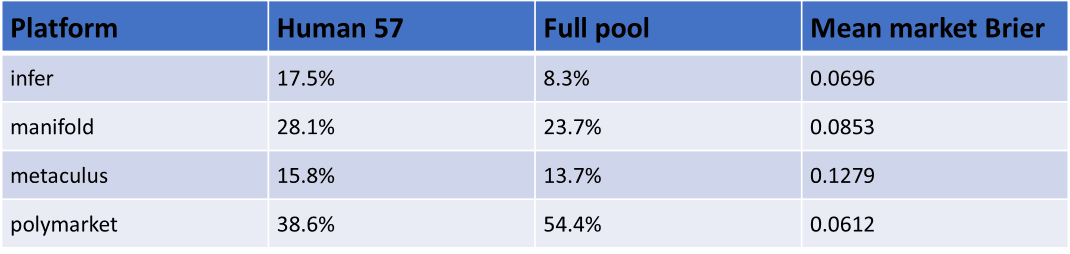
Whether that matters. The adjustment subtracts the market's own Brier per question. It is neutral if a forecaster's edge over the market does not vary with question difficulty. It stops being neutral if beating the market gets easier on questions the market finds hard, which is plausible, since those are the questions where a price has least information to be right about.
It is not neutral. Regressing the adjusted score on the question fixed effect returns −0.326, and that number is not the quantity of interest. The adjusted score is brier − γ, so the regression returns Cov(brier, γ)/Var(γ) − 1, and the −1 is mechanical. The estimable part is the pass-through, 0.0147 / 0.0218 = 0.674. A one-unit rise in market difficulty raises the average forecaster's Brier by about two thirds of a unit, so forecasters close roughly a third of the gap on questions the market finds hard.
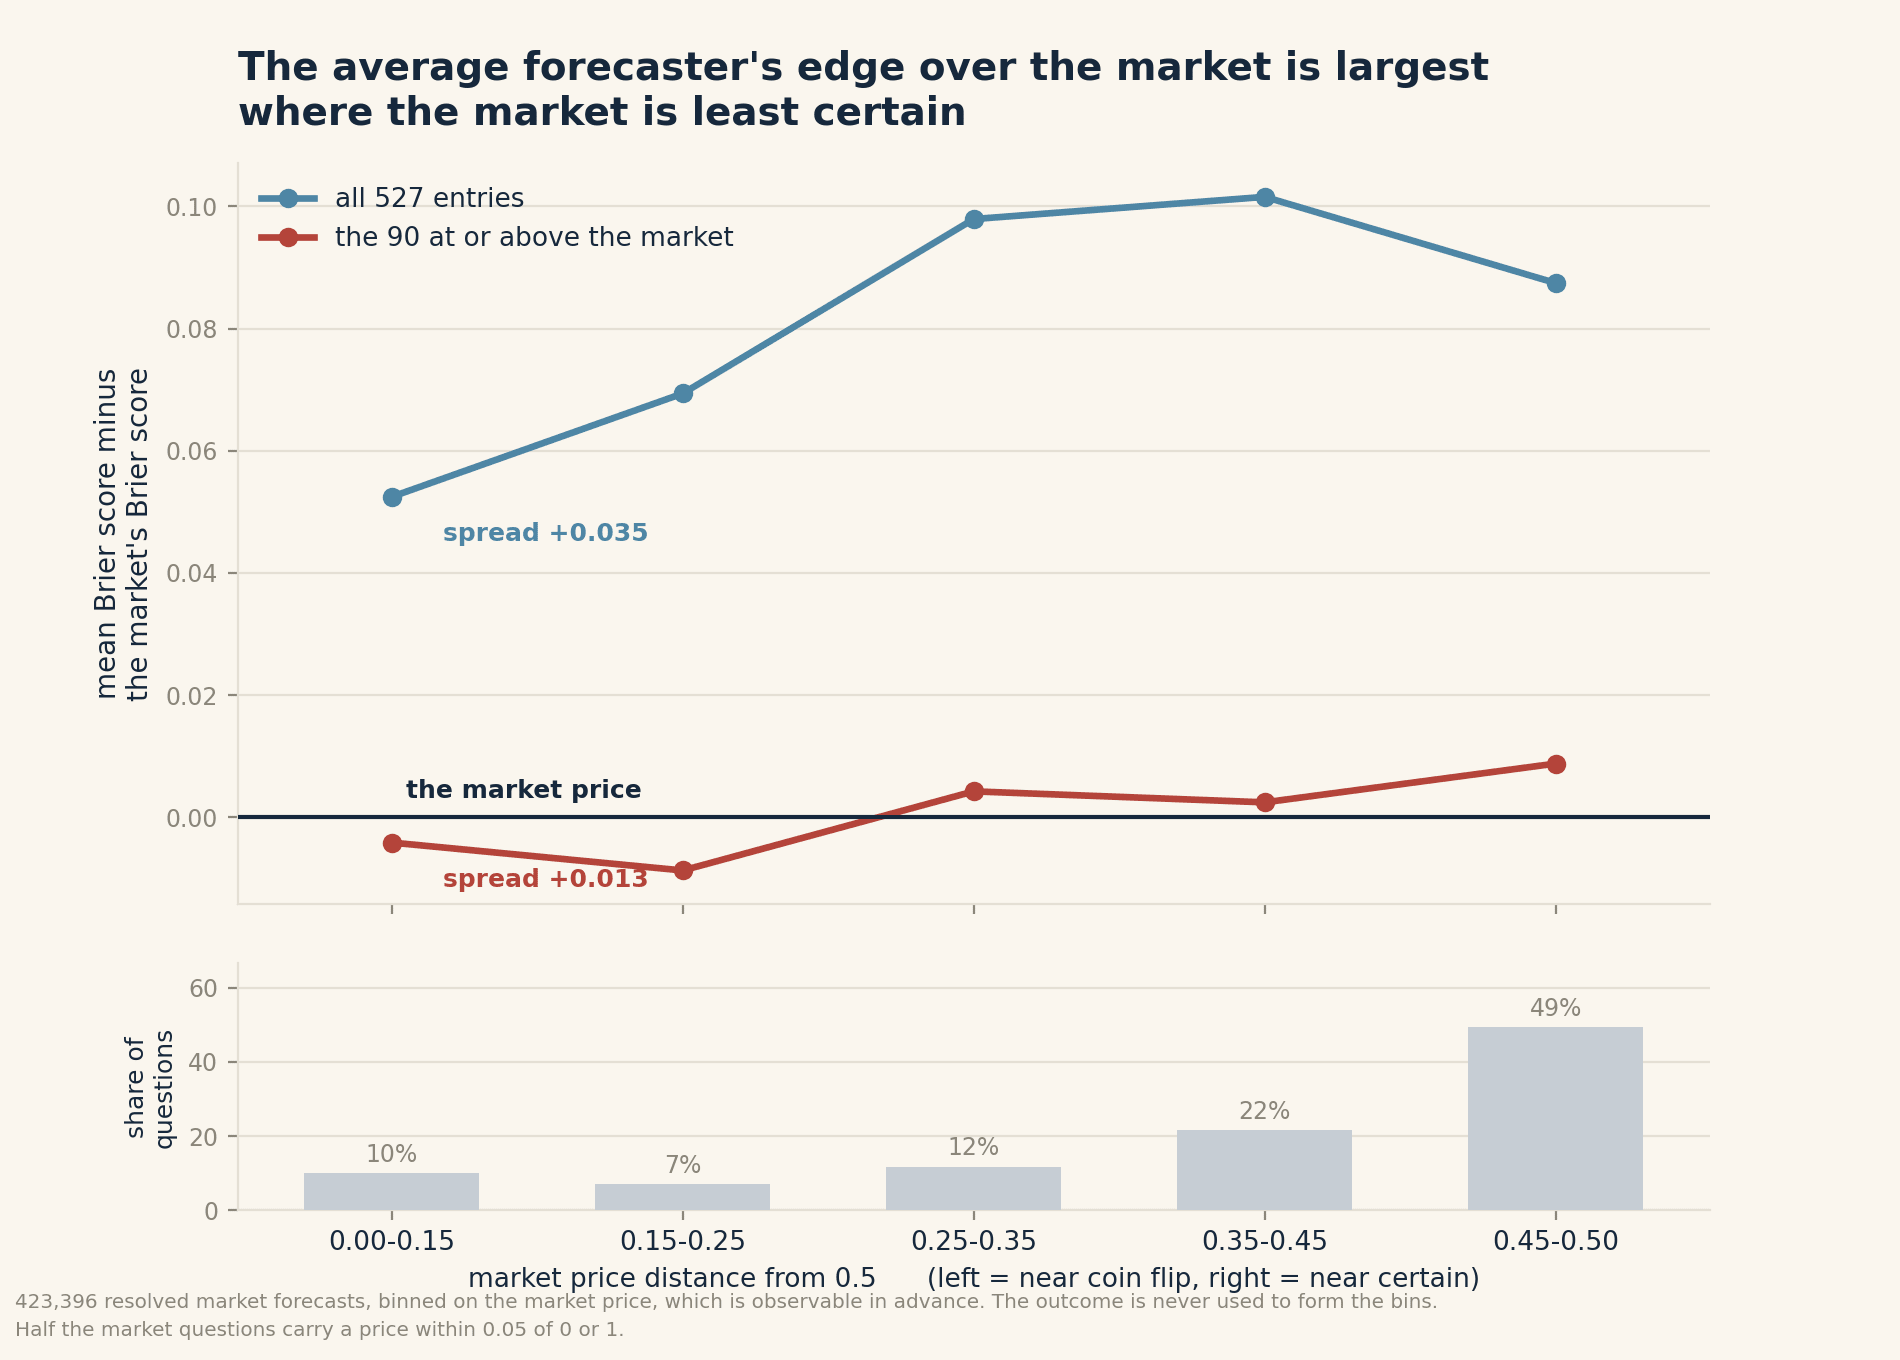
The same effect shows up on a second method that never touches the outcome. Binning 423,396 resolved forecasts by how far the market price sat from 0.5:
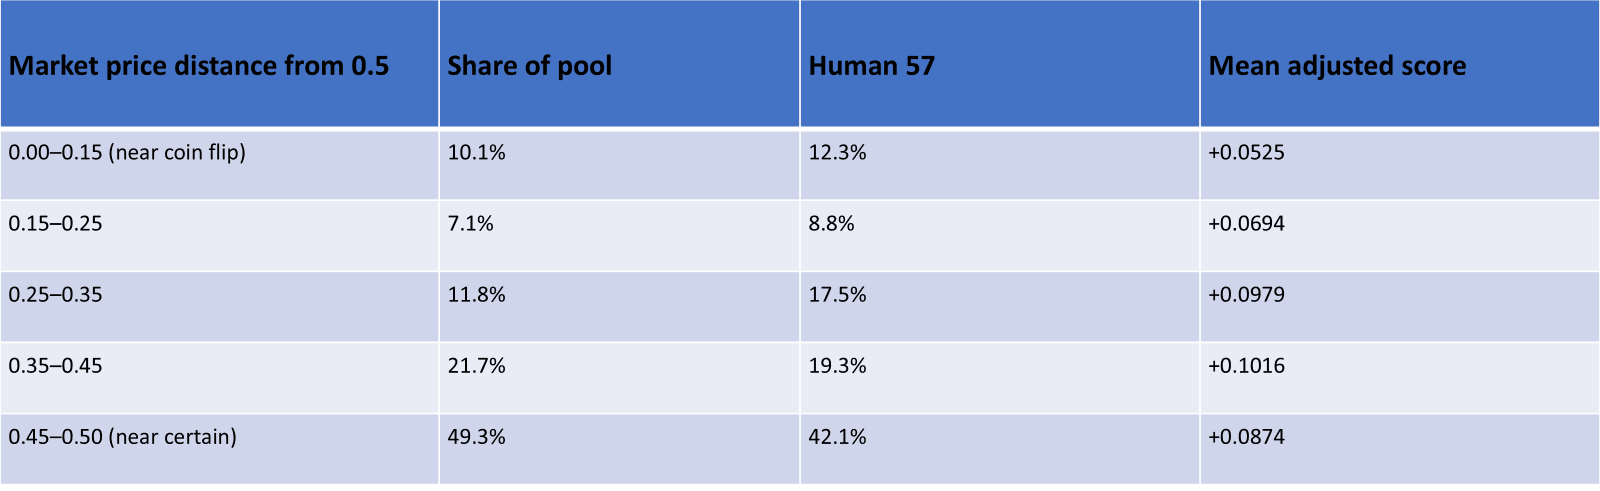
The average forecaster's edge over the market is largest exactly where the market is least certain. The spread between the extreme bins is 0.035, twice the superforecasters' entire margin. That is a fact about what the market column measures, and it means a copier line is a pool average whose level depends on pool composition. Half the market questions carry a price within 0.05 of 0 or 1, so the board is dominated by questions the market has already close to settled.
Sizing the effect on the human comparison. The pool-wide bin means average across all 527 entries, 437 of which score below the market, and some sit near +0.20. The superforecasters belong to a different population, and strong forecasters have a visibly flatter difficulty profile. Across the 90 entries that beat the market or cannot be distinguished from it, the spread between extreme bins is 0.013 rather than 0.035.
Reweighting on that population, the human question mix moves the expected adjusted score by +0.0006, and the sign runs against the humans rather than for them. Their overweight sits in the middle bins and their underweight at the near-certain end, and the two nearly cancel. Correcting for it moves −0.0173 to −0.0179, against a 95% upper bound of −0.0016. The result is unaffected.
The mechanism is real and sizeable. The human question mix happens not to exploit it.
Recommendation
Publish the copier line, and quote the adjusted score. FRI's own rationale for setting the market weight to 1 is that forecasters should rank above the market only by outperforming it. The scoring code already computes the number that makes this visible. Drawing it costs one horizontal rule.
The demand generalises past this benchmark. Any evaluation that puts a strong baseline in the prompt is measuring incremental skill over that baseline, and almost none of them report it. Retrieval-augmented QA hands the model the passage. Agentic benchmarks hand it the tooling and often the hints. Clinical benchmarks hand it the guideline. In each case there is a computable score for reproducing what was supplied, and in each case the leaderboard publishes the absolute number with that floor invisible.
ForecastBench is the best worked example available, because its scoring rule already defines the line and its authors have already argued for why it matters.
Autumn 2026 is the moment to do it. A fresh superforecaster elicitation resets the baseline and retires the drift numbers in the previous section. The copier line survives that reset, because it is computed from the question pool rather than from any forecaster.
Nine things this doesn't cover
- The board carries 527 simultaneous tests, so some entries clear a 95% bar by chance. Zero survive a 5% false discovery rate in the beats-the-market direction, 442 survive it in the other. Cassi and the superforecasters are reported uncorrected because both were named publicly before this analysis existed. Bonferroni cannot be assessed here: with 2,000 resamples the smallest achievable p is 0.0005, above the 0.000095 threshold.
- The bootstrap covers 527 entries with at least 50 resolved market questions, from the processed forecast sets. Matching those entries by name to the published leaderboard succeeds for 106 of 273 rows, which limits only the joint analyses, the leaderboard-restricted bootstrap split and the per-entry copy rates quoted for named top-30 entries. The counts against the copier lines compare published index values directly and need no matching.
- The copier lines assume a copier faces a representative sample of market questions, and both move with C.
- Resemblance to a market price is not evidence of mechanism. Scoring uses the due-date price, prompts showed a value ten days older, and external entries do not publish prompt conditions.
- The paired freeze-value experiment covers ForecastBench's own baseline runs. External entries have no paired condition.
- The 0.5 percentage point threshold is FRI's, adopted for comparability. Widening it raises copy rates steeply.
- The anchor series inverts the published index assuming the superforecasters' adjusted score held at −0.0173 throughout. Their resolved count moved 56 to 57 in July, which shifts it marginally.
- The bin analysis conditions on the market price, observable in advance, and not on any richer notion of question difficulty. Bins are coarse, and the near-certain bin holds half the pool. The reweighting uses the 90 entries at or above the market as the reference population. A narrower reference would be noisier and a wider one mis-sized.
- Two mechanisms are easy to conflate. Models more than a year past their training cutoff leave the difficulty estimation. Separately, new models wait 50 days before joining the leaderboard. Neither affects market question difficulty on the tournament board, which comes from the market.
What FRI already published
Every effect here was disclosed by FRI first, and their July post hedges its own claim.
The freeze-value advantage appears twice in the ICLR paper. They report that the top-performing models all had access to the crowd forecast on market questions, and that the best model without that access was less accurate.
The difficulty adjustment, the market weight of 1, the rationale and the simulation validation are in the methodology addendum. So is the stability analysis showing market rankings plateau around 0.8 to 0.9 with top-quartile retention near 70% after 50 days, which is why new models wait 50 days.
The July parity post states in its caveats that the confidence intervals overlap substantially and that the results are more consistent with parity than with outperformance. It also announces a fresh superforecaster round, updated dataset questions and quantile questions for autumn 2026.
A leaderboard excluding freeze-value models already exists and is published.
The quarrel here is not with FRI's claim. It is with how the number travels downstream.
References
- Karger, Bastani, Yueh-Han, Jacobs, Halawi, Zhang, Tetlock. "ForecastBench: A Dynamic Benchmark of AI Forecasting Capabilities." ICLR 2025. arXiv:2409.19839. Benchmark design, freeze-value baselines, July 2024 human comparison. The difficulty adjustment and Brier Index are not in it.
- Kucinskas, Bastani, Karger. "ForecastBench: Updated Ranking Methodology." FRI. Difficulty-adjusted Brier score, market weight, stale-model exclusion, simulation validation, stability analysis.
- Forecasting Research Institute. "AI models have likely reached parity with superforecasters on ForecastBench." 16 July 2026. The parity claim, its p-values, and its caveats.
- Good Judgment. "Not So Fast." 24 July 2026. The frozen-baseline critique, the copying question declared unexplored, and the FT summary. Good Judgment sells superforecasting services.
- Devlen, Lena. "What ForecastBench Doesn't Measure (Yet)." Good Judgment, 14 April 2026. The preliminary-versus-tournament distinction and the April figures, correct on publication.
- Financial Times, Fed-decision backtest, July 2026. Cited via Good Judgment's summary for the system's stated reliance on market trackers.
- ForecastBench codebase, forecastingresearch/forecastbench, MIT. The scoring rule.
- Data: forecastingresearch/forecastbench-datasets, CC BY-SA 4.0, plus processed forecast sets and question fixed-effects files from forecastbench.org. --- Four hundred and forty-two forecasters out of 527 scored worse than the price they were shown.