"How much do plant-based products substitute for animal products and improve welfare?" – An Unjournal Pivotal Question (update: added polls)
By david_reinstein, aemeader, schmiessja @ 2025-08-07T21:34 (+46)
(More polls embedded below)
Summary
As part of The Unjournal’s Pivotal Questions initiative, in collaboration with Animal Charity Evaluators, we’re investigating “to what extent would reducing the cost of plant-based meats reduce the consumption of animal products and raise animal welfare”? Existing research seems limited and methodologically fragile, and it presents inconsistent results.
We propose an operationalized focal question:[3] “If the price of ~Impossible Burgers were to fall by 1% (alt: 5%, 20%, and to price parity with avg. ground beef), how many more/fewer factory-farmed chickens would be consumed per year?”
We’re making our process, reasoning, and uncertainty explicit and transparent.[4] Our next steps (in progress):
- Synthesizing and curating the existing research
- Posting a set of related questions on Metaculus
- Eliciting expert and stakeholder beliefs
- Commissioning evaluation of the literature, with a clear focus on the pivotal question
Our follow-up report will aim to aggregate the stated beliefs under uncertainty and present the state of the evidence and best-guess expert consensus, with a focus on the implications for funding and policy choices.
For further background on our Pivotal Questions (PQ) project and our process and progress, see here (general) and here (in the context of the cultivated meat PQ). We welcome critiques of our question framing and approach. We invite anyone interested in this topic or The Unjournal’s mission to suggest and discuss relevant research, get involved as a forecaster, or join our evaluator pool.
Notes on this post:
(1) Roastmypost.org “epistemic audit” [1],
(2) Our use of LLMs/AI in this post, AI ~alternative post [2]
(3) Trevor Woolley and Jacob Peacock provided advice on this content.
Background on Plant-Based Products and Substitution
Alternative proteins have generated substantial interest and funding in recent years, generally in the hopes that offering affordable, tasty alternatives to meat[5] and animal products will reduce the destructive impact of factory farming. But would these alternatives actually lead consumers to reduce their animal product consumption in ways that significantly reduce animal suffering?
Existing Research
Empirical research on how plant-based analogues (PBAs) displace animal products has produced inconclusive and sometimes conflicting results. For example, studies like Neuhofer & Lusk, 2022 and Cuffey et al, 2022 present evidence that households did not decrease their consumption of beef after their first time purchasing a PBA, suggesting a lack of substitution. However Zhao et al, (2022) finds PBAs are a “price substitute to chicken, turkey, and fish”. The forest plot below further highlights the incongruity in recent work.[6]
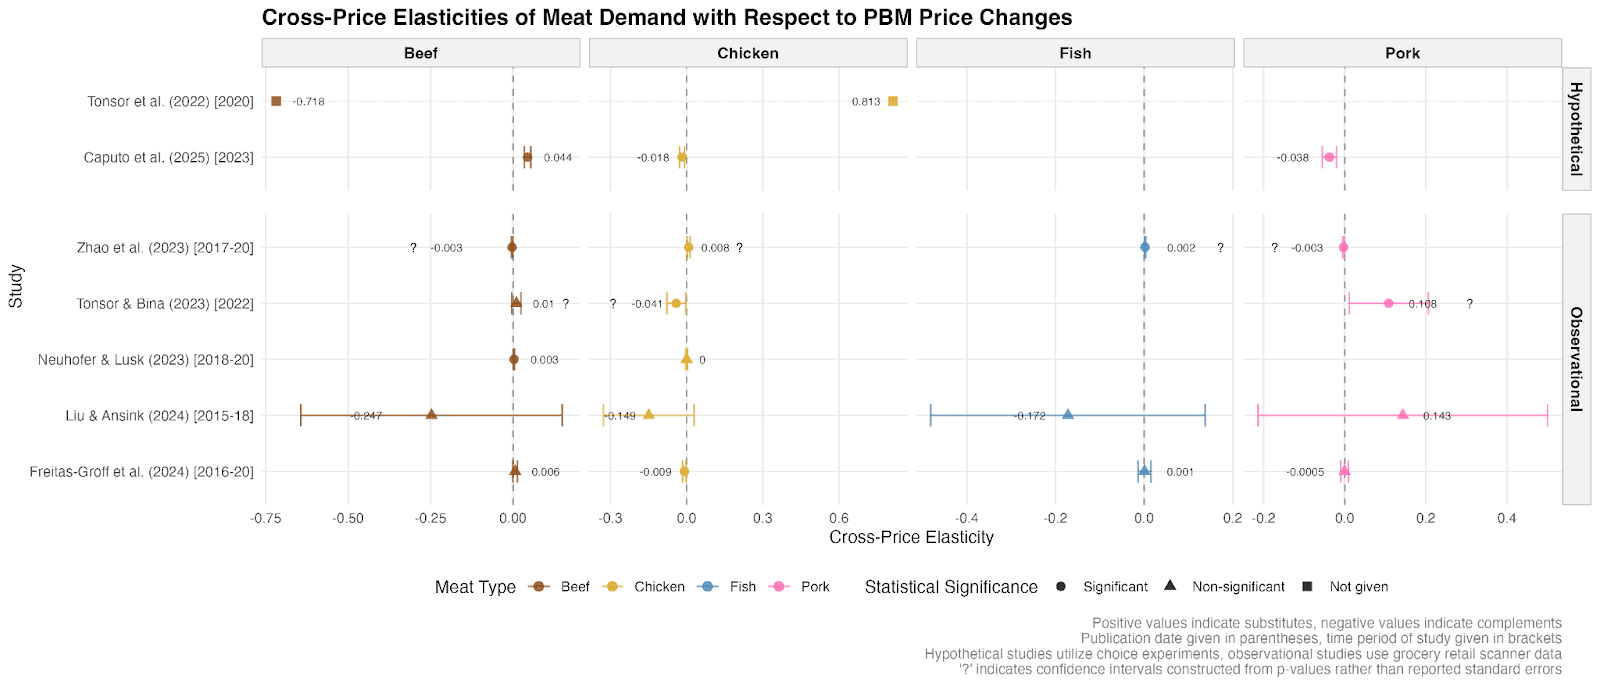
In the plot above (please zoom in) the bars and dots ~report “by what percent does each type of meat purchase increase when the price of PBA increases?”
The results are all over the map. Considering only the “statistically significant” results for now:[9] Beef is found to be a complement to PBAs in two studies and a substitute in three studies. Chicken acts as a complement to PBAs in two studies and a substitute in two studies. Fish is only included in three of the seven studies and is found to be a complement once and a substitute once. Pork is a complement twice and a substitute once.[10]
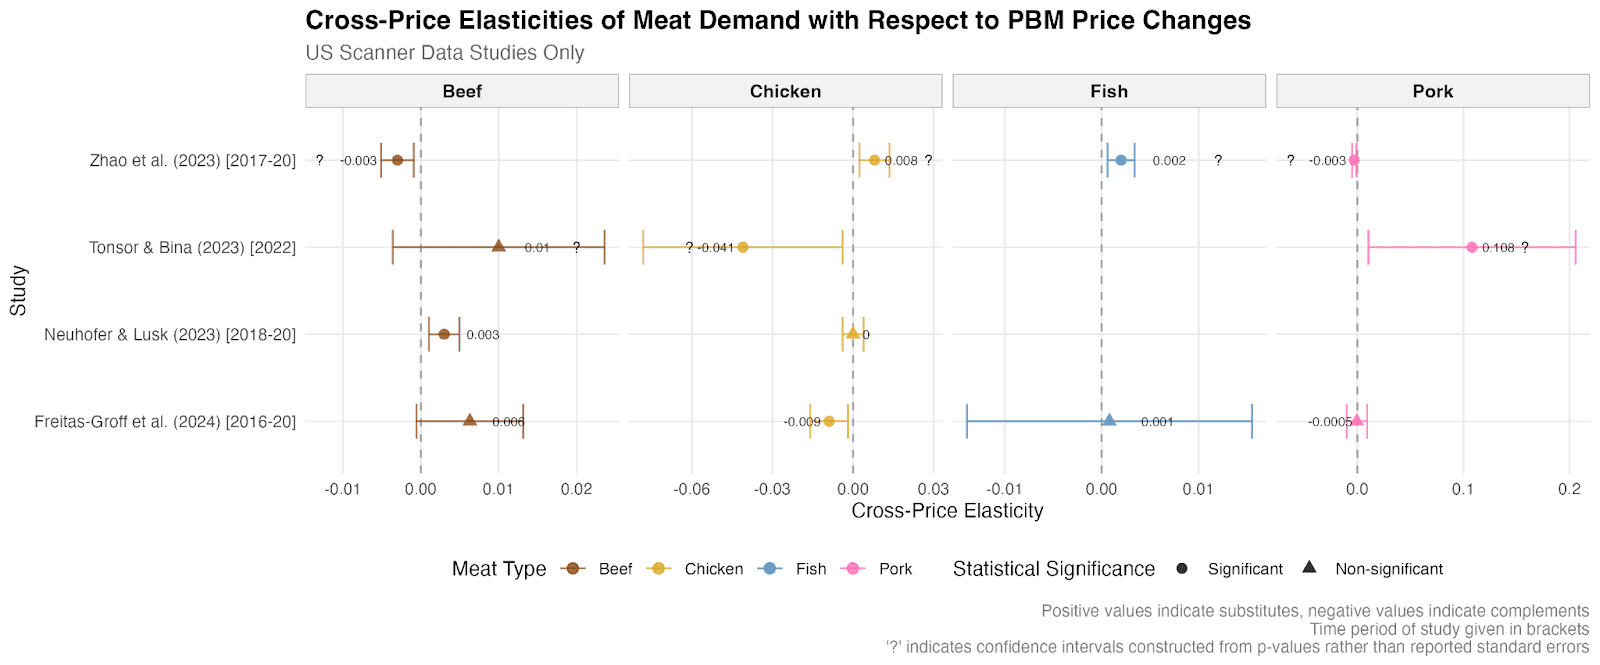
Study-specific factors don’t present an obvious explanation for the differences. Tonsor et al 2023 and Caputo et al 2025 (the top two in the plot) both use hypothetical choice experiments to elicit demand for meat and PBAs (for ‘food at home’ and ‘food away from home’ scenarios, respectively). They find conflicting results for both beef and chicken. Four studies (Zhao et al 2022, Tonsor and Bina 2023, Neuhofer and Lusk 2023, and Freitas-Groff et al 2024) all estimate demand models using retail or household grocery scanner data in the US.[11] None of these studies has results that fully align with any other study, even qualitatively; furthermore, there is no single meat category with consistent findings across these four studies.[12]
This discrepancy could come from challenges inherent in measuring substitution. Without a full picture of consumers’ animal product spending over time, researchers may miss important responses – e.g., as PBAs become cheaper, people might reduce their grocery meat purchases while increasing their consumption in restaurants. Given the relatively limited availability of PBAs, lack of data is a major challenge. The differences may also reflect genuine heterogeneity in substitution patterns, or the fact that ‘local cross-price elasticity’ may vary greatly depending on the context, such as the starting prices, etc.[13]
Endogeneity further complicates the picture. Economists see price and quantity as jointly determined by the equilibrium of supply and demand factors[14] – this makes it difficult to establish a one-way causal relationship between price changes and consumption. For example, supermarkets might raise the price of PBAs during periods of local economic windfalls, because they think consumers become particularly less price-sensitive for this “luxury” good. Consumers might tend to buy more of all meats in such periods of good fortune. A naive analysis would see higher PBA prices coinciding with higher meat sales, and overstate the extent to which PBA and meat are “substitutes”.[15] Highlighting these limitations, Bray et al (2024) found a large gap between the small price elasticities estimated through a randomized pricing experiment (across Midwestern grocery stores) and the much larger elasticities estimated using standard methods (such as instrumental variables and difference-in-difference) on comparable data from non-experimental ‘control stores’.
Formulating the Pivotal Question
Path to Impact / Goals / Model
We were happy to work with Animal Charity Evaluators (ACE) on the formulation and general direction for this question. ACE evaluates some charities involved in developing and promoting alternative proteins, so we reached out hoping to help them build a better understanding of the tangible welfare impact of these organizations. As a result of conversations with Zuzana Sperlova and Vincent Mak, we decided to focus on a question coming from their stated research priorities:
What are the effects of increasing the availability of animal-free foods on animal product consumption? Are alternatives to animal products actually used to replace animal products, and especially those that involve the most suffering? Which plant-based offerings are being used as substitutes versus complements for animal products and why?
Before honing in on more specific operationalized questions, we wanted a clear sense of how the insights would be applied. This led to the following concrete goal-focused question.
Goal-focused question(s)
Do PBAs displace animal-welfare-relevant animal-based product consumption enough to make investments in reducing their cost plausibly competitive with other animal welfare interventions?
This comes close to being precisely the decision-relevant formulation, with clear implications for funding (see this discussion and this modeling in recent posts).[16] So why not use this as our pivotal question? Given the range of unknowns involved in tackling this question (see ‘modeling’ below) we see more value in focusing our effort and expertise on clarifying the most crucial ‘building block’ questions. (See the comparable discussion in our cell-cultured meat post).
We want to understand the extent to which decreasing the price (and increasing the quality and availability) of PBAs actually leads to less meat consumption, particularly considering the numbers of animals, their sentience of pain, and the nature of the farming conditions (see, e.g., the Welfare Footprint project).
Modeling the path to impact (ToC)
We took a step back to sketch a model of how relevant choices could impact the outcomes of interest (related to a ‘theory of change’). This helped clarify the problem context and narrow down the aspects we wanted to focus on.
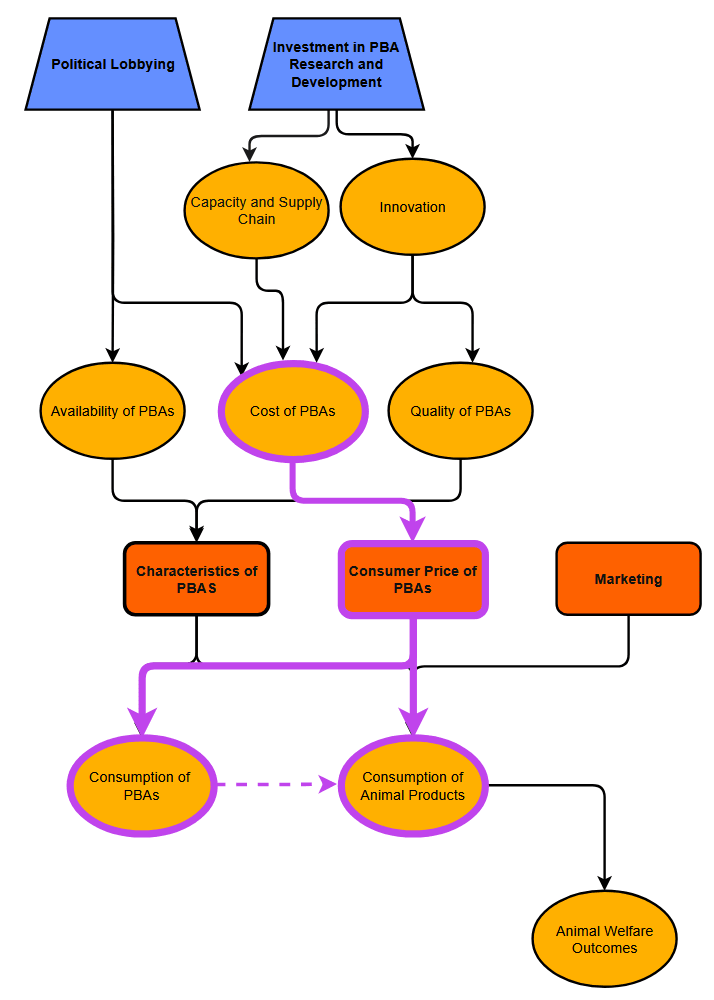
In this flowchart, variables at the top (in blue trapezoids) represent ‘inputs’: levers that we, as a community of funders and advocates, can choose or directly influence. These may drive changes in production and retail outcomes. In particular, research and lobbying could drive down the cost of producing and distributing PBAs, leading to lower consumer prices. The red-orange rectangles are factors within the control of PBA producers, some of which might be also influenced by funding and advocacy. These, in term, may drive consumer behavior, impacting the consumption of animal products, and thus animal welfare, our outcome of ultimate interest.
Goal of this model: With a full understanding of the relationship, we could target the ‘best feasible combination’ of inputs that yields the best animal welfare outcomes.[17] We could also compare different potential investment/intervention bundles to better understand ‘second-best’ choices, given other constraints.
But building that level of understanding is beyond our project’s limited scope; we instead focus on clarifying one aspect of this model. Informing each part of the model will improve our predictions about ‘how investment in PBAs will impact animal welfare’, and improve our funding choices.[18]
We decided to focus on the relationship between the price of PBAs and the consumption of animal products. (We highlight this path with a heavy purple outline). This is arguably ‘mediated’ by the purchase of PBAs (see footnote).[19] This path seemed to be the most neglected but tractable, with a substantial research base (albeit with some caveats about methodology), and most aligned with The Unjournal’s focus on economics.
We take the other causal paths as background: these are outside the scope of the current investigation. (When we build a synthesis, we will aim to use plausible/consensus values for these values, explicitly incorporating uncertainty – see footnote.[20])
These considerations lead us to our initial formulation:
What is the displacement effect of plant-based products on animal product consumption?… And how does this vary as a function of price, quality, and marketing?
After consulting with several economists working in this area, we decided to focus on the impact of price because there is more research and more data on this measurable quantity (relative to quality or marketing metrics).
Aside: Meta-issues
As suggested above, although we’re proceeding with research evaluation and belief elicitation, we have major doubts about the usefulness of standard approaches, and we’re uncertain about the best ways to frame and approach this. We highlight the following ‘meta-questions’ or ‘cruxes’ (see Theory, method, and meta-issues in our Google discussion doc.)
- Can cross-price elasticities and substitution effects be reliably and precisely estimated in a context like this? (This seems like the most important meta question).
- What sort of (~supermarket) experimental trial would be needed to yield useful estimates of cross-price elasticities for key PBA/~meat pairings, and how much would an informative trial cost?
How high a cross-price elasticity (or rate of substitution) between key products (say, plant-based beef & chicken breasts) would be necessary to justify funding R&D for PBAs? (This is essentially asking about the remaining ‘background’ parts of the ToC model sketched above.)[21]
So why not try to resolve the meta/conceptual questions in isolation before proceeding with a plausible empirical synthesis? Because this risks being “nerd-sniped” by mathematical purity and intellectual elegance while losing touch with the relevant issues.[22]
We thus decided to proceed with these meta questions and with practical empirical evidence synthesis. We expect each to inform each other. Thus, we are commissioning the public evaluation of papers such as “Observational price variation in scanner data cannot reproduce experimental price elasticities” (Bray et al, 2024). At the same time, we’re curating a list of empirical papers providing direct evidence on this question (or closely-related questions).[23]
The available research may turn out to be largely uninformative about the nature of PBA substitution. Nonetheless, we believe this exercise is likely to offer insights into the market for PBA and animal products, and provide building blocks for future work. Even if fundamental constraints make reliable estimation of substitution patterns infeasible, documenting this limitation transparently would still provide significant value. Making these constraints widely known through rigorous analysis can help redirect research efforts toward more promising avenues and inform stakeholders—particularly difference-making risk-averse funders —about the inherent uncertainties in this domain.
Operationalizing this Question
Proposed Operationalization
We’re focusing on discrete responses to price changes, e.g., “If the price of Impossible Beef were to fall by 1%, how would the number of chickens consumed change?” These can be framed in terms of arc-elasticities, but other framings used in the empirical literature (“displacement ratio”, “demand transfer ratios”) also yield predictions for these discrete responses.
But why not just target a single cross-price elasticity measure? – See footnote.[24]
We pose, as a core question :
If supply-side factors decreased IB+ consumer price by X%, how many more or fewer chickens (and other ‘target products’) would be consumed?
Fleshing this out in more detail, we ask…
- If the price of IB were to fall by 1%
- Alternatively, a 5% fall, a 20% fall, and a fall to price parity with average ground beef,
- as a result of supply-side factors
how many more/fewer (factory-farmed) chickens [alt: target products] would be consumed?[25]
Defining and explaining each of the terms above:
“Price fall”: For all grocery stores in the US,[26] falling by x% relative to the counterfactual price for that year[27]
“as a result of supply-side factors”: As a change in demand factors may drive a price change, we want to avoid this endogeneity concern. Here we imagine an external investment that leads to an innovation (or increased capacity) that reduces the marginal and average cost of production, in turn reducing driving prices by the stated amount.[28] (We could also think about an experimental truly exogenous variation).[29]
- IB+: Ground-beef imitating products from Impossible, Beyond, and close imitators
- “Would be consumed”:
- By US residents (extrapolate to global) both at home and at restaurants
- `Per year, focusing mostly on ‘next year’
“(Factory-farmed chickens)” – We define this as chickens raised in concentrated animal feeding operations (CAFOs). We put the ‘factory farmed’ in parentheses as we will likely treat all chicken comparably, and the difference is not likely to show up in the data. The vast majority of chickens in the US are factory-farmed. But some concerns remain (see footnote).[30]
Other ‘target products’:[31] b. beef, c. pork, d. shrimp/prawns, and e. fish (but see caveats about ‘seafood’ in data[32]).
Why focus on Impossible/Beyond Beef?
Impossible and Beyond Beef represent a well-known, high-end product with consistent price, quality, and availability nationwide. These high-end hamburger and ground-beef imitating products seem to be the most successful and well-defined ‘meat-substitute’ PBAs. They are generally substantially costlier than the equivalent animal product, and there's been substantial discussion and reporting about the relevance of reducing their price. In contrast, plant-based chicken products, a leading alternative example, seem to vary greatly in character, quality and price, and don't have a clear gold standard or leading brand.[33] We think that focusing our question on Impossible/Beyond will provide better measurability and definition for eliciting beliefs, and facilitate a cleaner analysis. (Still, we’ll give evaluators some flexibility to consider findings for other PBAs.)
Why focus on chicken consumption?
We want to focus attention on one outcome category, to coordinate the discussion and prediction efforts. We chose chicken to balance a range of concerns. It’s high-stakes for animal welfare, at least relative to beef or pork (see https://foodimpacts.org/ for one such calculator). Unlike fish, chicken seems to be included in most of the relevant empirical work, as seen in the earlier forest plots. As these plots show, at least some of these studies show some interaction between chicken consumption and the price of plant-based beef. (Still, we mention several other outcomes noted above, and ask evaluators to consider these as well.)
Metaculus Questions
As we refine the above operationalized questions, we will be posting versions of these in our Metaculus community, and working with Metaculus to shape other questions for their general feed. In part, this is to leverage the ‘wisdom of the crowd’, both in their predictions and in their discussion. Posting these questions and engaging with responses should also help us identify and resolve ambiguities in our PQs and our communication.
We will use these same questions (among others) and this interface to gauge the beliefs of our partners, stakeholders and experts.
Update: Due to budget constraints, we will not be sponsoring a Metaculus tournament at this point, but we’re seeking further funding to enable this soon. Nonetheless, we’re encouraging our ~200-member evaluator pool (as well as EA and Animal Welfare communities) to participate. We’ll try to provide some incentives, recognizing the strongest forecasts and discussions, and prioritizing them for future Unjournal evaluation and other paid work.
We plan to post several types of questions:
Objective and verifiable: Factual questions that would be straightforwardly resolvable by a neutral third party using publicly accessible sources; these would pass Tetlock’s clairvoyance test.
This includes binary questions like
- “Will Impossible Beef reach price-parity with conventional ground beef by 2030?” (providing some further specific definitions here)
Questions like these are likely to be interesting and tractable for people with limited time and expertise are likely to understand and find interesting. They are also likely to be correlated with our fundamental question of interest
It also includes continuous questions like
- “What will be the price of IB+ on January 1, 2030?”
As well as sets of conditional questions like[34]
- How many chickens will be consumed in the US in 2023?
- How many chickens will be consumed in the US in 2023 in the event that IB+ is no more than 10% more expensive than conventional ground beef?
- … in the event that IB+ is more than 10% more expensive than conventional ground beef?
Opinionated: Questions that resolve based on one or more individuals’ assessment.
These can be binary and reasonably simple, e.g.,
Will The Unjournal’s evaluation manager for this project conclude by [date] that $10 million invested to improve PBA would improve animal welfare more than a similar amount invested in corporate animal welfare campaigns?
They can include “predict the expert judgment” questions (see discussion in our previous post) over fairly simple questions (including questions that cannot be resolved for a substantial time). E.g.,
On Dec 31. 2026, what will be the median of the linearly aggregated[35] beliefs among the set of Unjournal evaluators and experts[36] over the average supermarket price of IB+ (per kg) on January 1, 2030.
…With all italicized terms to be defined in more detail (as in footnotes)
These can also directly target complex and detailed questions, such as our operationalized PQ itself.
E.g. “On Dec 31. 2026, what will be the median … belief among … Unjournal evaluators and experts over:
“If the price of IB+ were to fall by 1%, how many more/fewer factory-farmed chickens would be consumed per year” (see full definition in previous section)
Next Steps and Invitation for Feedback
Posting Metaculus questions (see above)
Eliciting beliefs and initial feedback: We’ll invite the stakeholders (including ACE) and domain experts (including our consultants, the evaluators, and paper authors) to provide their initial belief distributions over both the Metaculus questions and more detailed high-value questions, and to explain their thinking.
Curating and Evaluating Research: We are systematically compiling a set of relevant studies (academic or otherwise) that shed light on this question. This includes the ones mentioned above (consumer panel analyses, demand system estimates, experiments, etc.); we welcome further suggestions.
Recruiting experts to evaluate the research and the question: We’ll recruit a set of expert evaluators, seeking a combination of methodological expertise, familiarity with the context and key considerations, and aptitude for research evaluation, quantified uncertainty, and communication.
We’ll ask them to
- Consider the PQ framing and background, and provide their initial beliefs about the PQ.
- Give their broad judgment on the relevance and credibility of a subset of the curated research
- Consider and discuss ‘why they come to different results’, which are more plausible, etc.
- Prioritize one paper and provide a careful evaluation, following our guidelines but largely focusing on the implications for the PQo
- State and justify your (revised) beliefs about the PQ in light of this evaluation and your work above
Authors: We also aim to follow up with the papers’ authors, as feasible. We may be able to follow up on evaluators' questions and doubts, and could provide unique judgments on the pivotal questions. Ideally, we can also encourage the authors to follow up by providing specific high-value results and extensions. (E.g., reporting substitution effects for other PBA prices, and for the most welfare-relevant animal products, such as shrimps/prawns.)
Followup and synthesis report: As noted elsewhere, we’ll follow up by aggregating stated beliefs and resolving Metaculus questions. We’ll bring the stakeholders back into the conversation. Finally, we aim to synthesize the outputs into a report on the core questions, focused on actionable takeaways for policy choices and funding. We’ll make concrete suggestions for the most feasible and high-value next steps for this research.
We also plan to report on how stakeholders’ beliefs changed, bringing us closer to measuring the value of research and research-evaluation for impact-focused organizations, and ultimately for welfare.
- ^
This post (precisely: this version) has been given an epistemic audit and other checks with the RoastMyPost pilot tool, built by Ozzie Gooen and QURI. You can see the audit here, also pasted into the Gdoc here, with some comments. The tool is still a work in progress.
- ^
Virtually all of this post is our own language, except where stated otherwise. Naturally, we used LLM and reasoning models to help flesh out content, find potential references, and improve this post, but ultimately used our own judgment and adaptation in each case. We have been using a range of "deep research" tools to identify and categorize relevant research, including Elicit.org and Open AI.
We shared context for the current post with the latter, and it produced the report linked here. We checked this report – it seems largely accurate (with a few exceptions, e.g., Zhao et al. use Nielsen Scantrack scanner data not ‘state-level sales data’), and it largely represents our points faithfully. This report explains concepts less formally and more conversationally. Readers might find it easier to read. In fact, we quote it in several footnotes below. We’do love your thoughts over which style you prefer. - ^
This is a slight simplification. See the precise details below.
- ^
The most accurate answer might be “the best research cannot tell us much, and here’s why, and here’s our best-guess answer with uncertainty bounds”. Bringing this to light would still be a useful outcome. In contrast to some ~academic research paradigms, these PQs will be framed to help inform decisions that need to be made one way or another. Thus a ‘best educated guess’ along with an explicit quantification of uncertainty, and an explanation of the ‘epistemic basis’ (~the evidence and reasoning) is preferred to as simple ‘we cannot answer this question’. A calibrated understanding of the fundamental uncertainty can help inform decisionmakers who may prefer less ‘impact-risky’ choices as well as for determining future research funding and directions.
- ^
For brevity, we we use “meat” to encompass all animal-derived foods (meat, fish, eggs, dairy, etc.) unless otherwise specified. Naturally, this will not include "plant-based meat."
- ^
Jacob Schmiess did much of the survey of previous work estimating cross-price effects in this area, and produced and discussed these forest plots.
- ^
Of course, these CIs only consider sampling variation, and don't account for other sources of modeling uncertainty.
- ^
Code and data are here. We may further adjust the format of this plot.
- ^
E.g., for beef, two studies report no statistically significant relationship. Liu and Ansik report very wide confidence intervals, suggesting their data has little power to detect either complements or substitutes at standard statistical significance thresholds. Nonetheless, if the study's methods have some credibility, a Bayesian should update in the direction of the point estimates even if they are not "statistically significant." Indeed, this would be reflected in a typical meta-analysis.
- ^
In some cases, the reported relationships are extremely small, and perhaps not economically meaningful.
- ^
Liu and Ansinik 2024 is the only one of these studies to use consumer data outside of the US, finding no significant cross-price effects using supermarket data in the Netherlands.
- ^
I.e., no two studies estimate the same sign as each other for all meat products. Furthermore, in no case do four studies estimate the same sign for a given meat product.
- ^
As chat-GPT o3 elaborates,
Moreover, different studies may be capturing different consumer segments. Early adopters of plant-based meats tend to be younger, higher-income, health- and environment-conscious consumers[7][8]. These folks might be adding plant-based products on top of already moderate meat consumption (hence the small displacement observed), whereas a broader population might react differently if plant-based options become more mainstream or cheaper. Local context and heterogeneity likely matter: a 1% price drop starting from a very high price (e.g. Beyond burgers at $9/lb) might not spur the same behavior change as a 1% drop when the products are near price parity with meat. In economics terms, the cross-price elasticity of demand could vary across the price range and across consumer demographics.
- ^
A quick recap of econ-101: Firms choose quantity (or price, depending on the model) in order to maximize profits given their production constraints (cost structure). The price they can charge to sell a given quantity (or vice versa) are determined by consumer “demand curve” and by the market structure (the number of competitor firms, etc.). Firms may also enter or exit. Consumers choose their consumption baskets to maximize their ‘utility’ given their budget constraints. The price and quantity arises as a confluence of these factors; ~the ‘market equilibrium’. Government intervention (regulation, taxes and subsidies) may also play a role.
- ^
This example is somewhat contrived; it is hard to come up with a simple intuitive of endogeneity yielding a bias to cross price elasticities because these relationships are rather complex and intricate. Note that the example above suggested prices might be higher during periods of high demand: this is called ‘countercyclical pricing’. The opposite, procyclical pricing, has also been documented.
- ^
More precisely, these funding decisions would be most informed by understanding:“What is the mean (or the distribution of) the ratio of the impact per dollar of PBA interventions relative to other animal welfare interventions”, or perhaps even the individual and joint distributions of impact for each. For some visualizations, discussion of how this can be modeled, and why uncertainty is important, see Quantifying Uncertainty in GiveWell CEAs, GiveWell’s Uncertainty Problem, and Methods for Improving Uncertainty Analysis in EA cost-effectiveness models.
- ^
These outcomes might be expressed as the summed product of an ‘animal product consumption’ vector and the ‘welfare footprint of each product’ vector.
- ^
O3 Deep Research puts it in simpler terms:
> However, many factors would go into that full calculation – not just substitution rates, but also the cost trajectory of the products, the scale of consumption, rebound effects, and differences in welfare impact between species. Rather than tackling everything at once, we’re focusing on what we see as the crucial “building block” question: the degree of substitution itself. This is a key input to any impact model. Even if we can’t fully answer the question “should we fund plant-based innovation or something else?”, we can try to nail down one big component of that: If plant-based foods get cheaper or more accessible, how much animal product consumption do they displace?” - ^
In a typical discussion, we might say, "we expect that as plant-based meats become cheaper, people will buy more of them, which causes them to buy less traditional meat." However,, economists typically consider a “joint optimization” decision to purchase a basket of goods as a function of characteristics and prices given budget constraints. They may consider how the quantity of good A is consumed as the price of good B is consumed, all else held constant. But with some exceptions, they don't typically model this as a’ sequential decision to change the consumption of good B and then adjust the consumption of good A in response to that.’ Still, this logic underlies some of the discussion and identification approaches, perhaps suggested by Neuhofer & Lusk, 2022 and Cuffey et al, 2022. However, PBA price and marketing might also impact meat consumption directly in unexpected ways; e.g., results from Wang et al., 2022 suggest ads for Impossible Burgers might increase consumption of beef hamburgers.
- ^
We've had some challenges finding public estimates (or even expert predictions) over the impact of investment in R&D or political lobbying on the cost or price of PBAs. We’ve worked with ChatGPT o3 Pro to construct a model here based on comparable existing work, reference groups, and bounding arguments. As this is intended to be ‘background’ we may not have the bandwidth to carefully audit this. Fwiw, that model’s latest take suggests, for a $10 million investment in R&D or political lobbying, an impact of about 0.05% on the baseline price over the century (close to 1 cent per kg of Impossible Beef). Naturally, we put very little confidence in this unvetted estimate; perhaps it simply represents a value that the LLM thinks is consistent with what researchers might intuitively find plausible.
Where we need to map from cost reductions to price, this depends on the nature of competition and thus what is called "pass-through."
For mapping from "meat consumption" to animal welfare, we may consider estimates derived from the Welfare Footprint Project, as done at https://foodimpacts.org/. We might also consider Faunalytics’ Animal Product Impact Scales, or other measures. The cross-species comparisons are likely to be most important here in comparing across interventions (e.g., corporate campaigns targeting eggs vs. shifting purchases of broiler chicken.) We need to be careful that the estimates are relevant to such comparisons, rather than to comparing across different farming conditions.
- ^
Credible estimates of this "background" could tell us what range of cross-price elasticities might make funding PBA the highest-value intervention. For example, it might require elasticities so large as to be implausible, implying there is little value in doing the demand estimation. It may also give us a sense of how precise elasticity estimates need to be to be practically useful.
- ^
Also, the deeper questions may never be definitively resolved, although we may increase our credence in one approach or another. I suspect the highest value approach is to work on the deep methodological/theoretical questions and the empirical estimation in parallel, and provide a ~synthesis of the estimates from each approach weighted by our confidence in that approach.
- ^
For our current list, see expand the relevant coda row here and look for the ‘relevant research’ column. We aim to share more discussion of these papers soon..
- ^
We initially thought of framing this question in terms of a single cross-price elasticity measure ~the proportional change in consumption of chickens for an infinitesimally small proportional change in the price of PBA. But cross-price elasticity is unlikely to be constant and homogenous, and it’s not clear what the “best” estimate of this parameter would even mean. (To steelman it, it could something like “if we were forced to use a constant elasticity parameter, which parameter would yield the most accurate forecasts for the decisions of interest?”) So we can’t ask for empirical beliefs about a constant homogenous price elasticity, because you can’t make a prediction for a theoretical case. Forcing the research and evaluators to focus on a single elasticity parameter also seems likely to lead to less accurate forecasts for the real quantities of interest.
O3 states this more simply:
We deliberately didn’t ask something like “What is the cross-price elasticity of beef vs plant-based meat?” as our main question, because that is a more abstract parameter and likely not constant. Instead, we focus on discrete outcomes (so-called “arc elasticity” outcomes): a concrete percentage price change leading to a concrete change in consumption. These are easier for experts to think about and for research to inform (studies might report, say, a 20% drop in Beyond’s price led to X% change in meat sales in an experiment). It also sidesteps some ambiguities about which elasticity (point elasticity at what price? long-run vs short-run? etc.). If needed, we can convert answers back into an implied elasticity in a specific range, but stakeholders ultimately care about the outcome (animals spared or not), not the parameter itself
… Our approach … can capture potential nonlinearity (maybe the first 5% drop does little, but approaching price parity has a bigger effect, etc.).
- ^
Alternatively, in line with elasticity computations we could pose this as a percentage, i.e, what % fewer would be consumed? If the ‘number of chickens’ proves challenging to consider, we can proxy this with “ounces of broiler chicken meat.”
- ^
Naturally, we would be most interested in the impact of a proportional price drop for global consumption, not just the USA. But we expect most of the research here to use US data and outcomes. Results for the US could be extrapolated to global results. We’d also prefer estimates that included not just grocery sales, but also wholesalers and restaurants, but again, that may not be feasible. The price drop should be thought of as a permanent price drop, not a one-off sale; this is important when considering inventory behavior and intertemporal substitution.
- ^
In other words, if Impossible was heading for $8/lb next year but an intervention makes it $7/lb (12.5% drop), how does that affect animal product consumption?
- ^
Alternatively, this could be driven by a subsidy or regulation change, or a change in market structure.
- ^
O3 explains it less formally:
Driven by supply-side factors: This clause is to clarify the cause of the price change. We imagine the price drop comes from improvements in supply (e.g. better production efficiency, economies of scale, or a subsidy) rather than a shift in consumer demand. Why? Because if, say, consumer preferences changed and that led to lower prices (due to lower demand), that’s a different causal story. We want to isolate exogenous price changes – like the product just got cheaper to make, so it got cheaper to buy, with consumers reacting to the lower price. This helps avoid the endogeneity issue where causality could run backwards. (Think of it like “what if Impossible Foods magically halved their prices overnight – what happens to meat sales?”)
- ^
This might matter more for 10-20 years out if ethics change, but that’s not likely what the ~economists/empirical research would be focused on, so we can abstract it out.
- ^
This is a first-pass guess at the priority order, combining animal welfare relevance, feasibility, and research insight considerations. Beef has less welfare priority, but it’s the most obvious thing to look at because that’s what impossible beef is meant to resemble, and thus it may tells us something in general about how meat-imitating products displace their corresponding animal products (or fail to). While (farmed) fish and especially shrimp have greater welfare significance than pigs (at least according to EA standards and the Welfare Footprint project), there seems to be less data and analysis for the seafood category.
- ^
At a brief skim, about half of the relevant papers consider fish/seafood. Of these, only Tonsor and Bina (2023) specifically isolates shrimp in Nielsen consumption data (suggesting this is feasible!) and Freitas-Groff et al. (2023) separate fish and shelfish outcomes (also Nielsen data).
- ^
E.g., 13 brands of chicken nuggets, and 2-3x price variation. (The latter link is an unverified ChatGPT query).
- ^
Note that the difference between C and B might be loosely interpreted to reflect the causal impact of bringing IB+ to rough price parity. However, this is not generally the case, as the factors that tend to coincide with price parity may also tend to reduce or increase chicken consumption (see, e.g., longer explanation on LessWrong here).
- ^
Linearly aggregated: Essentially, adding the pdfs (distributions) vertically and re-scaling these to sum to probability=1. This is not the standard Metaculus aggregation (see discussion in the previous post here]).
- ^
We would provide a specific list, probably including Evaluators of papers tied to this pivotal question, authors of the papers these evaluators choose to focus their evaluations on, Consultants: Trevor Woolley, Jacob Peacock and Jacob Schmiess, up to 2 additional consultants to be named by David Reinstein, and perhaps named ‘stakeholders’ at ACE and beyond.
david_reinstein @ 2025-12-04T11:45 (+2)
Posted and curated some Metaculus questions in our community space here.
This is preliminary: I'm looking for feedback and also hoping to post some of these as 'Metaculus moderated' (not 'community') questions. Also collaborating with Support Metaculus' First Animal-Focused Forecasting Tournament.
Questions like:
Predict experts' beliefs over “If the price of the... hamburger-imitating plant products fell by 10% ... how many more/fewer chickens consumed globally in 2030, as a +/- percent?
david_reinstein @ 2025-08-11T23:20 (+2)
I added some polls (at top and integrated in relevant sections) to get a pulse-check and foster discussion.
FlorianH @ 2025-08-08T09:11 (+1)
Tiny comment re "Quality": Quality has imho two entirely distinct components that might interact with Price in very distinct ways:
Q.A: Texture Taste Cookability (Look)
Q.B: Actual value compared to meat in terms of health and/or muscle effect.
I suspect Q.B (or simply uncertainty in people's mind about Q.B) is a strong reason for many to not fully switch to plant a bit independently of cost (and taste or whatever). Might be ideal to track separately from Q.A in some analysis.
david_reinstein @ 2025-08-08T13:21 (+2)
I agree, and we will try to incorporate this in.
However, we are focusing on price (for the fairly well-defined Impossible/Beyond ground beef product). We're doing this because it's difficult to find measures of quality (or health benefits) in the (~supermarket) datasets involving real purchases, and even harder to find measures of exogenous variation in these.